Saturday, September 24, 2022

Weekly Indicators for September 19 - 23 at Seeking Alpha


 - by New Deal democrat

My Weekly Indicators column is up at Seeking Alpha.

For the third week in a row, interest rates increased, and gas prices, along with the prices of other commodities, tumbled.

While the decline in gas prices is good, the downturn in other commodity prices is a sign of weakening global demand.

Once the decline in gas prices stops, I suspect the economic skies will darken rather quickly.

In the meantime, clicking over and reading should be educational for you, and will put a couple of Pennie’s in my pocket.

Friday, September 23, 2022

Focusing on the short end of the yield curve


 - by New Deal democrat 

When most analysts talk about yield curve inversions, they typically mean a measure of the 10 year bond vs. a shorter maturity like 3 month or 2 years. These certainly have merit - in fact the 10 year minus 2 year inversion has typically had the longest lead time before recessions.


But the NY Fed has written that special attention should be paid to the short end of the yield curve, i.e., 2 years and less. That is the portion of the yield curve that is most responsive to the Fed, and what the trajectory of the economy is likely to be in the next year or two. In general, once the shortest end inverts (i.e., Fed funds and 3 month maturities) vs. 1 and 2 year maturities, the bond market is pricing in a recession within that time period, because it is anticipating that the Fed will have to lower rates in that timeframe.

For example, here is the 2000-2001 timeframe:


In the first half of 2000, 1 and 2 year yields are higher than the very short term yields, but are tightening. By the second half of 2000, yields are completely flat across the range, and then fully inverted. By early 2001, as the Fed along with everyone else smelled that a recession was imminent, Fed rates came down, and only as the recession itself progressed did rates begin to normalize.

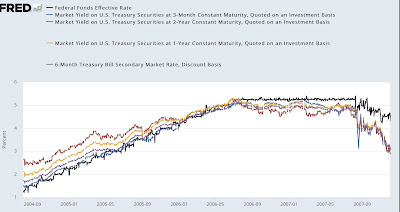
Here is 2005-2007:


Note the similar progression, as yield ranges tighten but remain positively sloped in 2004-05, but then flatten in spring 2006 before completely inverting later in the year. In 2007, as the Fed and the market smell a recession approaching, the Fed lowers rates, but the inversion persists.

Now here is the present (note this week’s rate hike to 3.12% is still not shown in the Fed funds line):


Only the 1 vs. 2 year range has inverted. While all rates are rising, the shortest term remain positively sloped.

The yield curve is not perfect. As I have pointed out many times, there were at least 5 recessions between 1933 and 1957, when the Fed first started manipulating the Fed funds rate. In those cases there were no inversions. But at the moment the yield curve is almost alone among all indicators in not straightforwardly forecasting a recession in the next 6-12 months. The yield curve from 1 through 10 years out is completely inverted, and the 10 year is yielding less than the 6 month treasury. But the short end of the yield curve is still normally sloped.

Thursday, September 22, 2022

Jobless claims: the positive trend continues


 - by New Deal democrat

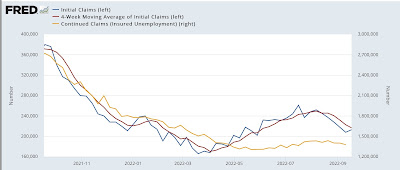
For yet another week, initial jobless claims continued their reversal from had been in an almost relentless uptrend from spring through early August.

This week initial claims rose -5,000 to 213,000 from a revised 3 month low of 208,000, while the 4 week average declined another -6,000 to a new 3 month low of 216,750. Continuing claims, which lag somewhat, declined 22,000 to 1,379,000:


I have expected continuing claims, which lag slightly, to reverse lower, and they have, from a revised high of 1,437,000 on August 20.

Once again, this is almost certainly a positive side-effect of lower gas prices.

That being said, the long term outlook in next year remains negative; and has only worsened in the last several months, and was not helped at all by yesterday’s Fed rate hike.

Wednesday, September 21, 2022

August existing home sales: confirmation that house prices have peaked


 - by New Deal democrat

Existing home sale by themselves are not that important economically, since there is a mere transfer in ownership, rather than a complete build. But they can help verify turning points, and in this case very importantly as to prices.


But first, sales declined slightly (-2,000) to 4.80 million annualized. This is the lowest seasonally adjusted monthly number since June 2020, is 20% off its post-pandemic peak, and is also the lowest in nearly 6 years excluding the worst of the pandemic months (via Mortgage News Daily; note this morning’s data is not included yet):


But we’ve known that home sales have been declining all this year in the face of Fed rate hikes and their attendant higher mortgage rates.

As I always say, sales lead prices. Since sales turned many months ago, when will prices turn? Remember that in “real,” income adjusted terms, median house prices have been as high as and even slightly higher than they were at the peak of the housing bubble over 15 years ago.

And here, we have important confirming data this month. The NAR does not seasonally adjust its measure of median existing home prices, so YoY is the only way to measure. My rule of thumb for such metrics is that they have peak when their YoY% increase is less than 1/2 of its peak increase in the past 12 months.

In August, the YoY% price increase was 7.7%:


That is less than 1/2 of the 16.5% YoY increase last August. It is also less than 1/2 of the YoY% increases in every month beginning November of last year through May of this year with the exception of March. In other words, existing home prices probably peaked sometime early this summer.

Since non-seasonally adjusted median *new* home prices likely peaked in June, per the same rule of thumb, as shown in the graph below:


this means that prices are declining throughout the entire housing market.

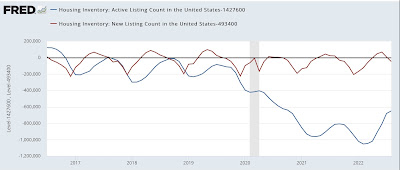
Housing inventory is still tight, however. In August, there were 444,600 new listings and 779,400 total listings. As shown in the below graph, new listings (red) were only slightly below their pre-pandemic August average of 493,400, but total listings were about 650,000 below their pre-pandemic August average of 1,427,600:


New listings have generally been increasing, but they will have to increase a lot more for total listings to return to their pre-pandemic levels.


Tuesday, September 20, 2022

Housing: permits and average starts decline, while construction remains at peak


 - by New Deal democrat

The data on housing construction this month was mixed. While starts rose, their 3 month average, at 1.511 million annualized, was the lowest since September through November 2020. Meanwhile total and single family permits both declined, both to the lowest since June 2020:


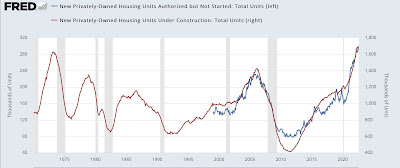
This year I’ve also been looking at the record number of housing units that had permits, but had not yet been started. These have been at 50 year highs, and distort the economic signal from permits, because it is construction itself that is the actual economic activity. And here, the evidence is mixed.

From the long term point of view, both housing units permitted but not started and housing under construction continue at record peak levels:


But a shorter term view shows that units not yet started have been flat since March, and housing under construction has increased only 2% since April:


Historically, housing permitted but not yet started has typically peaked only shortly after permits. Housing under construction has peaked with a longer delay:


We appear to be very close to (housing under construction) or even slightly past (housing not yet started) the inflection points for both of these metrics.

For the past two months I have emphasized that “Housing under construction is the ultimate coincident marker of housing economic activity. Once that begins going down, housing’s contribution to the economy is negative in real time.“ We appear to be close to, but not quite at, that point.

With that in mind, here are single family permits (blue, left scale) vs. housing under construction (red, right scale) since the latter statistic started in 1970:


Historically a recession has usually followed within a year of single family housing permits down 25% from their peak, as they are now. In several cases (1969, 2001) the recession had already started. There are several exceptions, notably 1966 and 1984, when either large fiscal stimulus (Vietnam war and Great Society spending) or interest rate reversals occurred. At the moment neither of those are in prospect.

At the same time, with the sole exception of the 2020 pandemic lockdown recession, construction - an even smoother metric than single family permits - has always peaked at least 6 months before the onset of recession, with a median time of 18 months, and as much as 47 months; and has declined at least 6.5%, and as much as 34%, with a median decline of 20% from peak.

So, permits are telling us that we are likely heading for recession, while actual housing under construction is telling us, by no means yet.

Monday, September 19, 2022

Coronavirus dashboard for September 19: no, the pandemic is *not* over


 - by New Deal democrat

Contrary to the statement by President Biden last night, the coronavirus pandemic is *not* over.


First, here’s the long term look at infectious particles in wastewater by Biobot, compared with confirmed cases:


Levels of COVID in wastewater continue to be as high as at any point before last winter’s original Omicron onslaught. And confirmed cases are at levels that were moderate - but not terribly low - before Omicron as well.

Hospitalizations have decreased by slightly over 1/3rd, from 46,000 to 30,000, from their peak in June, but are not as low as they were in summer 2020, summer 2021, or this past spring:


Where there is a definite abatement from earlier times during the pandemic is in deaths:


In the past 6 months, deaths have generally averaged between 300 and 500 a day, and are presently a little over 400 This is lower than at any previous point during the pandemic except for June and July 2021.

Deaths among the elderly continue to be about 3/4’s off all deaths from COVID:


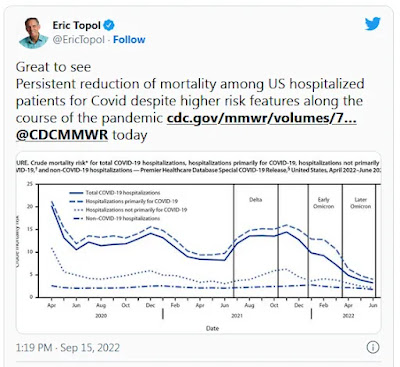
But the mortality rate for hospitalizations due to COVID has declined dramatically:


Weekly excess deaths have waned to an extreme minimum:


Together, these statistics suggests that a large share of people who die from COVID are the elderly who were already in poor health with compromised immune and other systems, who likely would have died from other causes in the immediate future.

Although I won’t bother with a graph, it is also true that the likelihood of dying from COVID skews heavily in the direction of those who are either not fully vaccinated, or are entirely unvaccinated.

Meanwhile, the CDC has updated its variant information. A  week ago there appeared to be an anomalous increase in the original BA.2 variant. When we last saw something like that, it turned out that it was really new variants BA.4&5. and for the first time in several months. This has been the case again, as several new variants are making headway:


The two new variants that have appeared in the analysis are BA.2.75.2 and BF.7, also known at BA.5.2.1.7.

BA.2.75.2 is a subvariant of a strain that originally caused an outbreak in India several months ago. BF.7 is one of the many subvariants of BA.5 that have appeared globally. While I haven’t found a lot of analysis of the two in the past several weeks, I did find this:


The below article on the progress of BA.2.75.2 and BF.7 in other countries compared with BA.4.6 in particular states:

GISAID data shows that in many other countries where BA.4.6 has made significant inroads, it quickly faded in the face of another heavily-mutated new Omicron variant, dubbed BA.2.75. It was first sequenced in May in India, where it has spread rapidly.

In countries like Spain, Germany, the U.K., Ireland and Italy where BA.4.6 initially made way against near-uniform dominance by BA.5, BA.2.75 has beat back both of those predecessors and become dominant.


 The article quotes biology Professor Tom Wenseleers of the Catholic University of Leuven, Belgium (author of the above tweet), who stated: 

Omicron BA.4.6 was short-lived: virtually everywhere it will be outcompeted by the fitter BA.2.75 & BF.7 / BA.5.2.1.7 that emerged in the meantime.

In short, the pandemic is by no means over. At the current rate of 400 deaths daily, there will be nearly 150,000 deaths annually from COVID. And at the rate of 300,000 new infections per week, about 1/3rd of all Americans will be infected during the year.

If you go maskless indoors, you are likely to catch COVID sometime soon. Depending on your age, the state of your immune system, and vaccination, your outcome will be better or worse. Yes, the pandemic is gradually transitioning to an endemic disease. But by no means are we there yet.

The Ukraine war spike in energy prices has completely unwound


 - by New Deal democrat

I plan on putting up a Coronavirus update later today, because there have been a few significant developments (No, the pandemic is *NOT* over) particularly as they relate to the next few months. Tomorrow and Wednesday, we get our first batch of monthly housing data. In the meantime, today let’s update the situation with energy prices.


And here, the news is unequivocally good. Oil prices, as of this morning, are under $83/barrel. They have remained under $90/barrel for this entire month. Even more importantly, if you follow the dotted line on the below graph all the way to the left, you can see that oil prices now are *lower* than they were before Russia invaded Ukraine:


They are still higher than they were a year ago, when oil was priced at about $70/barrel, but this has been creating, and will continue to create, a second wind for American consumers.

Gas prices, which follow oil prices with a 2 or 3 week delay, are back down to an average of $3.64/gallon, only about 5% higher than they were before the Ukraine invasion:


It is very likely that gas prices will decline to $3.45 or less within the next few weeks, again completely undoing their Ukraine war spike.

Keep in mind, I make no forecast about the future course of oil prices. This is a nowcast only. But the immediate forecast for gas prices is very good.

There’s been a spate of positive coincident economic data in the last month or two, and we can expect this to continue so long as gas prices continue to decline. We only have 12 days left in the 3rd Quarter, and DOOOMers hoping for a third consecutive decline in GDP are probably out of luck.