- by New Deal democrat
Here is the update through yesterday (April 17)
There are some extended comments I want to make about the pandemic, and some graphs comparing States, etc., that are best done separately, so this will be an abbreviated update.
Here are yesterday’s numbers.
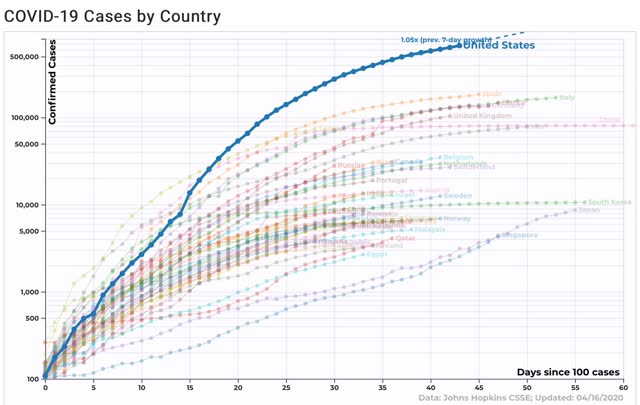
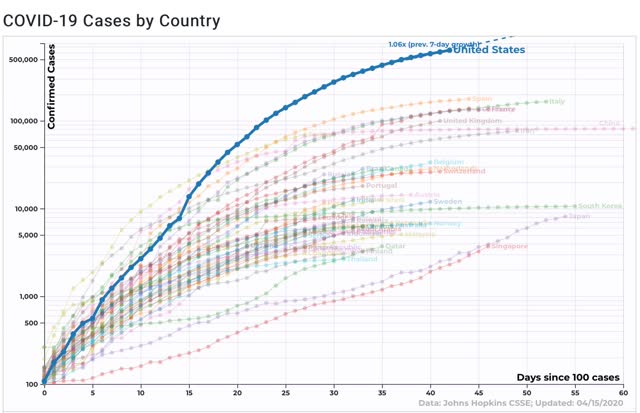
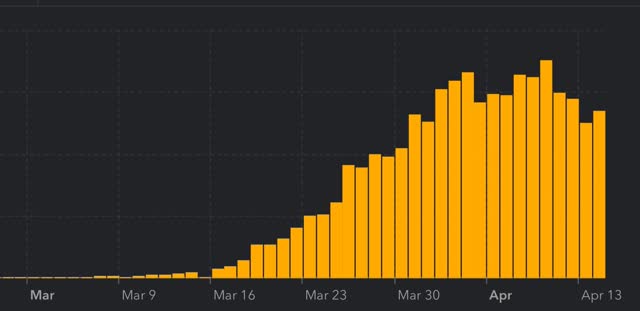
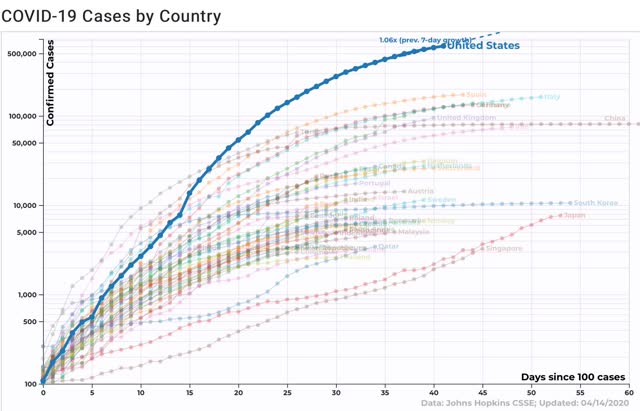
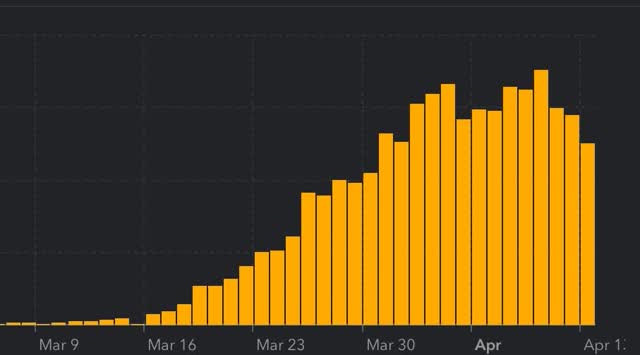
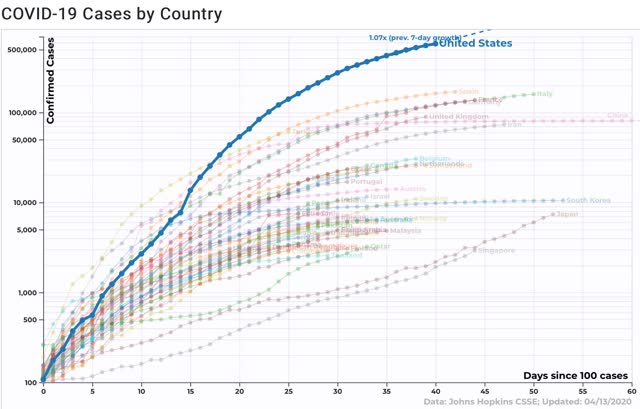
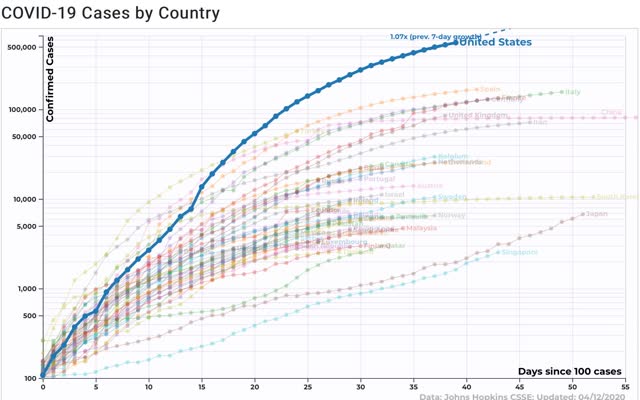
Number and rate of increase of Reported Infections (from Johns Hopkins via arcgis.com)
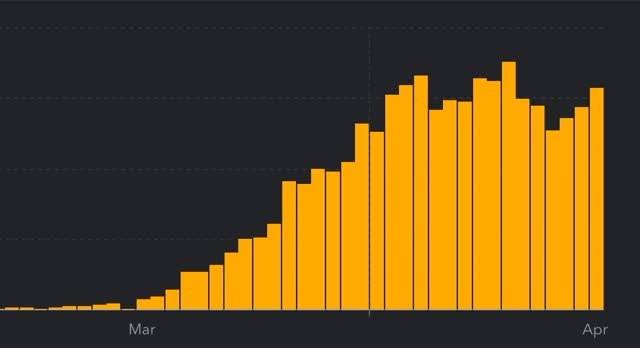
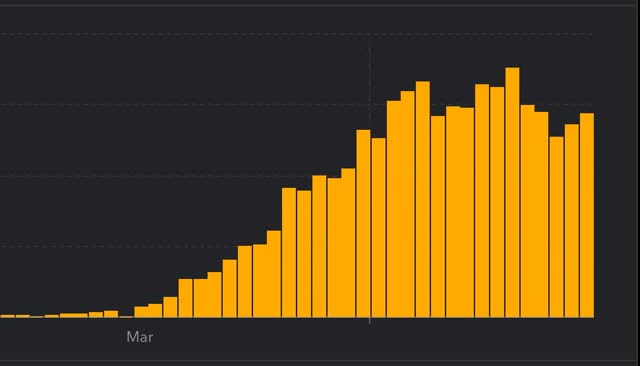
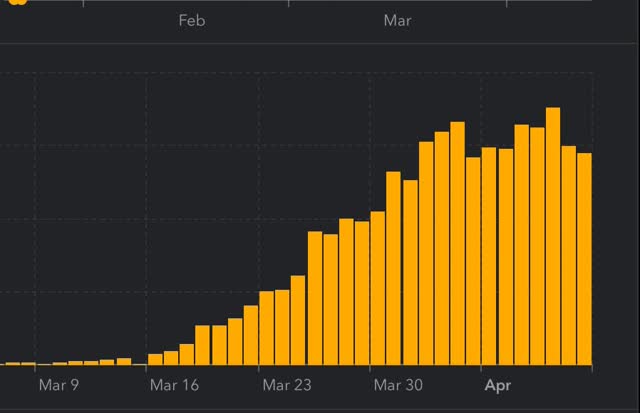
- Number: up +35,354 to 706,779 (vs. 35,219 prior peak on April 10)
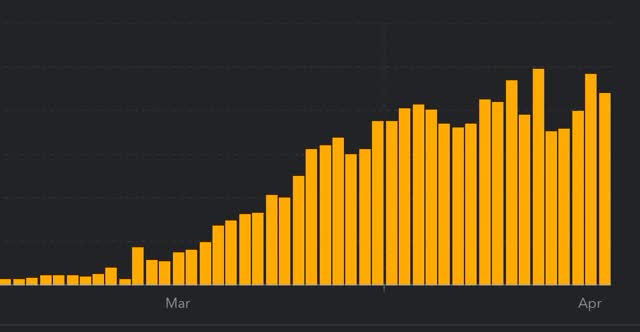
- ***Rate of increase: day/day: 5% (vs. 5% for the past week, and 5% on April 15)
The number of new infections made a new peak yesterday. The increase in the past four days puts us back at the plateau from one week ago.
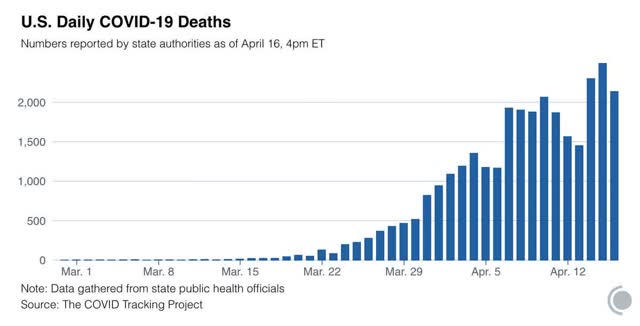
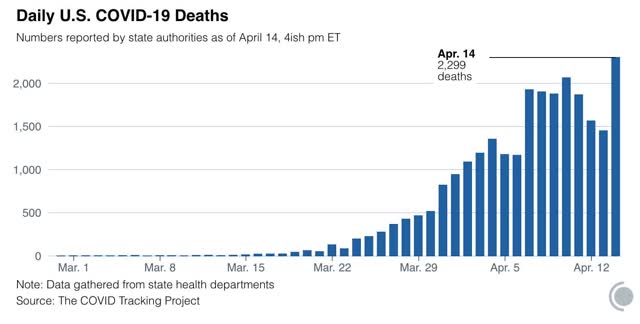
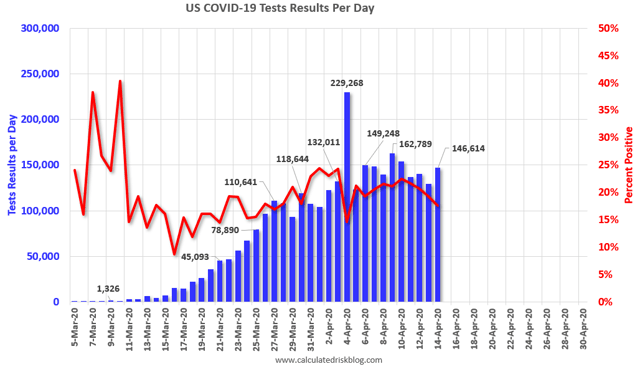
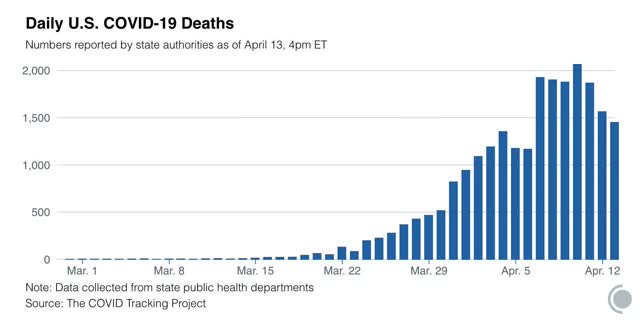
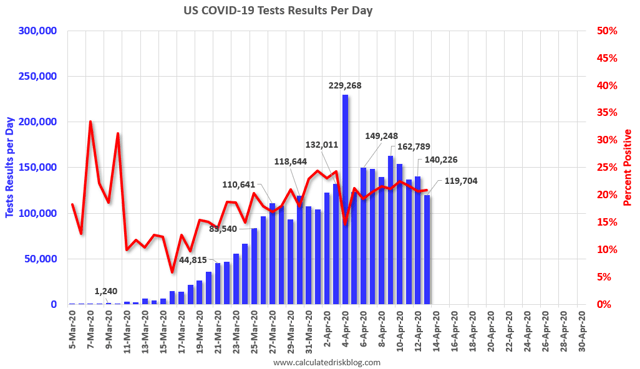
Number of deaths and infections and rate of increase of testing (from COVID Tracking Project)
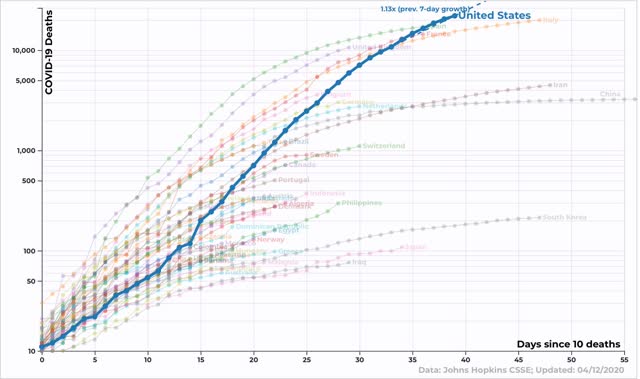
- ***Number of deaths: Total 32,365, increase of +2,069 day/day (vs. 2,492 daily high on April 15)
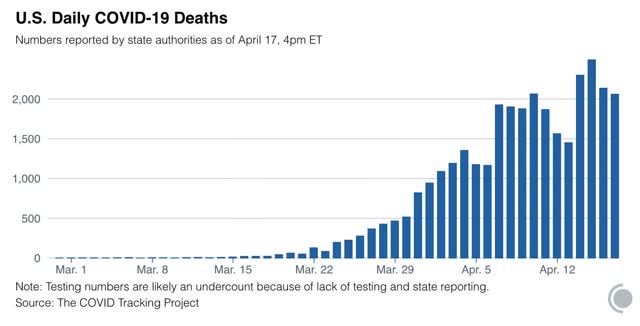
- Rate: increase of 7% day/day vs. average of 9% in past week
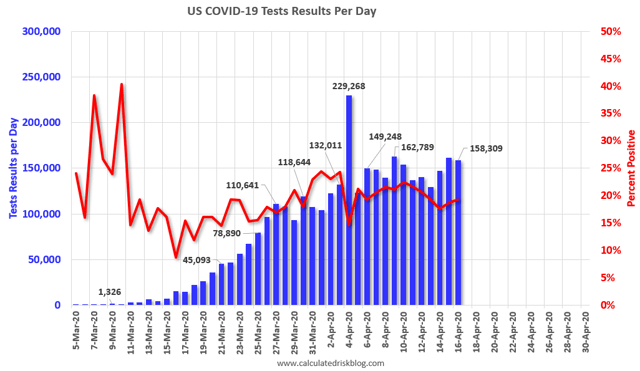
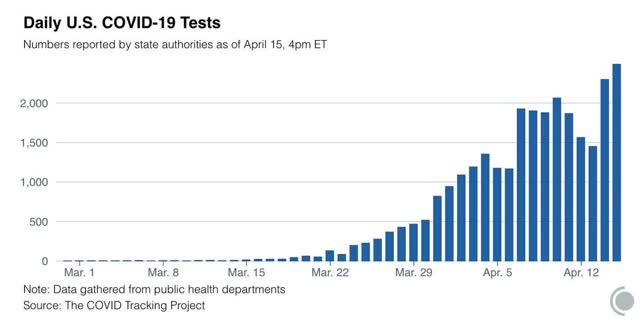
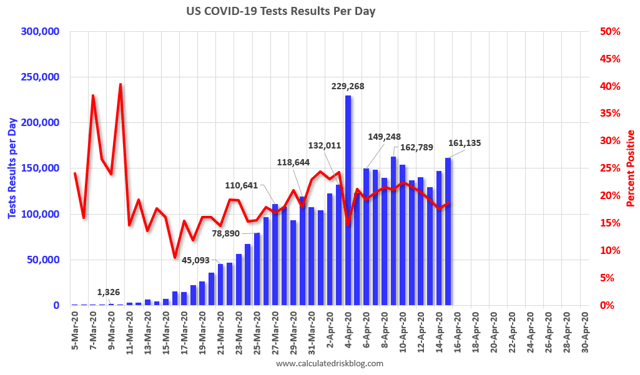
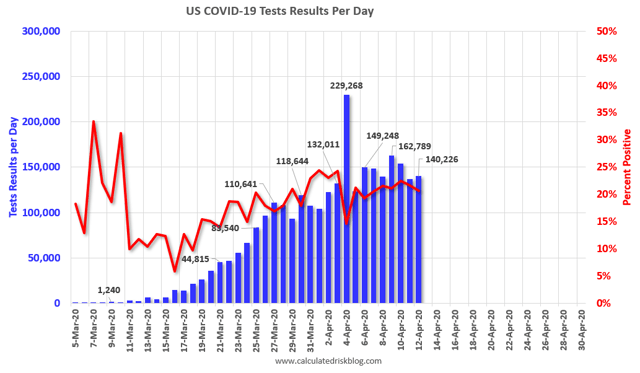
- Number of tests: 156,429, down -1,880 day/day (vs. 163,769 peak on April 9)
- Ratio of positive tests to total: 5.0:1 (vs. 5.8:1 peak on March 28)
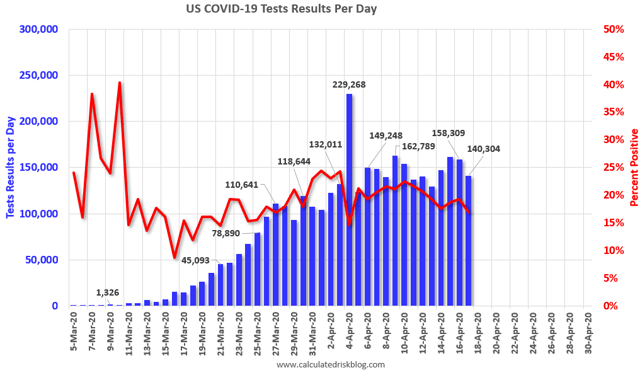
We still aren’t testing nearly enough.
New infections have been increasing at a rate of 5%/daily for a week now, and are back at their peak levels daily from a week ago.
In no way is the US ready to “open up” at all.