Saturday, January 4, 2025

Year end Weekly Indicators at Seeking Alpha


 - by New Deal democrat


My “Weekly Indicators” post is up at Seeking Alpha.

Both the long leading and short leading indicators have weakened in the past two weeks. The former is due to the short end of the Treasury yield curve re-inverteg. The latter is due in part to continued weakness in new jobless claims, but mainly to commodities weakening, and the flip side of that coin, a major strengthening of the US$. Here’s a graph of the US$:


As you can see, it made new all-time highs this week against other currencies (blue, right scale), and has surged YoY by well over 5% (red, left scale), one of the strongest moves in the past 20 years.

When the US$ increases sharply like that, imports get cheaper and exports suffer. This negatively affects GDP. Starting new trade wars obviously won’t exactly help that situation.

As usual, clicking over and reading will bring you up to the virtual moment as to the state of the economy, and reward me with some lunch money.

Friday, January 3, 2025

ISM manufacturing index improves in December, signaling near term continued economic expansion


 - by New Deal democrat


Unusually this month, the ISM manufacturing index was delayed one day after the first business day of the month. In other words, it was released this morning instead of yesterday.

In any event, a refresher that because manufacturing is of diminishing importance to the economy, and was in deep contraction both in 2015-16 and again in 2022 without any recession occurring, I now use an economically weighted three month average of the manufacturing and non-manufacturing indexes, with a 25% and 75% weighting, respectively, for forecasting purposes.

In the indexes, any number below 50 indicates contraction. It used to be the case that numbers below 48 indicated recession. Now the ISM says that any number above 42.5 is consistent with expansion. 

In December, the total index rose 0.9 to 49.3, while the more leading new orders subindex improved 2.1 further into expansion territory at 52.5. 

Including this month, here are the last six months of both the headline (left column) and new orders (right) numbers:

JUL. 46.8. 47.4
AUG 47.2. 44.6
SEP 47.2. 46.1
OCT 46.5. 47.1
NOV  48.4. 50.4
DEC 49.3. 52.5

Here is what the total index looks like graphically for the last three years:


And here is the graph of the last three years for the new orders subindex:


The three month average for the manufacturing index is 48.1, and for the new orders component 50.0. For the past two months, the average for the non-manufacturing headline has been 54.0 and the new orders component has been 55.5. Thus, unless the non-manufacturing index for December completely tanks when it is reported on Monday, the combined indexes strongly suggest continued expansion for the next few months.

Thursday, January 2, 2025

More worrisome signs as construction spending, especially for residential construction, declines with negative revisions


 - by New Deal democrat


Last month I started by report on construction spending by writing “ Construction spending for October also came in generally positive. On a nominal basis, total construction spending rose 0.4% to a new record, and residential spending rose 1.5%.”


Well, you can forget that, because this month was one of those times when revisions to past data make all the difference.

On a nominal basis, total construction spending was unchanged, while residential construction spending rose 0.1%. But total construction spending for both September and October was revised downward by 1.0%. The carnage in residential construction spending was even worse, with both September and October revised down by -3.2%! Thus what was a (surprising) rising trend line for residential construction spending in particular was completely reversed, as shown in the graph below:


As revised, even nominally both series peaked in May of 2004.

The prices of construction materials were declining through September, making real construction spending even better. But that has reversed as well, with prices rising in both October and November, making the “real” declines in the nominal graph above even steeper:


This is particularly worrisome, because manufacturing has been in a slight downtrend for two solid years. Thus it has been construction which has been aiding improvement in the economy since then. If construction has also rolled over, then goods production as a whole - and employment in goods production - are probably close behind. As to which, recall that employment in construction and goods production generally lag construction and sales. Thus if they have rolled over, employment will likely follow - and indeed in last two months, such employment has been below September’s peak.

Typically the ISM manufacturing survey is reported on the same day as construction spending. This month that is not true, as the ISM index will be reported tomorrow. If it continues to show contraction, that is trouble.

The final jobless claims report of 2024 is good weekly, but the trend indicates substantial weakening


 - by New Deal democrat


Welcome to 2025! The data this year starts out with jobless claims for the last week of 2024, which of course is heavily influenced by seasonality.


The news was mainly good this week, with claims declining -9,000 to 211,000, the lowest number in over half a year. The four week moving average, which is particularly important in the midst of Holiday seasonality, declined -3,500 to 223,250, about average for the past six weeks. With the typical one week delay, continuing claims declined -52,000 to 1.844 million:


As usual, the YoY% comparisons are more important for forecasting purposes, and here the news is not so good. Initial claims were higher by 6.6%, and the four week moving average by 8.5%. Continuing claims were also higher by 1.6%:


The poor comparison of the four week moving average is particularly noteworthy, because, excluding the hurricane affected weeks of early October, it is the worst YoY read since September 2023. It is *not* recessionary, since it has not even crossed the 10% threshold, and I would need to see it remain above that threshold for a sustained period of time. But it does indicate a significant weakening of the employment situation.

The jobs report for December won’t be released for another week, but we now have almost all the information we will have to compare with the unemployment rate, which typically follows jobless claims. The below graph presents the YoY% of the data, which in the case of the unemployment rate, becomes a percent change of a percent:


The immigration situation makes this particularly hard to read. The best I can say is that, absent effects from the surge in immigration in the past several years, the unemployment rate probably would not have increased over 4.0% this summer, and even the present initial claims monthly averages forecast an unemployment rate in the range of 3.9%-4.1%. Anything above that is likely due to the continued effects of the immigration situation.

Tuesday, December 31, 2024

Repeast sales ouse prices show signs of re-acceleration in the last data of 2024


 - by New Deal democrat


I was on vacation through the weekend, and since there has been no significant economic data in the post-Christmas lull, I decided to continue to play hooky. After tomorrow, on Thursday the 2025 data will start in earnest, so expect a return to form later this week.

In the meantime, this morning’s repeat house price indexes from the FHFA and Case Shiller show a somewhat worrying re-acceleration in house price appreciation. Specifically, on a seasonally adjusted basis, in the three month average through October, U.S. house prices according to the Case-Shiller national index (light blue in the graphs below) rose 0.3%, and the somewhat more leading FHFA purchase only index (dark blue) rose 0.4% [Note: FRED hasn’t updated the FHFA data yet]:


On a YoY basis, the Case Shiller index decelerated to a 3.6% gain, while the FHFA index accelerated slightly to a 4.5% YoY increase:


Finally, because house prices lead the measure of shelter inflation in the CPI, specifically Owners Equivalent Rent by 12-18 months, we can use this morning’s data to calculate its trend which is 25% of the entire CPI. Despite the increase in the YoY reading in the FHFA in the past several months, this indicates that OER should continue to trend towards 3-3.5% YoY increases in the months ahead:


The deceleration in OER has been very slow, but has finally fallen below 5.0% YoY. The most leading rental indexes, including the Fed’s experimental all new rental index, indicate that YoY rent increases should decline further, which adds to the evidence for continued deceleration in that huge component of consumer price inflation.

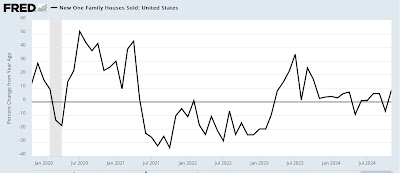
Additionally, because prices generally follow sales, and existing home sales have been stagnant for almost 2 years, while new home sales have only increased slightly:


this also suggests that there is very little in the way of increased price pressure in the housing market going forward into 2025. Indeed, although I won’t bother with the graph, the median sales price for new houses has continued to *decrease* in the past year.