Saturday, April 6, 2019
Weekly Indicators for April 1 - 5 at Seeking Alpha
- by New Deal democrat
My Weekly Indicators post is up at Seeking Alpha. Interest rates ticked up this week, which brought the readings on some interest rate indicators back down.
As usual, clicking over and reading helps reward me with a little $$$ for my efforts.
Friday, April 5, 2019
March jobs report: good nowcast, concerning forecast
- by New Deal democrat
HEADLINES:
- +196,000 jobs added
- U3 unemployment rate unchanged at 3.8%
- U6 underemployment rate unchanged at 7.3%
Leading employment indicators of a slowdown or recession
I am highlighting these because many leading indicators overall strongly suggest that an employment slowdown is coming. The following more leading numbers in the report tell us about where the economy is likely to be a few months from now. With one exception, these either decelerated or outright declined.
- the average manufacturing workweek was unchanged 40.7 hours. This is one of the 10 components of the LEI. It is down -0.6 hours from its peak during this expansion.
- Manufacturing jobs declined by -.6,000. YoY manufacturing is up 209,000, a big deceleration from last summer’s pace.
- construction jobs rose by 16,000. YoY construction jobs are up 246,000, also a big deceleration from last summer.
- temporary jobs declined by -5400. YoY these are up +44,900. These are only up 3700 in the past 5 months, a big slowdown.
- the number of people unemployed for 5 weeks or less fell by -68,000 from 2,194,000 to 2,126,000. The post-recession low was set 10 months ago at 2,034,000.
Wages and participation rates
Here are the headlines on wages and the broader measures of underemployment:
Here are the headlines on wages and the broader measures of underemployment:
- Not in Labor Force, but Want a Job Now: increased by 5,000 from 5.222 million to 5.227 million
- Part time for economic reasons: increased by 189,000 from 4.310 million to 4.499 million
- Employment/population ratio ages 25-54: declined -0.1% from 79.9% to 79.8%
- Average Hourly Earnings for Production and Nonsupervisory Personnel: rose $.06 from $23.18 to $23.24, up +3.4% YoY. (Note: you may be reading different information about wages elsewhere. They are citing average wages for all private workers. I use wages for nonsupervisory personnel, to come closer to the situation for ordinary workers.)
Holding Trump accountable on manufacturing and mining jobs
Trump specifically campaigned on bringing back manufacturing and mining jobs. Is he keeping this promise?
Trump specifically campaigned on bringing back manufacturing and mining jobs. Is he keeping this promise?
- Manufacturing jobs rose an average of +22,000/month in the past year vs. the last seven years of Obama's presidency in which an average of +10,300 manufacturing jobs were added each month.
- Coal mining jobs rose by 100 for an average of 150/month vs. the last seven years of Obama's presidency in which an average of -300 jobs were lost each month
Other important coincident indicators help us paint a more complete picture of the present:
- Overtime declined -0.1 hour to 3.4 hours.
- Professional and business employment (generally higher-paying jobs) increased by 34,000 and is up +534,000 YoY. This has also decelerated from last year’s pace.
- the index of aggregate hours worked for non-managerial workers rose by 0.5%
- the index of aggregate payrolls for non-managerial workers rose by 0.7%
Other news included:
- the alternate jobs number contained in the more volatile household survey declined by -201,000 jobs. This represents an increase of 1,158,000 jobs YoY vs. 2,537,000 in the establishment survey. This is a big difference and, because the household survey has a tendency to turn first, is a definite concern.
- Government jobs rose by 14,000.
- the overall employment to population ratio for all ages 16 and up declined -0.1% from 60.7% to 60.6% m/m and is up 0.2% YoY.
- The labor force participation rate declined -0.2% from 63.2% to 63.0% and is up +0.1% YoY.
SUMMARY
The headline jobs number was very good, although a little below the pace of last year. But the internals were generally neutral to negative.
To begin with, all three of the jobs sectors I am watching closely - construction, manufacturing, and temporary jobs - showed a marked slowdown in growth. All three have declined over the last two months, and temporary jobs are at a virtual standstill over the last five months. Another source of concern is that the household survey’s number showed an outright loss of jobs for the month, for the second time in four months. This measure has grown by only an average of 130,000 per month for the last year. All of this heightens concern that a big slowdown in jobs growth has probably already begun.
Unemployment, underemployment, labor force participation, and the prime age employment/population ratio all either stalled or, in the last case, declined slightly.
On the bright side, wages for ordinary workers grew at 3.4% YoY, a slight slowdown from their recent best pace. Perhaps the best news was the continued strong pace of growth in aggregate hours and payrolls.
To sum up, the jobs nowcast is very good. The jobs forecast is for a significant slowdown, the scope of which is not clear yet.
Thursday, April 4, 2019
March news good so far; the Fed has plenty of scope to cut rates
- by New Deal democrat
While we are waiting for tomorrow’s jobs report, let’s step back for a moment and look at where we are in the big picture of the economic cycle.
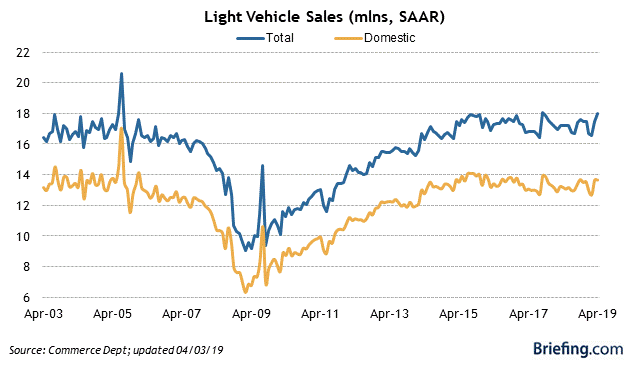
So far, March data is running pretty positive. In addition to the decent ISM manufacturing report I discussed the other day, motor vehicle sales turned out to be excellent, topping 18 million annualized:
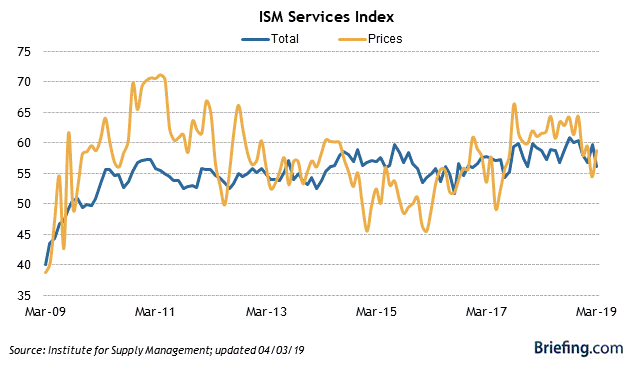
The ISM services index, like the manufacturing index, also downshifted, but continued positive:
And this morning, new jobless claims for the prior week made a new expansion low:
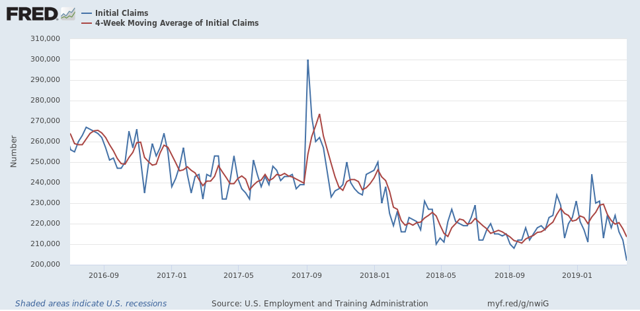
The last time jobless claims were this low was almost exactly 50 years ago, in December 1969. At 213,500, the 4 week average wasn’t quite as low as September’s 206,000, but aside from that, also last saw this number in December 1969.
So the short leading and the coincident data so far for March indicate an expansion that is doing nicely, if not at the pace of last summer.
That does not mean “ALL CLEAR,” however. The long leading indicators generally deteriorated all through 2018, and those forces can be expected to press down on the economy for the rest of this year.
The reason for the most optimism about the economy going forward, aside from the recent decline in long term interest rates like mortgages, is that the Fed’s rate hikes occurred at such a leisurely pace, totaling 0.75% in 2017 and 1.0% in 2018, unlike most prior tightening cycles that increased at levels of 2.0% YoY or more:
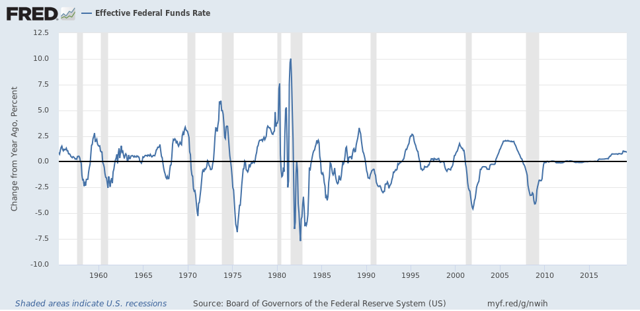
Because the impact of each 0.25% rate hike is less than 0.5% rate hikes, and because they were so gradual, this means that any overshoot is likely less than usual, and also gives the Fed plenty of time to react to any such overshoot.
Typically the Fed has only begun to curtail its tightening cycle or loosen rates 6-12 months after the maximum YoY real GDP growth (red in the graph below) (from which I’ve subtracted 2.5% to show the relationship better):
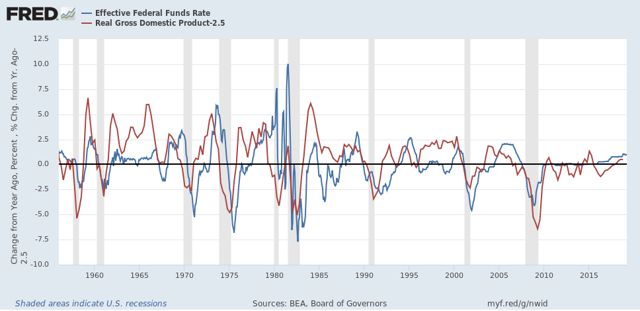
Since the recent YoY peak was Q3 of last year, the Fed is right on time with its pause. If data continues to weaken, so long as inflation - lately up only 1.5% YoY - remains subdued, the Fed need not worry about prices overheating. With gas prices still $0.01 less than they were a year ago, a spike in inflation in the next few months looks very unlikely, which gives the Fed plenty of space to cut, and avoid a recession.
Wednesday, April 3, 2019
Watch for temp jobs weakness in Friday’s employment report
- by New Deal democrat
Yesterday I looked at manufacturing jobs, and goods-producing jobs generally, as two what to look for in Friday’s jobs report.
Today let’s follow up with temporary jobs, an acknowledged leading indicator for jobs as a whole.
As I wrote about a couple of months ago, the American Staffing Association’s Staffing Index does a good job forecasting the trend in temporary jobs in the monthly employment report.
And here, the news is becoming slightly, but more and more, negative. In the four week period through the end of March, the YoY comparison slipped to -1.7%, its worst yet:
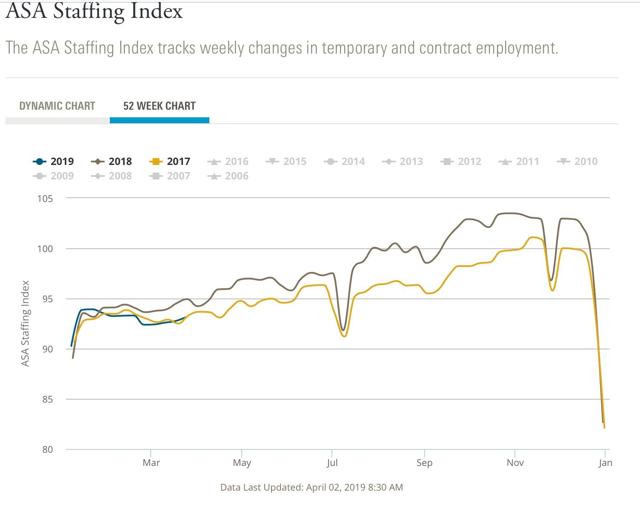
The index went negative YoY at the turn of the year, and has gradually deteriorated since.
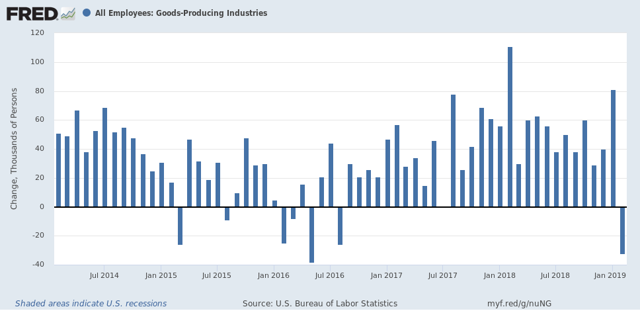
Meanwhile here is the monthly change in temporary jobs from the employment report for the past several years:
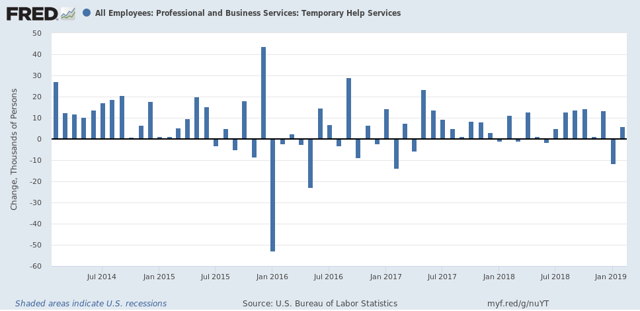
After the 2015-16 shallow industrial recession, the growth in temp jobs picked up decently. But in the last four months, only about 2250 temp jobs per month have been added. I am looking for this decelerating trend to continue, and the decline in the Staffing Index indicates we shouldn’t be surprised if there is an outright loss in temp jobs in the report on Friday.
Tuesday, April 2, 2019
Manufacturing slowdown apparent, but no contraction
- by New Deal democrat
With yesterday’s ISM report for manufacturing in March, let’s take an updated look at this sector, with a particular emphasis on what to look for in this Friday’s jobs report.
The ISM manufacturing index, and its more leading new orders sub-index, both continued positive in March, with the former at 55.3 and the latter at 57.4. Both of these are good, solid, positive numbers. Here’s the updated graph from Briefing.com:
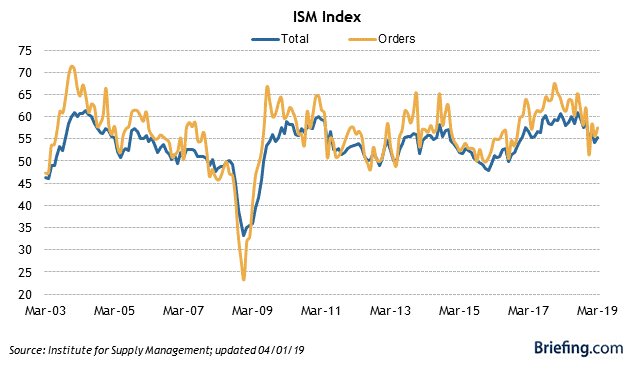
Although as noted above, these are positive numbers (any value above 50 indicates expansion), the last few months have shown a considerable slowdown from the red hot pace of expansion one year ago. This is in line with the five regional Fed reports, which have also slowed to very tepid - but still positive - readings in the last few months.
As I wrote last week, I am expecting a slowdown in employment growth. This is particularly true as to manufacturing and other goods-producing jobs. Here’s two graphs going back nearly 60 years of the spread between 10 year and 3 month treasuries (blue) and the YoY% change in goods producing jobs (red):
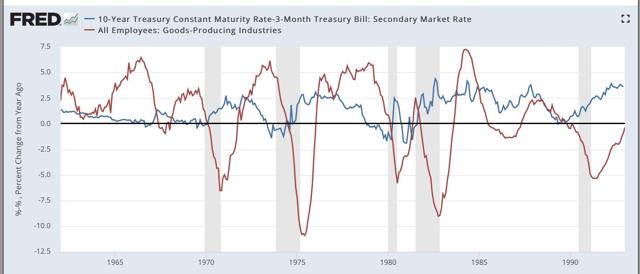
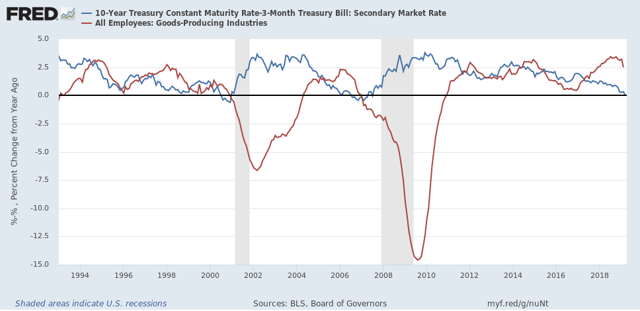
Note that in *every* case that the interest rate spread has inverted, or just decreased to nearly zero, within about 18 months YoY growth in goods-producing jobs has declined to less than 0.5%, and usually outright declined. That translates to an annual pace of not more than 7000 goods producing jobs a month. By contrast, in the past several years at least 20,000 goods productions jobs have been added virtually every month:
So if history is a guide, a sharp slowdown in goods producing jobs growth should begin very soon, if not having already begun in February.
In addition to watching for poor manufacturing and other goods producing jobs growth in Friday’s employment report, an even more forward looking indicator is the average manufacturing work week, which tends to decline even before jobs do. Here’s the history of that number over the past 35 years:
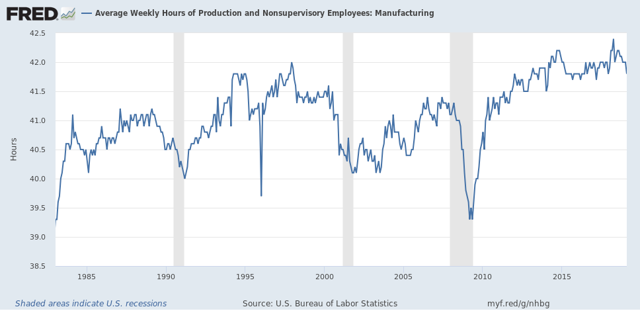
Although it wasn’t the case in 2007, usually the average manufacturing work week declines by nearly an hour if not more before a recession begins.
In the past 10 months, this has declined by -0.6 hours. Any further decline this Friday would be cause for significant concern.
Monday, April 1, 2019
Retail sales flash yellow
- by New Deal democrat
This morning’s retail sales report for February was disappointing on a monthly basis, but also signals caution for the economy as a whole.
On a nominal basis, retail sales declined -0.2% for the month, although January was revised higher, to +0.7%.
On an inflation adjusted basis, the news was worse, as the monthly decline was -0.4%.
Below are real retails sales for the last few years, and because it is a long leading indicator, real retail sales per capita (in red):
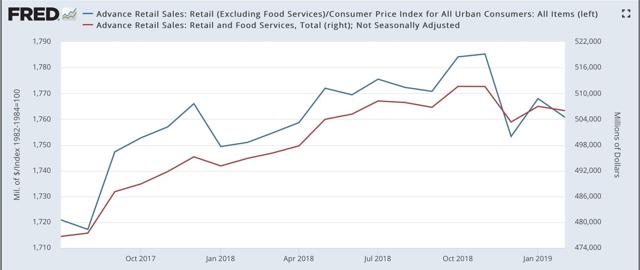
Both of these last made new highs in November. Because there is a lot of noise in the data, it is almost impossible to know whether or not this is true signal.
Although the relationship is noisy, because real retail sales measured YoY tend to lead employment (red in the graph below) by a number of months, here is that relationship for the past 25 years:
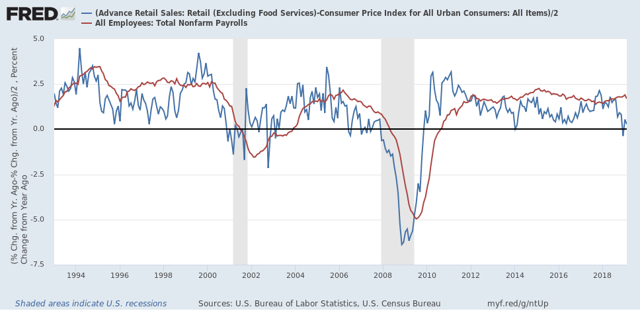
This is yet another sign that employment gains are likely to downshift significantly over the next several months.
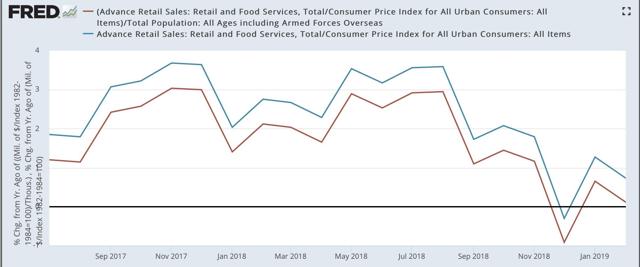
Next, here are both forms of real retail sales YoY recently:
And here are real retail sales per capita YoY, going all the way back to 1948:
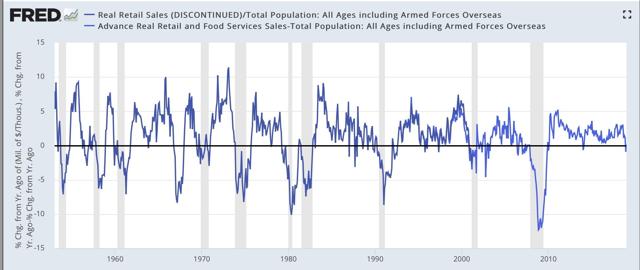
In the last 70 years, this measure has always turned negative at least shortly before a recession has begun. There are no false negatives. While there are about a dozen false positives for a single negative month, there are only four false positives for consecutive negative readings — 1966, 1995, 2002, and early 2006.
Real retail sales per capita YoY just escaped making its second negative reading in three months. So while sales are definitely sounding a note of caution - call it a yellow flag - they aren’t flashing red at this point.
Sunday, March 31, 2019
No, the Meuller report ***DID NOT*** “find no collusion!”
- by New Deal democrat
This past week I nearly became apoplectic about he malfeasance of much of the press and the punditry reporting of Barr’s 6 paragraph substantive “summary” (3 paragraphs each as to “collusion” and “obstruction of justice”) of Mueller’s roughly 300 page report.
As an initial matter, because Mueller’s grand jury is continuing to meet, and there are still subpoenas and witnesses outstanding, it is incorrect to say that “the investigation” has concluded. clearly “the investigation” is ongoing. What *has* concluded is Mueller’s involvement as special counsel, now that an Attorney General has taken over who did not have to recuse himself. Keep that basic point in mind.
But that’s not what got me livid. Much has already been covered by others. But it is one important, even fundamental, aspect of Barr’s executive summary on which I wanted to focus.
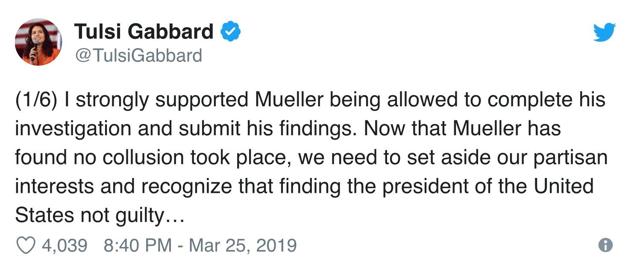
Start with the fact that Barr is a very good attorney. He is going to choose his words, and what he cites and what he omits with great care. Now, this is the *totality* of the language from the actual Mueller report that Barr quotes as to collusion:
“[T]he investigation did not establish that members of the Trump Campaign conspired or coordinated with the Russian government in its election interference activities.”
Barr repeats this formulation virtually verbatim twice more in his letter. Here’s the second time:
Stop right there. Let me just slightly reword Barr’s money quote:
“[T]he investigation established that members of the Trump Campaign did not conspire or coordinate with the Russian government in its election interference activities.”
All I did was change the phraseology (in italics) slightly. But the meaning is much more definite and sharper. In my formulation above:
1. There was a finding.
2. The finding was no collusion.
But in the quote which Barr cites, and refers to twice more, it states:
1. There was no finding.
2. The “no finding” was that there was collusion.
Notice that the first formulation above is much stronger than the second. And yet, three times in his executive summary, Barr chooses the second - in circumstances where, if the first were true, he certainly would have used that instead.
While the “no finding” formulation is consistent with a “finding of no collusion,” it is also consistent with other readings:
1. The investigation isn’t complete yet (which is almost certainly a correct statement).
2. The evidence is inconsistent, weak, or contradictory.
3. There are too many unknowns to come to a conclusion.
4. While the evidence of collusion is strong, it is not strong enough to support a jury verdict beyond reasonable doubt.
To reiterate, Barr is a seasoned attorney. He chose the weaker rather than the stronger formulation for a reason. Again, if the stronger statement were the true one, don’t you think he would have used the stronger statement? That he chose the weaker statement is telling. The reason, almost certainly, is that the stronger formulation is not correct, and that some version of the 4 weaker possibilities I’ve listed above is the correct factual statement.
Further, as it was elsewhere pointed out a few days ago (sorry, lost the link), the bracketed [T] in Barr’s quote of Mueller is doing a lot of work. Because it means that there was a first part of the sentence that was omitted. Put that together with the fact the Mueller’s quote then specifically references that “the investigation did not establish ...” and there is compelling evidence that the first part of the actual sentence was a qualifier.
In the first place, had the first part of the sentence been a positive statement, Mueller would not have repeated the phrase “the investigation” in the second part. It would have been something like “The investigation demonstrated that at all time Donald Trump and his Campaign acted lawfully, and thus it did not establish ...”
Almost certainly the first part of the sentence is something like “Although...’” “Since ...’” or “Despite ...” followed by “the investigation...”, or a formulation like “The grand jury’s work is incomplete, and so the investigation ...”
Yet the press and most commentary wrote as if Barr had chosen the stronger formulation I discussed above. Here are some examples:
Yet the press and most commentary wrote as if Barr had chosen the stronger formulation I discussed above. Here are some examples:
CNN:
Reuters:
Presidential candidate Tulsi Gabbard:
Even, surprisingly, Josh Marshall:
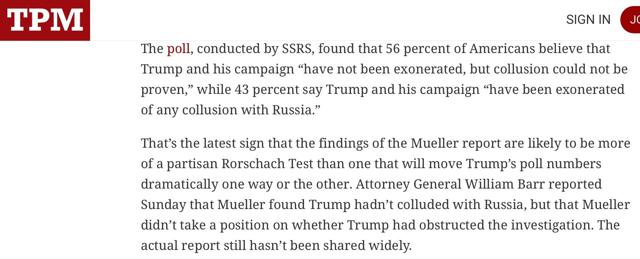
Aside from the fact that none of these people has read the actual Mueller report, the simple fact is they are all incorrect as to what Barr stated as well.
And that probably tells you why Barr, who putting it most charitably, as Trump’s attorney general was going to “tell the truth with the best foot forward,” pounded this quote 3 times in his three paragraph discussion of the collusion issue: because he wanted people who aren’t versed in parsing attorney language to jump to the exact conclusion they reached: the “no finding” of collusion became a “finding of no collusion.”
There is no such “finding of no collusion” in evidence. This is spin, plain and simple. It needs to be corrected.
Subscribe to:
Posts (Atom)