Saturday, October 23, 2021

Weekly Indicators for October 18 - 22 at Seeking Alpha


 - by New Deal democrat

My Weekly Indicators post is up at Seeking Alpha.

Yesterday I wrote about how house prices appear to be at their peak for this cycle. And in the weekly high frequency data, there is more evidence that a number of other commodity and transportation measures - but not oil! - are also either at or already on their way down from their respective peaks.

This can be treated as good news - hooray, the supply chain bottlenecks are beginning to ease! - or bad news - OMG, users and buyers are refusing to pay these prices, a recession is coming! The rest of the indicators so far decisiveless bet to one side of that bet.

As usual, clicking over and reading should be educational for you, and slightly remunerative for me.

Friday, October 22, 2021

Median prices for existing homes is probably at peak; expect inventory to continue to increase


 - by New Deal democrat

Existing home sales were reported yesterday for September, up 7% month over month on a seasonally adjusted basis. While they are about 90% of the market, they are much less important for the economic cycle than are new home sales, which will be reported next week.


I suspect new home sales will increase, since interest rates stabilized at very low rates earlier this year, and the increase in existing home sales is some confirmatory evidence. Realtor.com doesn’t all FRED to produce data more than 12 months old, so here is the last 12 months for both new and existing home sales, normed to 100 as of September 2020:


Both declined, but new home sales much more deeply.

Realtor.com does provide FRED with both new and total (“active”) listing counts for the past 5+ years. Here’s what that looks like (note, new listings are on right scale):


Note that new listings declined precipitously in late 2019 even before the pandemic - and the pandemic certainly hasn’t helped.

Since neither series is seasonally adjusted, comparing them YoY is more useful:


While new listings rebounded this year, they were slightly lower YoY in September. More importantly, they are down almost 10% since September 2019, which was just before the big decline started, while total listings are down over 20% since then.

In the “the cure for high prices is, high prices” department, YoY median price gains have continued their deceleration. Here’s what the last 4 months have been:
Jun +23%
Jul +20%
Aug +15%
Sep +13%

At this rate, prices will roll over YoY sometime this winter. While these are not seasonally adjusted either, my rule of thumb is that a deceleration of 50% typically marks the top for any such statistic. We are virtually there already as of September, causing me to believe that we are at the peak. This follows my rubric that sales peak first, followed by prices. We can expect inventories - the YoY% decline in which has already decelerated by over 50% - to continue to increase.

Thursday, October 21, 2021

Jobless claims show renewed downward trend; still some slack in continued claims


 - by New Deal democrat

Jobless claims declined 6,000 this week to 290,000, yet another pandemic low. The 4 week average also declined 15,250 to 319,750, also another pandemic low:


With the exception of the last few years of the last expansion, this level of weekly initial claims would be very low for any point in the last 50 years, and the 4 week average would be average for late in an expansion:


Continuing claims declined 124,000 to 2,481,000, also a new pandemic low:


This level would also be normal for the middle of the last few expansions:


Except for the last 2.5 years of the last expansion, continuing claims never dropped meaningfully below 2,000,000 at any point since the 1974 oil embargo.

Finally, here is the YoY% change of continuing claims:


Based on the YoY change, it appears that the complete nationwide phase-out of all emergency pandemic benefits last month may be a cause for the decline in continued claims since then. 

With this week’s confirming data, it appears that we have begun a renewed downward trend. Layoffs are at levels typically seen after very sustained expansions. But there is still some slack in workers who have not yet found new jobs, as evidenced in continuing claims. I suspect we will continue to see that number decrease.

The one big surprise is that all of this is happening while we still have about 80,000 new cases, and over 1600 deaths, of COVID daily.

Wednesday, October 20, 2021

Coronavirus dashboard for October 20: as the Delta downtrend slows, is any State closing in on “herd immunity”?


 - by New Deal democrat

It’s been a moment since my last dashboard. That’s primarily because the Columbus Day weekend resulted in anomalies for the past 9 days, that have finally mainly but not  completely resolved.


Here’s a look at the past 6 months for both cases and deaths per 100,000:


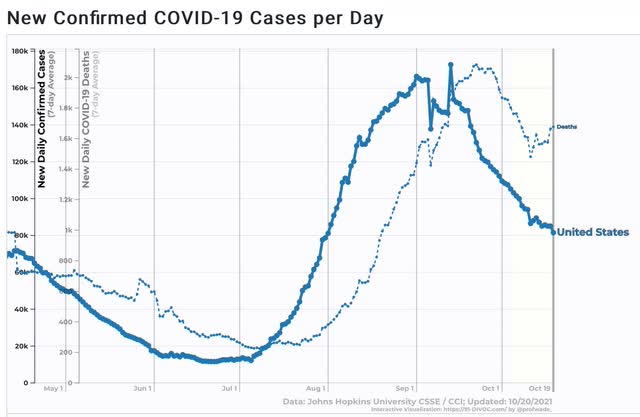
As of today, cases are finally down more than 50% from the Delta peak, at just over 80,000. But as you can see, they are still well above their 11,300 minimum in late June. Deaths are still just under 1700, an elevated number that is the highest since early March.

Here’s a close-up of the past 8 weeks:


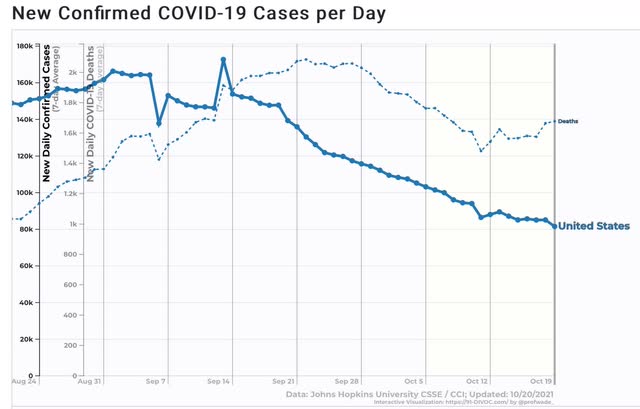
I am showing you so you can see that the lack of reporting on Columbus Day, to also in some States the day after as well, caused an anomalous decline those two days, followed by a spike, and then an anomalous bigger decline today as last Tuesday’s spike left the average. You can also see that many States don’t bother to report on the weekends anymore causes a flattening of those two days’ readings compared with trend. The next few days will reveal if there remains a true downward trend or not.

Here is what the four Census regions of the country look like over the past 12 months:


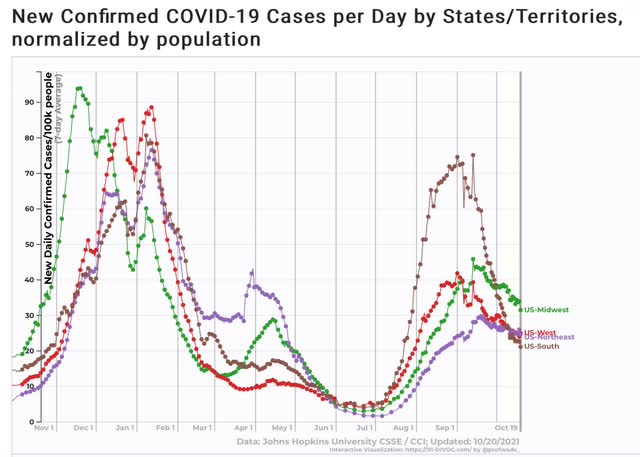
Note that the winter wave began at the beginning of October last year. There has been no such increase so far this month. If cases either trend downward or even sideways for another couple of weeks, we will be lower this year than last year heading into winter. Whether vaccinations + the Delta wave mute any winter wave (when people head indoors for social gatherings) this year is the big question over the next few months.

I have also been curious as to which States have been the closest to or furthest away from either “herd immunity” or “endemic Covid.” While I haven’t looked at all of them, I have compared the most extreme cases. 

Those States with the most vaccinations tend to have had a low to moderate number of total infections (yes, that included NY and NJ). The two jurisdictions (omitting PR and various island territories) with the most vaccinations are DC and VT:


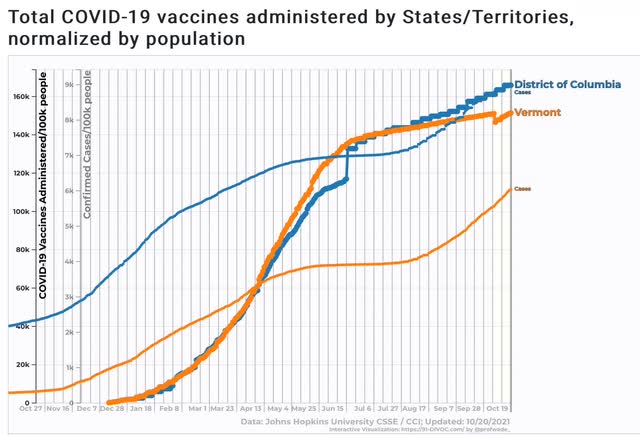
DC has 62% fully vaccinated, plus 10% partially so. VT has 71% fully plus 8% partially vaccinated. Only 9% of the population of DC has had a confirmed infection, and 6% of Vermont (both excellent number for the US). 

If we figure that the total number of actual cases is 2.2x the confirmed count, that gives us a 20% infection rate for DC, and a 13% infection rate for VT. If we randomly assign those among fully, partially, and un-vaccinated people, that gives us the following:

DC: 64% immune,* plus 14% with some resistance, for a total of 78%, with 22% sitting ducks.
VT: 73% immune,* plus 10% with some resistance, for a total of 83%, with 17% sitting ducks.
*=obviously not totally so

At the other extreme, the two States with the highest number of confirmed cases are TN and ND, both with 18.5% confirmed infection rates (suggesting that 41% of their populations have actually been infected. TN has 47% fully, plus 7% partially vaccinated.  ND has 45% fully, plus another 7% partially vaccinated:
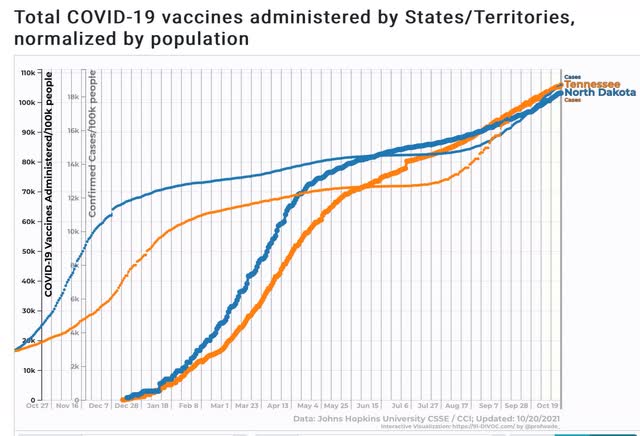
 

That gives us:

TN: 50% immune, plus 24% with some resistance, for a total of 74%, with 26% sitting ducks.
ND: 48% immune, plus 25% with some resistance, for a total of 73%, with 27% sitting ducks.

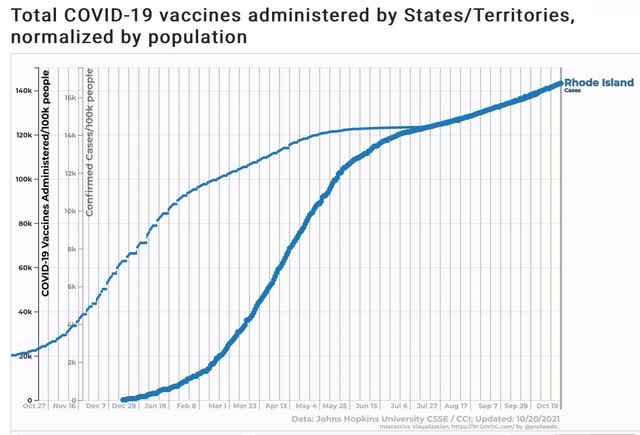
While there aren’t any States that have managed both low vaccination and low infection rates, there is one (small!) State which has both a very high vaccination rate and a very high previous infection rate: Rhode Island.

RI has 70% fully, and another 7% partially vaccinated. It also has a 16.5% confirmed infection rate, the 8th highest rate in the entire country, for a “real” number of 36%:


That gives us 73% immune, plus 12% with some resistance, for a total of 85%, with only 15% still sitting ducks (2% better than VT, 7% better than DC, and over 10% better than either TN or ND.

Once 5-11 year olds are able to be vaccinated, that (hopefully) should add about another 8% to the totals of fully vaccinated. That would put both RI and VT over 90% either immune or with some resistance. That’s a point by which we should expect to see what an endemic COVID, if not “herd immunity” looks like.

Tuesday, October 19, 2021

New housing construction for September shows a big decline on the surface, but underneath shows stabilization


 - by New Deal democrat

This morning’s report on September housing permits and starts looks very negative on the surface, but on closer examination shows continuing stabilization in new home construction, following the general stabilization of mortgage rates this year.


Housing starts (violet in the graphs below) decreased -1.6% m/m, and total permits (blue) decreased a whopping 7.7%(!), but only after a downwardly revised 5.6% increase in August. The less volatile single family permits (red) decreased -0.9%. As a result, the overall trend for all three metrics for the past several months is a slight decrease:


For the past several months I have noted that the YoY comparisons were going to become much more challenging, given the boom in construction late last year. Indeed this has been the case, with total permits unchanged, single family permits down -7.1%, but housing starts *up* 7.4%:


The YoY increase in starts is noteworthy because it highlights an unusual event which has taken place over the past year; namely, a record number of permits were issued for houses that were not promptly started. 

Take another look at the first graph above, and note the sharp divergence between the violet line (starts) and the other two last winter. Single family permits increased 30% in the 2nd half of last year, and total permits over 20%, but actual starts only increased a little over 10%. The below graph shows the % by which permits have exceeded starts, averaged by quarter. Before this quarter, the *least* % by which permits exceed starts in the previous year was 6.8%, so I have subtracted that to norm it at zero. Simply put, the below graph indicates that this yearlong divergenace between early 2020 and early 2021 was the biggest of the past decade:


This year single family permits have declined almost -18% and total permits over -15%, but the three month average of starts has declined only -2.1% from 1599/month to 1566/month.

In other words, the actual on-the-ground economic activity in housing construction hasn’t declined much at all, most likely because housing materials at reasonable prices constrained the actual building of houses authorized by permits. This suggests much less of a real economic downdraft than would otherwise be the case.

And the evidence from mortgage rates is that housing should be (and is) stabilizing. Here is the raw mortgage interest rate number (gold), left scale vs. the absolute number of single family permits (right scale):


In the past 5 months rates have stabilized between the 2.75%-3.05%, and housing can be expected to resume a moderate increasing trend in response. This is also shown when we compare the YoY% changes in mortgage rates (inverted) and single family housing permits over the past 10+ years:


Mortgage rates have only increased 0.24% YoY, so for all intents and purposes have been flat YoY for the past 3 months. In sum, this continues to suggest that the economy, which tends to follow housing with a 1 year+ lag, after a period of cooling early next year, will also stabilize later on.

Monday, October 18, 2021

September industrial production turns down, but no major cause for concern


 - by New Deal democrat

Industrial production is the King of Coincident Indicators. This morning’s report for September was negative, and August was revised downward, taking total production back below pre-pandemic levels.


Total production decreased -1.3% in September, and the manufacturing component decreased -0.8%. The August reading for each was revised downward by -0.3%.  Nothing particularly special about that; in fact the manufacturing component was a little weak compared with most recent months. Additionally, the July numbers were revised slightly (not significantly) higher and lower for each, respectively. As a result, manufacturing is now only 0.4% above February 2020, and total production is down -1.3% compared with just before the pandemic:


Needless to say, this is very much at odds with the continuing very positive ISM manufacturing index readings which we have gotten every month this year. The Fed regional manufacturing indexes as well as the Chicago PMI also remain positive, so I am not terribly concerned about one poor month (which needless to say may also be revised!).
 
This morning’s report is probably going to prompt some scary downward revisions to forecasts of Q3 GDP, which will be released one week from Thursday. But when we look at quarter-over-quarter numbers, industrial production is still up 1.1% from Q2 of this year. In the below graph, I’ve subtracted that number so that it norms to zero, to compare that increase with the past 30+ years:


As you can see, while it isn’t the strongest reading, it is higher than most quarters during the 3 expansions since 1989, and is nowhere near recessionary. So, while we’re almost certainly going to see a sharp *deceleration* from the blockbuster last several quarters in q/q GDP next week, in absolute terms I do not see any particular cause for concern.