Saturday, October 19, 2019
Weekly Indicators for October 14 - 18 at Seeking Alpha
- by New Deal democrat
My Weekly Indicators post is up at Seeking Alpha. Although the economy, especially in the producer sector, is quite weak right now, the indicators in all time frames are, in the aggregate, positive.
As usual, clicking over and reading should bring you right up to the moment on the data, and rewards me a little bit for my efforts.
Friday, October 18, 2019
An important update on the yield curve
- by New Deal democrat
For the last 10 months, readers of the financial press have been bombarded with stories about the inverted yield curve, where (some) longer term interest rates are lower than shorter term interest rates. I track them too! But they are by no means my only forecasting tool.
In any event, in the past several months and weeks, the yield curve has resumed a much more normal configuration. So does that mean we are in the clear?
It depends which measure you are paying most attention to. Which has always been an important caveat, because the inversion of the yield curve has, with the exception of about one week several months ago, always been partial - i.e., at least one “infallible” indicator must have been wrong.
My “just the facts, ma’am” look at what the un-inversion of the yield curve has meant over the past 50 years was posted at Seeking Alpha.
As usual, clicking over and reading rewards me just a little bit for my efforts.
Thursday, October 17, 2019
Positive housing, initial claims, and Philly Fed outweigh negative industrial production
- by New Deal democrat
So, after a nearly empty week until now, there were four economic reports this morning. Three of them were good.
First, although overall housing starts and permits declined, single family permits, the most forward looking and least volatile of the metrics, were only 3000 off a new expansion high (red in the graph below, vs. multi-family permits):
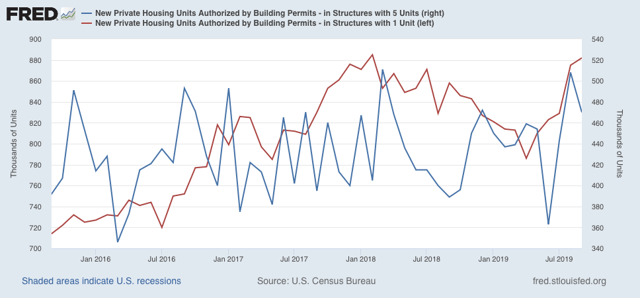
Housing’s rebound is the biggest single argument against a recession later next year.
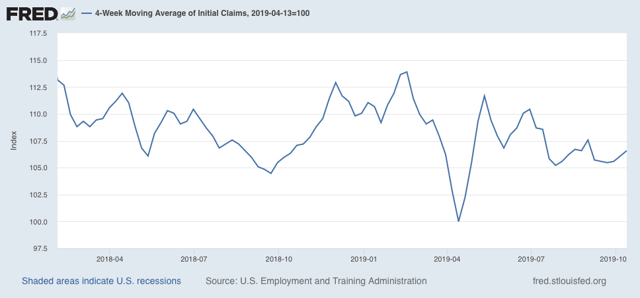
Second, initial jobless claims continued at only 6.6% off their lowest level of the expansion:
The one significant fly in the ointment is that the 4 week average of continuing claims, which is less volatile if less leading, was unchanged YoY:
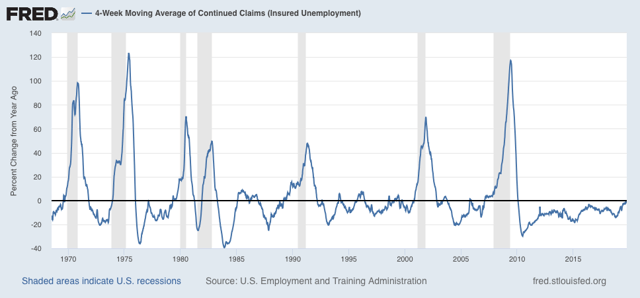
This has happened 15 times in the past 50+ years. Seven times it was a prelude to a recession; eight times it was a false positive, but signaled a slowdown.
Third, the Philadelphia region’s production continued to expand, and the new orders index actually improved further to +26.2. That’s *really* good, with the caveat that this series has been very volatile in the past.
Finally, industrial production declined, but the special factor here was the GM strike:
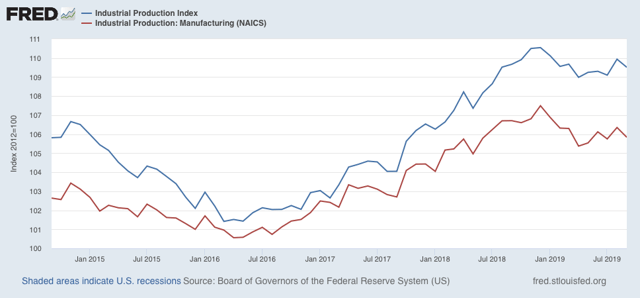
Still, both measures (overall and manufacturing) are significantly below their December peaks - but above their lows from earlier this year.
It is safe to say that in 2019 the US has been having another shallow industrial recession, but the consumer continues to power through.
Wednesday, October 16, 2019
Real retail sales decline slightly in September, but the consumer is still alright
- by New Deal democrat
Retail sales are one of my favorite indicators, because in real terms they can tell us so much about the present, near term forecast, and longer term forecast for the economy.
This morning retail sales for September were reported down -0.3%, while August, which was initially reported at +0.4%, was revised upward by another +0.2%, so the net decline was -0.1%. Since consumer inflation increased by only +0.1% over that two month period, real retail sales have risen +0.2% in the past two months. As a result, YoY real retail sales, which had been faltering earlier this year, are still up +2.3%.
Here is what the absolute trend looks like. Notice that this month’s decline barely registers and is well within the range of noise:
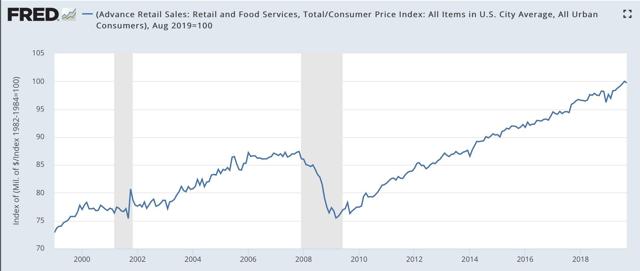
Others may use other deflators. I use overall CPI because:
1. I’ve been doing it this way for over 10 years.
2. This is the deflator used by FRED.
3. It has a 70+ year history.
4. Over that 70+ year history, it has an excellent record as a short leading indicator for employment and recessions. That’s the kind of track record I like.
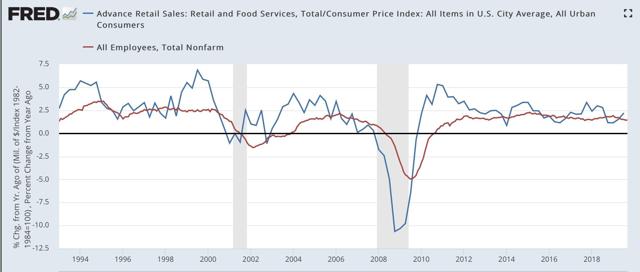
In terms of the short term forecast, although the relationship is noisy, real retail sales measured YoY tend to lead employment (red in the graphs below) by about 4 to 8 months. Here is that relationship, measured quarterly to cut down on noise, over the past 25 years:
Now here is the monthly close-up of the last five years. You can see that it is much noisier, but helps us pick out the turning points:
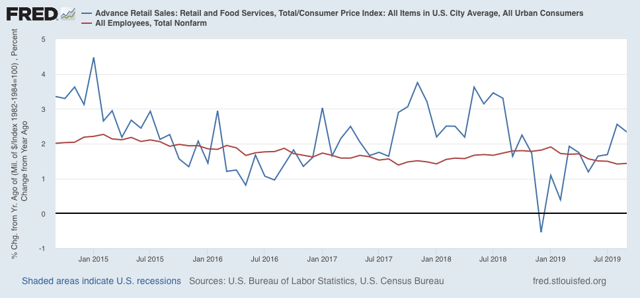
The recent peak in YoY employment gains followed the recent peak in real retail sales by roughly 6 months, and the downturn in real retail sales at the end of last year has already shown up in weakness in the employment numbers this year. Similarly I expect the improvement in retail sales to show up in an improvement in the employment numbers by about next spring.
Finally, real retail sales per capita is a long leading indicator. In particular it has turned down a full year before either of the past two recessions: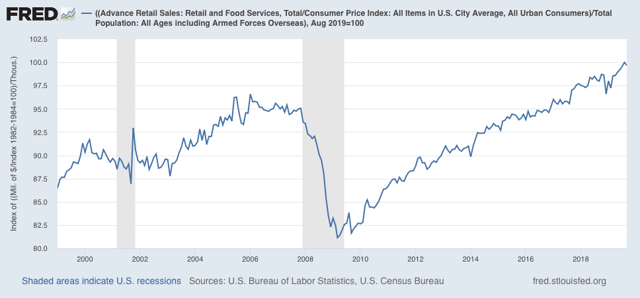
In the last 70 years, this measure has always turned negative YoY at least shortly before a recession has begun. That time lag increased to a full year as the US economy has become less centered on manufacturing. Although there have been some false positives, there are no false negatives. In other words, this is a very reliable positive indicator.
In the last 70 years, this measure has always turned negative YoY at least shortly before a recession has begun. That time lag increased to a full year as the US economy has become less centered on manufacturing. Although there have been some false positives, there are no false negatives. In other words, this is a very reliable positive indicator.
In short, it will take several more months of negative numbers for me to become concerned. As I wrote yesterday, the US consumer is still alright.
Tuesday, October 15, 2019
The consumer is still alright
- by New Deal democrat
Way back in 2007, I wrote an article at Daily Kos entitled “Are hard times near? The great decline in interest rates is ending,” in which I highlighted the importance of debt refinancing at lower interest rates as an important way that the working and middle classes had dealt with stagnating wages since 1980. Whenever that spigot was turned off, as well as the ability to cash in appreciating assets, was when a recession happened.
I wrote then that there was still room for one more refinancing. And that proved true, as mortgage rates in particular declined to yet lower new lows in 2012-13. When it comes to mortgage rates, they still have not made new lows in the 6 years since.
Especially since, like 2015-16, manufacturing has rolled over, but low mortgage rates are helping the housing market rebound again, this was a good time to update the framework I first wrote about in 2007, which I’ve come to call the “consumer nowcast.”
So, what does the consumer nowcast tell us about that 70% of the US economy? I updated this system in a post over at Seeking Alpha.
As usual, clicking over and reading helps reward me with a little pocket change for my efforts.
Sunday, October 13, 2019
Weekly Indicators for October 7 - 11 at Seeking Alpha
- by New Deal democrat
My Weekly Indicators post is up at Seeking Alpha.
The stars are aligning for the recovery from the present slowdown in the longer term. But in the meantime, the present and short term data is still soft.
As usual, clicking over and reading helps reward me a little bit for my efforts.
Subscribe to:
Posts (Atom)