Saturday, May 2, 2020
Weekly Indicators for April 27 - May 1 at Seeking Alpha
- by New Deal democrat
My Weekly Indicators post is up at Seeking Alpha.
As with the Great Recession, once the economy has gone over a cliff, the next question is, where is the bottom of the cliff? At least on a weekly basis, the data didn’t get materially worse in a YoY sense this week.
Is that the bottom of the cliff? Or are there further, worse, second order effects to come? We’ll start to get those answers once we can begin to compare May data with April’s.
As usual, clicking over and reading rewards me a little bit for my efforts.
Coronavirus dashboard for May 2: good news, but still primarily due to NY
- by New Deal democrat
Here is the update through yesterday (May 1).
As usual, significant developments are in italics. The trends in new infections, deaths, and in testing have all turned positive - if not positive enough. But the good news remains primarily a NY story.
I have discontinued giving the % increases day/day in infections and deaths. They were included when important to determine if the US was “bending the curve.” The issue now is whether any States (beyond the least populated rural or isolated States) can “crush the curve.”
Number of new and total reported Infections (from Johns Hopkins via arcgis.com and 91-divoc.com):
- Number: 34,129, total 1,104,161 (vs. day/day high of +36,161 on April 24)
There has been a slight decrease in the number of new cases in the US. The US has the worst record in the world, by far, with no sign of any big decrease.
Number of deaths and infections and rate of increase of testing (from COVID Tracking Project)
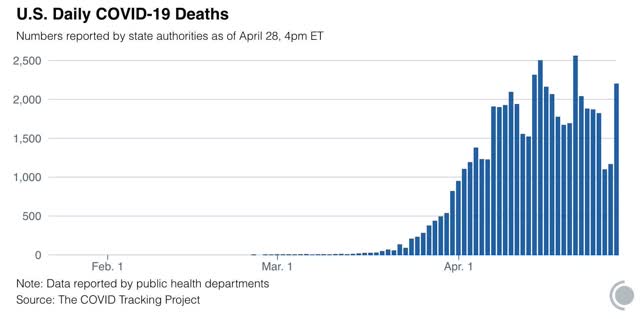
- ***Number of deaths: 1,743, total 59,059 (vs. day/day peak of +2,700 April 29)
- Seven day average of deaths:1,896 (vs. 2,058 peak on April 21)
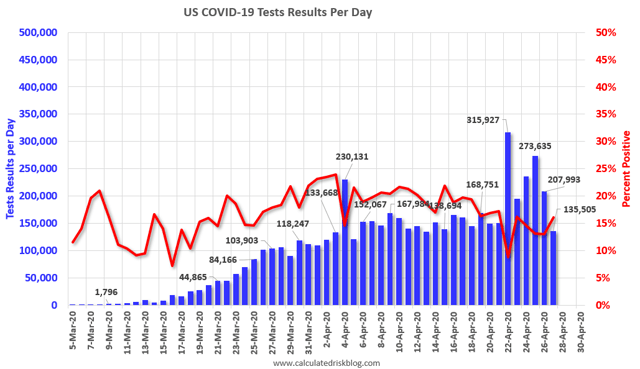
- Number of tests: 305,118 (new daily peak*)
- Ratio of positive tests to total: 9.1:1 (new high)
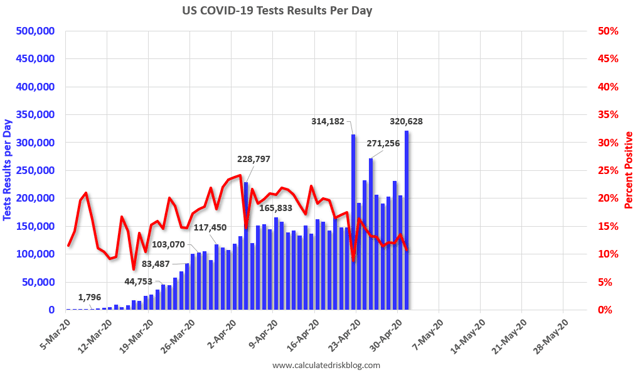
In the past three weeks, as shown in the graph above, the percentage of positive to total tests has declined from about 20% to 11%. If this percentage were to fall to 6%, then based on the history of South Korea, lockdowns can begin to be judiciously lifted and a thoroughgoing regimen of “test, trace, and isolate” can be begun. Four small States are in that range now (but none have the tracing or isolation regimen in place).
*ex.-Calif clearing its backlog
Comparison of deaths, infections, and testing for NY vs. US ex-NY:
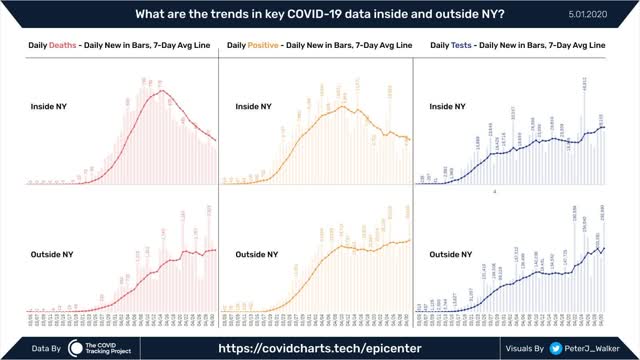
The good news about infections and deaths above is mainly about NY.
Summary for May 2
- The number of daily new infections, adjusted for testing, appears to have peaked two to three weeks ago.
- The number of daily new deaths also appears to have peaked about 10 days ago.
- The trend number of daily tests has improved dramatically in the past 9 days from an average of about 150,000-160,000 to about 230,000. Better still, for the last 4 days, new infections have declined, even with higher testing - a very positive sign.
- My personal suspicion remains that the actual number of total infections in the US is about 5x the official number, or roughly 5.5 million at present.
- Going forward, it will probably be important to separate out those States which are “opening up” without sufficient testing or precautions, which I expect to see a new wave of infections, vs. States which want to drive the number of new infections close enough to zero to follow an intensive “test, trace, and isolate” approach. I further expect that, once new infections begin to go hyperbolic again in those States which have “opened up,” they will go to lockdowns again.
Friday, May 1, 2020
Examining the 53 Petri dishes of democracy: 4 small States can legitimately end lockdowns (with proper protocols in place)
- by New Deal democrat
I’m not the only person to figure out that the US is responding to coronavirus as if it were still governed by the Articles of Confederation, where every State is on its own (and worse, has to guard its emergency medical supplies against heists by Jared Kushner’s opaque federal task-force, in the case of Maryland using armed national guardsmen).
In view of a number of States declaring a day of Jubilee from the virus (which will be unmoved), let’s take a look at how the 53 Petri dishes of democracy are doing.
Unfortunately, the main sources of information don’t have a good way of graphing more than one State at a time, but the Washington Post published this helpful set of thumbnails for all States plus DC, Puerto Rico, and Guam a couple of days ago:
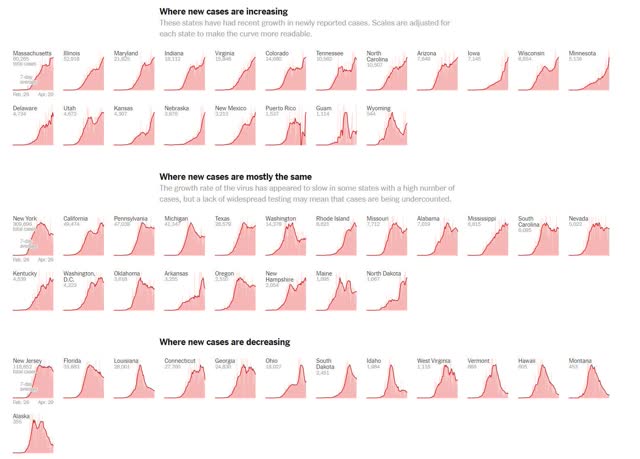
I have one conceptual quibble with the breakout: it focuses too much on the last few days for each State. Most notably, NY and WA, which are in the “mostly the same” group, in fact has seen decreases of more than 1/2 from its peak; contrarily NJ and CT, which have had notable declines in the past few days, have mainly gone sideways since their peak and in the case of NJ is only about 30% below peak, even measuring by just the past three days.
But the graph does show very well that there are 4 small States in the “cases are decreasing” row which, with good testing and tracing protocols, could end lockdowns now. Below I list the 4, together with the latest 7 and 3 day averages, and 1 day number of new infections for each:
Alaska: 2.6, 5, 4
Hawaii: 3, 4, 5
Montana: 1.6, 2, 2
Vermont: 6.7, 5, 4
Hawaii, of course, is a set of islands, and so it is much easier to quarantine from outside infections. The other three are rural States with very low densities.
In addition to NY, WA, LA and ID also have had reductions of more than 50% from peak in new infections. But the raw numbers are still too high for each: ~4000, ~200, ~300, and ~30/day, respectively. Idaho is close, but the other three need to continue to show declines for several more weeks before they might be able to declare victory in “crushing the curve.”
Even so, and even with through testing and tracing protocols, I think each would need to police its borders and insist that all travelers, aside from those delivering commercial cargo, go through a period of quarantine.
Since I expect new infections to start rising again in about a week in places like TX and GA, should any other major State in the same time frame succeed in “crushing the curve,” I believe it will create a San Andreas-sized political earthquake.
Thursday, April 30, 2020
Coronavirus dashboard for April 30: the US has the worst record in the world, by far
- by New Deal democrat
Here is the update through yesterday (April 29):
Number of new and total reported Infections (from Johns Hopkins via arcgis.com and 91-divoc.com):
- Number: South Korea: ZERO (4 detected from incoming flights at airport)
- Number: Taiwan: ZERO
- Number: Vietnam: ZERO
- Number: Germany: 1,627 (up from 988 on April 27; 3 day average of 1,256 down -81.5% from 6,790 peak on April 1-3) (highlighted in graph below)
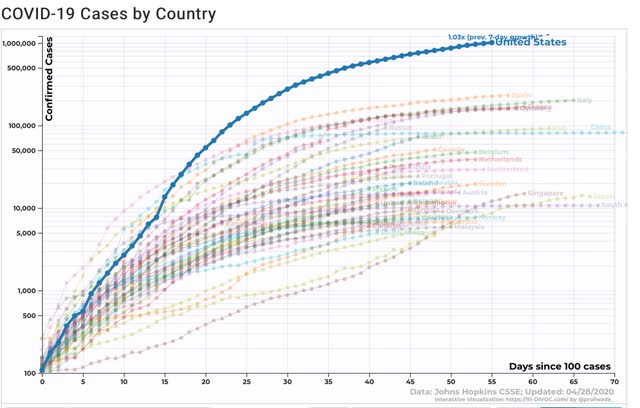
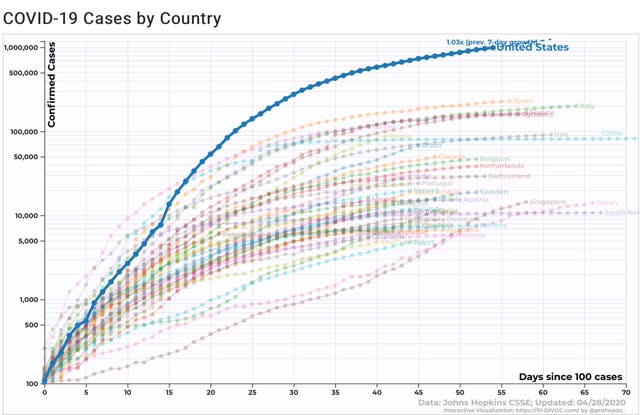
- Number: US: up +24,114 to 1,040,488 (vs. day/day high of +36,161 on April 24; 3 day average of 24,709, down -26.1% from 33,437 peak on April 8-10)(#1 in the world, 5.7x #2 Spain)(outlier at top of graph below)
-
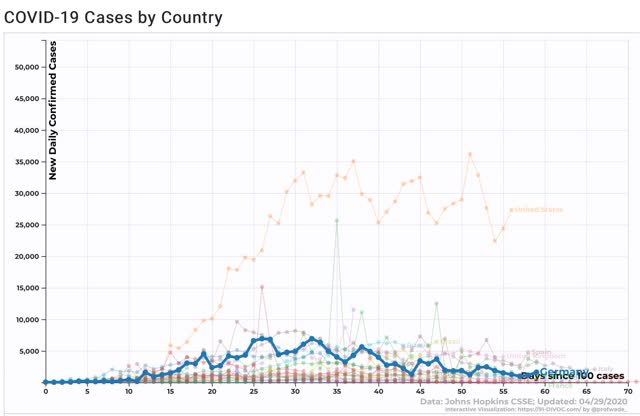
There has been a slight decrease in the number of new cases in the US. The US has the worst record in the world, by far.
I have discontinued tracking the rate of new cases and deaths each day. That was to determine if we were “bending the curve.” We were. the issue now is whether cases will continue to go down in any significant way or not.
Number of deaths and infections and rate of increase of testing (from COVID Tracking Project)
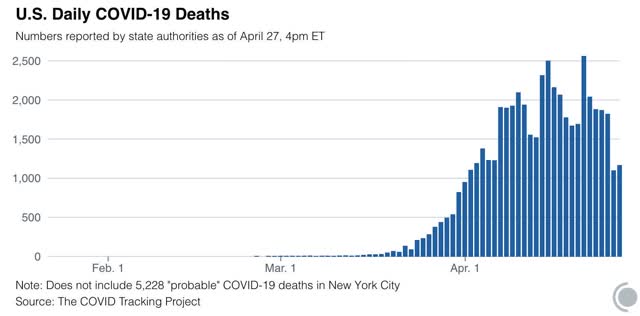
- ***Number of deaths: Total 52,525, increase of +2,700 day/day (new daily high)
-
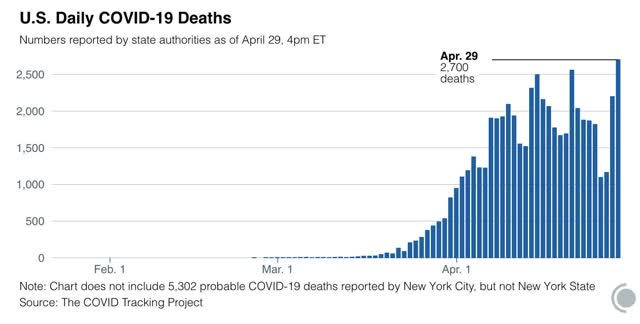
- Seven day average of deaths: 1,722 vs. 2,058 peak on April 21
- Number of tests: 230,442 (vs. 300,833 daily peak on April 25*)**
- Ratio of positive tests to total: 8.4:1 (vs. 8.7 on April 27)
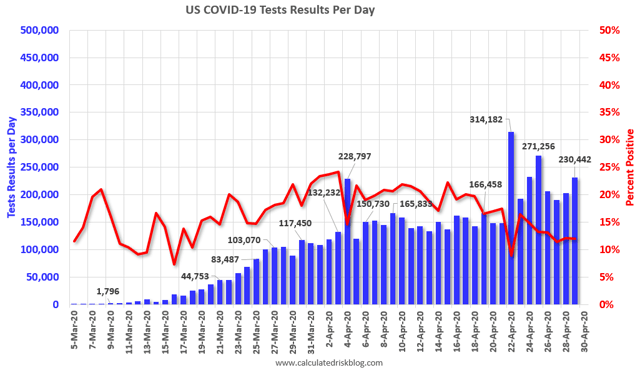
In the past two weeks, as shown in the graph above, the percentage of positive to total tests has declined from about 20% to 12%,or an average of -4% a week. If this should fall to 6%, then based on the history of South Korea, lockdowns can begin to be judiciously lifted and a thoroughgoing regimen of “test, trace, and isolate” can be begun.
*ex.-Calif clearing its backlog
Summary for April 29
- The US leads the world by far in new infections (including per capita) and deaths; and is second among significant sized countries only to Spain among total cases per capita; while several other countries, including developing country Vietnam, have brought their caseloads to zero. This is abject failure on a horrid scale.
- The total US population remains under total lockdown has declined substantially due mainly to the renegade States in the Confederacy.
- The number of daily new infections, adjusted for testing, appears to have peaked one to two weeks ago.
- The number of daily new deaths also appears to have peaked about one week ago.
- The trend number of daily tests has improved dramatically in the past 6 days from an average of about 150,000-160,000 to about 220,000. Better still, for the last 4 days, new infections have declined, even with higher testing - a very positive, if preliminary, sign.
- My personal suspicion remains that the actual number of total infections in the US is about 5x the official number, or roughly 5 million at present.
- Going forward, it will probably be important to separate out those States which are “opening up” without sufficient testing or precautions, which I expect to see a new wave of infections, vs. States which want to drive the number of new infections close enough to zero to follow an intensive “test, trace, and isolate” approach.
New jobless claims pass 30,000,000 for the past 5 weeks
- by New Deal democrat
Initial jobless claims last week declined (!) to 3.839 million. That brings the total number of new jobless claims over the past 5 weeks since the coronavirus crisis started to 30.2 million:
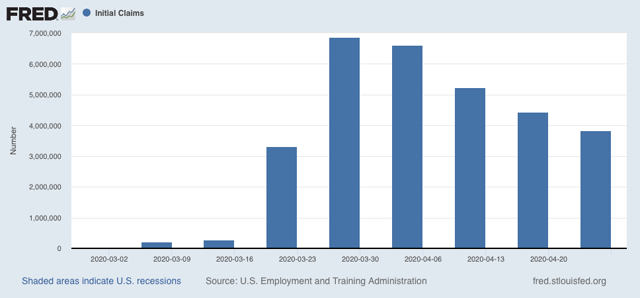
We know that many people have been unable to file due to State systems being overloaded or obtuse, so the total number is undoubtedly substantially higher.
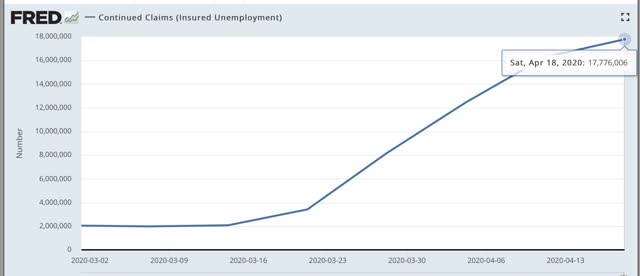
Continuing claims, with a one week delay, totaled 17.776 million:
Just before the crisis hit, the civilian labor force was almost exactly 50% of the population. Since we don’t know that the former will be yet for April, the below graph divides continuing claims by population/2, and multiplies by 100 for the percent of the labor force that had continuing jobless claims as of last week’s figure:
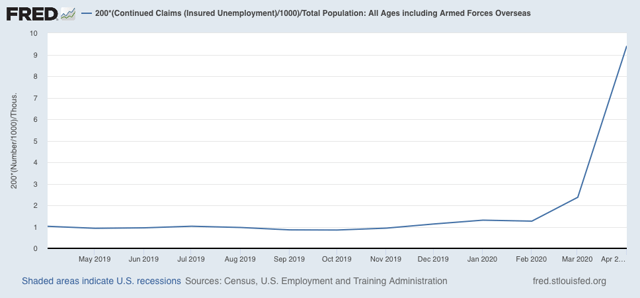
As you can see, that is about 10% of the entire labor force, which was about 165 million in February, the last month before the crisis.
We may already be beginning to see substantial “second order” effects, as the closure of certain sectors of the economy slices the demand for goods or services in other sectors, which begin their own layoffs. Probably within the next two weeks, those second order effects will become the predominant driver of new claims.
Wednesday, April 29, 2020
The widely followed IHME model of coronavirus cases has been much too optimistic
- by New Deal democrat
The IHME model by the University of Washington has gotten a lot of attention in the past month, most likely because it has always forecast a much lower number of total deaths caused by coronavirus than, for example the Imperial College of London’s model, that forecast over 1 million US deaths if no quarantine measures were put in place.
But that model has come in for a lot of criticism, and I have come to distrust it. Its main feature - and biggest shortcoming in my opinion - is that it assumes that the US path will follow that of China and South Korea, where after the peak is reached, the disease ramps down just as quickly as it ramped up.
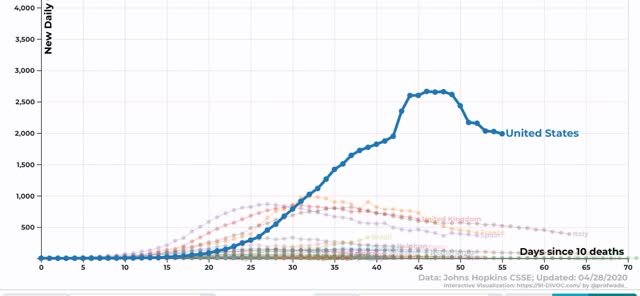
Here is what the model predicts today: a quick ramp-down in new deaths to below 500/day no later than the 3rd week of May (and most likely before May 10), and virtually no deaths at all after June 1:
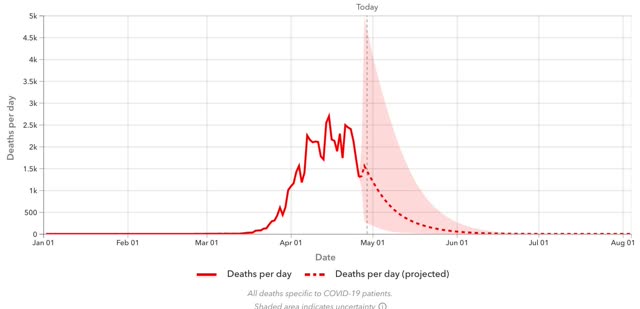
That strikes me as totally unbelievable.
My skepticism is increased because, over the past month this model has consistently underestimated the actual path of new deaths.
The below graph shows the model’s forecast as it has changed since its original forecast in late March:
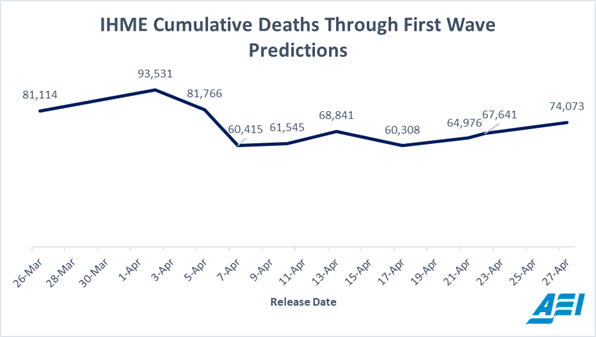
Note that the forecast dropped from a high of about 94,000 deaths projected on April 1, to 82,000 on April 5, and again to 60,000 on April 7.
Here is the full spectrum prediction from April 8:
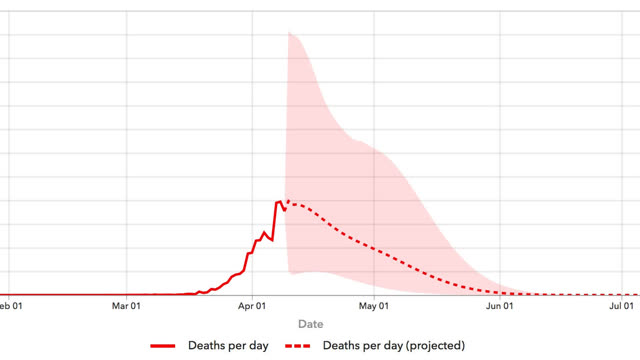
The model forecast that that very day was the peak, and that by the end of the month we would be recording only 1,000 deaths per day, rapidly dropping to zero by the end of May. In fact the error bands get narrower and narrower the longer the time period goes on.
That a model gets more and more certain in its forecast as time goes on strikes me as fundamentally wrong.
By contrast, via Carl Bergstrom, a professor of biology at the University of Wisconsin, here is the model of Youyang Gu, a data scientist at MIT, as of April 27:
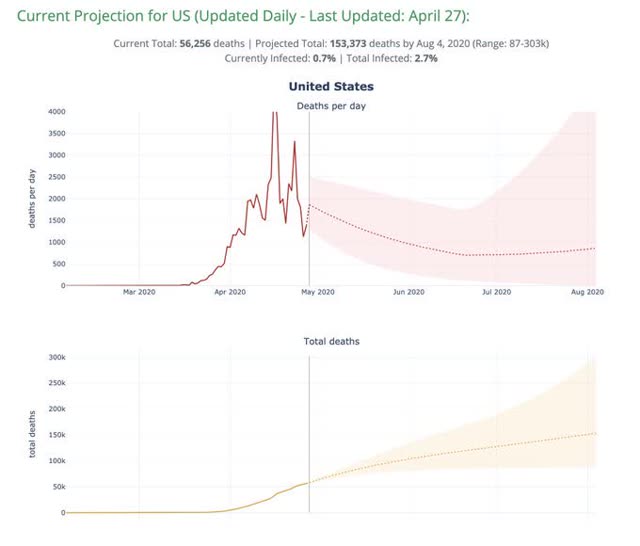
This model shows a much more gradual sloping down of the number of deaths in May to about 800 by June 1, and even suggests a mild second wave of increased deaths during the summer. He projects about 150,000 deaths by August.
This more pessimistic model is much more in keeping with the gradual decline from peak we have seen in the last several weeks, and even at least nods to the impatience to “open up” society in some States, that is likely to lead to an increase in infections and deaths in those States.
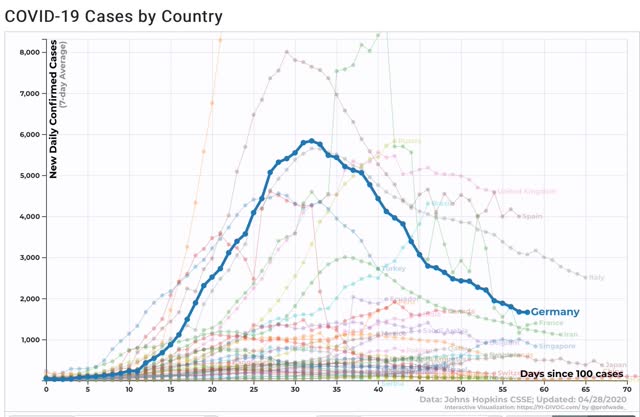
It is also much more in keeping with what we have seen in Europe, where even the most successful county, Germany, has seen its decline of 2/3’s from peak be much more gradual (although faded, you can see Spain and Italy having similar, and even more gradual declines from their respective peaks):
Abbreviated coronavirus dashboard for April 29: actual good news on testing, deaths
- by New Deal democrat
Here is the update through yesterday (April 28). This is somewhat abbreviated since I want to post about a couple of other items.
As usual, new items of significance are in italics. Yesterday was the 3rd day in a row of not just significantly increased testing, but actual lower number of infections found by that testing - a very good sign. The 7 day average of deaths also moved into significant decline. At least those States which are sticking with a “crush the curve” strategy appear to be turning the corner.
Here are yesterday’s numbers.
Number and rate of increase of Reported Infections (from Johns Hopkins via arcgis.com)
- Number: up +24,114 to 1,012,583 (vs. day/day high of +36,161 on April 24)
- ***US Rate of increase: day/day: 2% (vs. 3% for the past week and 2% on April 27
The trend seems to be a slight decrease in the number of new cases.
Number of deaths and infections and rate of increase of testing (from COVID Tracking Project)
- ***Number of deaths: Total 52,525, increase of +2,197 day/day
-
- Seven day average of deaths: 1,722 vs. 2,058 peak on April 21 (this is important because many fewer deaths are recorded by the States over the weekend, and there is a jump in reports on Tuesdays.
-
- Rate: increase of 4% day/day vs. average of 4% in past week
- Number of tests: 200,233 (vs. 300,833 daily peak on April 25*)**
- Ratio of positive tests to total: 8.3:1 (vs. 8.7 on April 27)

NOTE that in the past two weeks, as shown in the graph above, the percentage of positive to total tests has declined from about 20% to 12% in a fairly straight line. That’s an average of 4% a week. If this should continue, within two weeks that percentage will be down to 5% or below. That translates into a ratio of better than 15:1 total to positive tests, and is my threshold, based on the history of South Korea, when lockdowns can begin to be judiciously lifted and a regimen of “test, trace, and isolate” can be begun.
*ex.-Calif clearing its backlog
Summary for April 29
- The total US population remains under total lockdown has declined substantially due mainly to the renegade States in the Confederacy.
- The number of daily new infections, adjusted for testing, appears to have peaked one to two weeks ago.
- The number of daily new deaths also appears to have peaked about one week ago.
- The trend number of daily tests has improved dramatically in the past 6 days from an average of about 150,000-160,000 to about 220,,000. Better still, for the last 3 days, new infections have declined, even with higher testing - a very positive, if preliminary, sign.
- My personal suspicion remains that the actual number of total infections in the US is about 5x the official number, or roughly 5 million at present.
- Going forward, it will probably be important to separate out those States which are “opening up” without sufficient testing or precautions, which I expect to see a new wave of infections, vs. States which want to drive the number of new infections close enough to zero to follow an intensive “test, trace, and isolate” approach. As indicated above, those States may be within 2 weeks of being able to implement that regimen.
Sent from my iPad
Tuesday, April 28, 2020
Coronavirus dashboard for April 28: good news on testing at least
- by New Deal democrat
Here is the update through yesterday (April 27).
As usual, significant developments are in italics. There were some late-reporting States for testing yesterday, so the initially discouraging number was actually pretty good. We are now seeing much more testing, and for the last two days an actual decrease in new infections being found. One problem is that this is mainly due to one State: New York.
Discouragingly, 11 States have decided to at least partly “open up.” A few of these - Alaska and Idaho - a mainly rural and sparsely populated, with near single-digit new cases, so limited openings with social distancing restrictions can be justified. But most of the rest are recalcitrant States from the Confederacy that were among the last to issue stay-at-home orders. These will now be watched for a resurgence in cases over the next several weeks.
Here are yesterday’s numbers.
Number and rate of increase of Reported Infections (from Johns Hopkins via arcgis.com)
- Number: up +22,536 to 988,469 (vs. day/day high of +36,161 on April 24)
- NY: 3,951 day/day (vs. 11,434 on April 15 peak)
- US ex-NY: 21,876 (vs. 27,051 on April 15 NY peak)
- ***US Rate of increase: day/day: 2% (vs. 3% for the past week, and 3% on April 26)
The trend seems to be a slight decrease in the number of new cases. This is almost entirely due to New York.
Number of deaths and infections and rate of increase of testing (from COVID Tracking Project)
- ***Number of deaths: Total 50,327, increase of +1,163 day/day
-
- Rate: increase of 2% day/day vs. average of 4% in past week
- Number of tests: 190,443 (vs. 300,833 daily peak on April 25*)**
- Ratio of positive tests to total: 8.7:1 (new daily peak)**
*ex.-Calif clearing its backlog
**Note: There were some late daily reports, so this was originally reported as 135,505 as shown in the accompanying graph.
STATES “Re-opening” for businesses: AK, CO, GA, IA, ID, MS, OK, SC TN, TX
A few of these are rural States that, after locking down, had near single-digit increase in cases daily; but mainly these are Confederate States that were among the last to go to lockdowns. GA and MS in particular have poor testing records, and Mississippi has the worst record for continuing increases in infections for any of all the 50 States. I will track these, although not on a daily basis. I expect renewed increases in infections in most of them.
Summary for April 28
- The total US population remains under total lockdown has declined substantially due mainly to the renegade States in the Confederacy.
- The number of daily new infections, adjusted for testing, appears to have peaked one to two weeks ago. But almost all of the decline since then has been due to NY. The only other State with a large population to contribute to the declining trend has been Washington.
- Deaths daily may be increasing slightly, or may possibly have peaked (fewer deaths have been recorded on weekends, so the 7 day trend is more important here).
- The trend number of daily tests has improved dramatically in the past 5 days from an average of about 150,000-160,000 to 223,000. For the first 3, we were picking up a higher number - but decreasing rate - of new infections. For the last 2, new infections have declined, even with higher testing - a very positive, if very preliminary, sign.
- Nevertheless, we are still missing a large percent of new infections. My personal suspicion remains that the actual number of total infections in the US is about 5x the official number, or roughly 5 million at present.
- Aside from New York, there is no indication that any sort of tracing and isolation regimens are ramping up in any meaningful sense. Aside from rural areas with low population densities, those States that are “opening up” will probably experience a resurgence in cases.
Monday, April 27, 2020
The biochemistry of how COVID-19 attacks the body: a synopsis of the medical studies
- by New Deal democrat
I’ve been doing some reading over the past several weeks, trying to understand how the COVID-19 virus attacks the human body. Below are quotes I found most noteworthy or interesting from these articles.
In essence, they indicate that biochemically the novel coronavirus, COVID-19, mainly binds to the ACE-2 receptor of cell surfaces to gain entrance. These are most prevalent in nasal and mucus cells, alveoli (oxygen-exchanging cells in the longs), and some cells lining the small intestine, which explains why the disease may start as abdominal discomfort in many patients. There are some conditions, especially high blood pressure and diabetes - or, possibly, medications for those conditions - which cause these ACE-2 receptors to be more expressed.
Conversely, nicotine may cause a decline in the expression of ACE-2 receptors, acting to protect against the disease. But if smokers do get the disease and are admitted to the hospital, the cessation of nicotine ingestion may lead to a rebound in those receptors, worsening the condition.
The virus also appears to bind to an iron ion in hemoglobin in red blood cells, causing blood clots and also preventing those cells from carrying oxygen to the rest of the body. This may explain the horribly low blood oxygen levels seen in many patients; and also why some otherwise asymptomatic patients suffer heart attacks or strokes.
Even more alarming, like HIV the coronavirus appears to attack the immune system itself, binding to a different receptor, called CD147, on the T-cell leukocytes that are sent to attack it, disabling them and causing the immune system to be suppressed. It seems to be when the immune system is overwhelmed in this way (in about 10 days on average) that the disease suddenly takes a deadly turn.
[One obvious note of caution: since the following research was necessarily conducted on the fly, in the teeth of a raging pandemic, it would not be a surprise if ultimately of much of it were found, if not wrong, at least significantly in error.]
Here are the synopses:
Science Daily: The virus gains interest to cells by means of the ACE-2 receptor on the cell surface, that typically is involved in blood glucose regulation:
“These investigators used the knowledge they gleaned from multiple SARS-CoV strains -- isolated from different hosts in different years -- and angiotensin-converting enzyme-2 (ACE2) receptors from different animal species to model predictions for the novel Wuhan coronavirus. [NOTE: ACE2 serves normally as a regulator for heart function.]
"Our structural analyses confidently predict that the Wuhan coronavirus uses ACE2 as its host receptor," the investigators wrote. That and several other structural details of the new virus are consistent with the ability of the Wuhan coronavirus to infect humans and with some capability to transmit among humans.”
BioQuick News: How SARS-CoV-2 (COVID-19) Gets into Respiratory Tissue -- And How It May Exploit One of Our Anti-Viral Defenses; Interferon Boosts ACE2, Which Is Cell Surface Receptor That COVID-19 Binds To:
“ Recent research had found that SARS-CoV-2--like the closely related SARS-CoV that caused the SARS pandemic--uses a receptor called ACE2 (angiotensin-converting enzyme 2) to gain entry into human cells, aided by an enzyme called TMPRSS2 (transmembrane serine protease 2). That led Dr. Ordovas-Montanes and Dr. Shalek and colleagues to ask a simple question: which cells in respiratory and intestinal tissue express both ACE2 and TMPRSS2?
“ .... They found that only a tiny percentage of human respiratory and intestinal cells, often well below 10 percent, make both ACE2 and TMPRSS2. Those cells fall in three types: goblet cells in the nose that secrete mucus; lung cells known as type II pneumocytes that help maintain the alveoli (the sacs where oxygen is taken in); and one type of so-called enterocytes that line the small intestine and are involved in nutrient absorption.
Nature: Infection prodeeds through as many as three phases: (1) an asymptomatic phase; if the body does not fight off the virus quickly enough, it proceeds to (2) a mildly symptomatic phase. If after about 10 days or so the body has still not fought off the virus, it proceeds to the devastating phase, including the oxygen transfer cells in the lungs, and also involving the blood cells themselves:
“SARS-CoV-2 infection can be roughly divided into three stages: stage I, an asymptomatic incubation period with or without detectable virus; stage II, non-severe symptomatic period with the presence of virus; stage III, severe respiratory symptomatic stage with high viral load.
“when a protective immune response is impaired, virus will propagate and massive destruction of the affected tissues will occur, especially in organs that have high ACE2 expression, such as intestine and kidney. The damaged cells induce innate inflammation in the lungs that is largely mediated by pro-inflammatory macrophages and granulocytes. Lung inflammation is the main cause of life-threatening respiratory disorders at the severe stage.
“The cytokine release syndrome (CRS) seems to affect patients with severe conditions. Since lymphocytopenia* is often seen in severe COVID-19 patients, the CRS caused by SARS-CoV-2 virus has to be mediated by leukocytes other than T cells, as in patients receiving CAR-T therapy; a high WBC-count is common, suggesting it, in association with lymphocytopenia, as a differential diagnostic criterion for COVID-19.”
[*low T-cell count. More about COVID-19 and T-cells and the immune system below.]
Science Magazine: also addresses the stages by which the disease progresses:
“ As the virus multiplies, an infected person may shed copious amounts of it, especially during the first week or so. Symptoms may be absent at this point. Or the virus’ new victim may develop a fever, dry cough, sore throat, loss of smell and taste, or head and body aches.
“If the immune system doesn’t beat back SARS-CoV-2 during this initial phase, the virus then marches down the windpipe to attack the lungs, where it can turn deadly. The thinner, distant branches of the lung’s respiratory tree end in tiny air sacs called alveoli, each lined by a single layer of cells that are also rich in ACE2 receptors.
“ Normally, oxygen crosses the alveoli into the capillaries, tiny blood vessels that lie beside the air sacs; the oxygen is then carried to the rest of the body. But as the immune system wars with the invader, the battle itself disrupts this healthy oxygen transfer. Front-line white blood cells release inflammatory molecules called chemokines, which in turn summon more immune cells that target and kill virus-infected cells, leaving a stew of fluid and dead cells—pus—behind. This is the underlying pathology of pneumonia, with its corresponding symptoms: coughing; fever; and rapid, shallow respiration (see graphic). Some COVID-19 patients recover, sometimes with no more support than oxygen breathed in through nasal prongs.
“ .... The disruption seems to extend to the blood itself. Among 184 COVID-19 patients in a Dutch ICU, 38% had blood that clotted abnormally, and almost one-third already had clots, according to a 10 April paper in Thrombosis Research. Blood clots can break apart and land in the lungs, blocking vital arteries—a condition known as pulmonary embolism, which has reportedly killed COVID-19 patients. Clots from arteries can also lodge in the brain, causing stroke. Many patients have “dramatically” high levels of D-dimer, a byproduct of blood clots, says Behnood Bikdeli, a cardiovascular medicine fellow at Columbia University Medical Center.”
ChemRxiv (pre-print server for chemistry studies): The virus seems to bind to the hemoglobin in red blood cells, preventing oxygen transfer to other cells in the body, and promoting clotting of the red blood cells themselves:
“The results showed the ORF8 and surface glycoprotein could bind to the porphyrin, r espectively. At the same time, orf1ab, ORF10, and ORF3a proteins could coordinate attack the heme on the 1-beta chain of hemoglobin to dissociate the iron to form the porphyrin. The attack will cause less and less hemoglobin that can carry oxygen and carbon dioxide. The lung cells have extremely intense poisoning and inflammatory due to the inability to exchange carbon dioxide and oxygen frequently, which eventually results in ground-glass-like lung images. The mechanism also interfered with the normal heme anabolic pathway of the human body, is expected to result in human disease.”
Thailand Medical News: More on the virus’s effect on red blood cells. It binds to the iron ion in the red blood cells. This is how it prevents oxygen transfer:
“The research discovered that some of these proteins are to hijack the red blod cells and remove the Iron ions from the heme groups (HBB) and replace themselves with it. This makes the hemoglobin unable to transport oxygen.
“As a result the lungs are stressed out and inflamed while the rest of the organs are also being affected. The so called ARDS and subsequent organ failure could be attributed to this.”
“As a result the lungs are stressed out and inflamed while the rest of the organs are also being affected. The so called ARDS and subsequent organ failure could be attributed to this.”
“The cells that the virus binds to using the ACE-2 receptor or three types: mucus producing cells; the alveoli in the lungs that hold oxygen; and nutrient absorbing cells in the intestines.
[This probably explains why a large number of coronavirus infections begin with intestinal distress. The above two articles also explain why so many severe infections include strikingly low blood oxygen levels, and also why so much blood clotting is found in patients, including otherwise symptomatic patients who may suffer heart attacks or strokes.]
[This probably explains why a large number of coronavirus infections begin with intestinal distress. The above two articles also explain why so many severe infections include strikingly low blood oxygen levels, and also why so much blood clotting is found in patients, including otherwise symptomatic patients who may suffer heart attacks or strokes.]
BioQuick News: How SARS-CoV-2 (COVID-19) Gets into Respiratory Tissue -- And How It May Exploit One of Our Anti-Viral Defenses; Interferon Boosts ACE2, Which Is Cell Surface Receptor That COVID-19 Binds To:
“ The biggest pre-existing condition that is associated of a bad outcome to the infection is high blood pressure. Another significant predisposing condition is diabetes. Because some drugs used to treat each condition stimulate the increase of ACE-2 receptors, concern has been raised by users about the safety of those medications. At least 14 medical societies have weighed in, cautioning patients that they should continue with their medications:”
ArXiv (publication services for various physical sciences and mathematical disciplines) on whether treatments for high blood pressure and diabetes, rather than the conditions themselves, lead to the bad outcomes:
“ The discovery of the role of ACE2 as the membrane receptor of SARS-CoVs and SARS-CoV2, raises controversial opinions concerning the effect of medical treatments in facilitating virus infection in human body. Because of the comorbidity of COVID19 with several diseases, like hypertension and diabetes, conventional pharmacological treatments are also under consideration. Hypotheses have been therefore put forward, especially from social media, to suggest potential adverse effects of angiotensin converting enzyme inhibitors (ACE-i) or Angiotensin Receptor Blockers (ARBs or Sartans), in COVID-2019, because of their action on the RAS pathway. This also provoked justified alarmed recommendations from different Scientific Societies that underlined the lack of evidence against ACE-i or ARB medication.”
Touch Endocrinology: Here is another article, questioning if they is the treatment of high blood pressure and diabetes that raises the incidence of severe infections, rather than the disease itself:
“ The most frequent comorbidities to COVID 19 are hypertension and diabetes. Both diseases are often treated with angiotensin-converting enzymes (ACE) inhibitors. Coronavirus binds to target cells through angiotensin-converting enzyme 2 (ACE2), which expressed in the epithelial cells in the lungs, blood vessels and in the intestine. In patients treated with ACE and angiotensin II receptor blockers, expression of ACE2 is increased. Therefore, it has been suggested that ACE2 expression may be increased in these two groups of patients with hypertension and diabetes, which could facilitate infection with COVID-19 and increase the risk of severe disease and fatality.”
Nephrology Journal club: Here is another note advising patients not to change their medication: :
“Patients who are taking ACE inhibitors or ARBs are not advised to change their therapy unless advised to do so by their physician.[citing 14 specialized medical associations]
Diabetes Research and Clinical Practice: Here is an article about the blood pressure medications that stimulate the expression of ACE-2 receptors in cells:
“ SARS-CoV-2 utilizes ACE2 as a receptor for entry into the host pneumocytes. Herein comes the confounding role of ACE inhibitors (ACEi) and angiotensin-receptor blockers (ARBs), drugs that are so widely used in DM. The expression of ACE2 is markedly increased in patients with DM (and hypertension) on ACEi or ARBs as an adaptive response to counteract the elevated levels of Ang-II and Ang-I. Thus, use of ACE2-stimulating drugs would facilitate the entry of SARS-CoV-2 into pneumocytes and consequently might result in more severe and fatal disease. Amongst others, pioglitazone and liraglutide have also been shown to be associated with ACE2 upregulation in animal studies. Unfortunately, none of the studies have taken into account the baseline treatment. Furthermore, a recently concluded study showed that severe and critically ill patients with COVID-19 had a higher prevalence of hypokalemia that resulted from renal potassium wasting. This can be explained by downregulation of ACE2 following viral intrusion resulting in decreased degradation of angiotensin-II, increased aldosterone secretion and subsequent increased urinary potassium loss. Infact early normalization of serum potassium has been proposed to be a predictor of good prognosis in COVID-19”
Diabetes Controal: On the other hand, the most-prescribed medication for diabetes, metformin, is not subjec to this issue, and has been identified as potentially having chemical benefits in treating the infection:
“ On the list [of drugs which appeared chemically to be of use against coronavirus] were certain antibiotics, metformin, the go-to drug for type 2 diabetes ....”
Qeios Open Science platform: Nicotine may alter the expression of the ACE-2 receptor, offering protection against severe disease; but cessation of smoking in a hospital setting may lead to an opposite effect:
“ There are however, sufficient scientific data to suggest that smoking protection is likely to be mediated by nicotine. SARS-CoV2 is known to use the angiotensin converting enzyme 2 (ACE2) receptor for cell entry, and there is evidence that nicotine modulates ACE2 expression which could in turn modulate the nicotinic acetyl choline receptor (manuscript submitted). We hypothesize that SARS-CoV2 might alter the control of the nicotine receptor by acetylcholine. This hypothesis may also explain why previous studies have found an association between smoking and Covid-19 severity. As hospitals generally impose smoking cessation and nicotine withdrawal at the time of hospitalization, tobacco (nicotine) cessation could lead to the release of nicotine receptors, that are increased in smokers, and to a “rebound effect” responsible for the worsening of disease observed in hospitalized smokers.”
Thailand Medical News: The novel coronavirus goes further, attacking the immune system itself, in a manner similar to HIV. It binds with T-cells and disables them:
“ Researchers from the New York Blood Centre and also from Fudan University in Shanghai have discovered that the SARS-CoV-2 coronavirus which causes the COVID-19 disease that often results severe acute respiratory syndrome also attacks the immune system’s T lymphocytes. The worrying findings highlight the destructive power of the novel coronavirus, which can destroy the immune system, leaving the patient vulnerable and unable to fight off the infection.
“ The researchers’ surprise discovery has shed light on the potency of the novel coronavirus is killing powerful immune cells, which are supposed to kill the virus instead.
“ The researchers’ surprise discovery has shed light on the potency of the novel coronavirus is killing powerful immune cells, which are supposed to kill the virus instead.
“ However, surprisingly, the researchers found that when the SARS-Cov-2 coronavirus and the T cell came into contact with each other, the T cell became prey to the coronavirus, wherein a structure in the spike of the coronavirus triggered the attachment of a viral envelope to the cell membrane of the T cells. After, the genes of the virus entered the T cell and overwhelmed it and took it hostage, the SARS-Cov-2 coronavirus deactivated its ability to protect the human host body.
“ Also, the team found that unlike HIV that replicates faulty T cells, the coronavirus does not replicate, showing that the T cells and the virus may end up dying together.”
Medical News: But the mechanism for attacking the T-cells does not seem to involve ACE-2 receptors, of which the T-cells only have a few:
“ T cells contain only a few ACE2 receptor proteins.”
Nature: The receptor on T-cells that the novel coronavirus is a different one, called CD147:
“ ... T-cell lines were significantly more sensitive to SARS-CoV-2 infection when compared with SARS-CoV. In other words, these results tell us that T lymphocytes may be more permissive to SARS-CoV-2 infection .... Therefore, it is plausible that the S protein of SARS-CoV-2 might mediate potent infectivity, even on cells expressing low hACE2, which would, in turn, explain why the transmission rate of SARS-CoV-2 is so high. It is also possible that other receptors mediate the entry of SARS-CoV-2 into T cells, such as CD147, present on the surface of T lymohocytes, which was recently reported to be a novel invasive route for SARS-CoV-2.
Science Magazine: using genetics to identify individual susceptibility to the virus, to identify people who most need protection, and also those who might be at little risk:
“COVID-19, caused by the new pandemic coronavirus, is strangely—and tragically—selective. Only some infected people get sick, and although most of the critically ill are elderly or have complicating problems such as heart disease, some killed by the disease are previously healthy and even relatively young. Researchers are now gearing up to scour the patients’ genomes for DNA variations that explain this mystery. The findings could be used to identify those most at risk of serious illness and those who might be protected, and they might also guide the search for new treatments.
“ Ganna heads up a major effort to pool COVID-19 patients’ genetic data from around the world. The idea “came quite spontaneously” about 2 weeks ago when “everyone was sitting at their computers watching this crisis,” says Ganna, who is also affiliated with the Broad Institute, a U.S. genomic powerhouse.treatments.
“He and FIMM Director Mark Daly quickly created a website for their project, the COVID-19 Host Genetics Initiative, and reached out to colleagues who run large biobank studies that follow thousands of volunteers for years to look for links between their DNA and health. At least a dozen biobanks, mostly in Europe and the United States, have expressed interest in contributing COVID-19 data from participants who agreed to this.
“In addition to genetic variants of the ACE2 receptor, scientists want to see whether differences in the human leukocyte antigen genes, which influence the immune system’s response to viruses and bacteria, affect disease severity. And some investigators want to follow up a finding, which a Chinese team reported in a preprint: that people with type O blood may be protected from the virus. “We’re trying to figure out if those findings are robust,” says Stanford University human geneticist Manuel Rivas, who is contributing to Ganna’s initiative.”
Sunday, April 26, 2020
Heads up for tomorrow!
- by New Deal democrat
Tomorrow morning I have a very long post quoting about 20 medical articles at length, explaining (what we think we know so far about) the whole biochemistry of how the novel coronavirus attacks the body.
By the time you finish reading it, you will understand a lot about why the disease attacks the organs it does, why it progresses in the order it does, why it produces some extremely unusual complications in victims who otherwise feel perfectly healthy, why there are some special risk factors and possibly a couple of protective ones as well, and finally genetic identification posssibilites for people most or least at risk.
Heads up!
What the ratio of positive tests to total test results for coronavirus is telling us
- by New Deal democrat
I want to make a comment about the value of measuring the number of coronavirus tests being administered vs. the number of cases found by those tests. This is because a few people are claiming that the ratio of positive tests to total tests does not give us value. Rather, they claim, increased testing simply reveals increased infections.
I will make a bold, unqualified claim: they’re wrong. Here’s why.
Empirically, about 6 weeks ago I looked at the South Korea data and realized that the peak was in once the percentage of positives to total tests started to decline. I suggested tracking that to Bill McBride, who has since included it in his daily testing updates. It turns out this ratio has a name in the epidemiological literature (which, sorry, I’ve forgotten), and is regarded as a useful “second-best” type of measurement.
Imagine we are tasked with finding out whether there is a constant ratio of red M&M’s vs. the entire batch produced. We are asked to figure out if the ratio is the same, or if the number of red M&M’s is increasing or decreasing.
There are 1000 M&M’s in a batch. We can only sample 100 of them. So we pull 100 at random every day, and count the number of red M&M’s in our sample. Depending on whether the number of red M&M’s in our sample is increasing, decreasing, or staying the same, we conclude that the total number of red M&M’s in the entire batch is likewise increasing, decreasing, or staying the same.
While any given sample might be off, over the longer term our conclusion is almost certainly correct. What’s more, even if our sample turns out not to be random, but is non-random *in the same way* each day, our conclusion is probably still accurate, because the error in our calculations always goes in the same direction. Thus the day/day progression is still true.
That’s what we’re seeing in coronavirus testing. We have certainly not been testing enough. But what we didn’t see was an increasing percentage of positives compared with the more or less stalled number of total tests during the first three weeks of this month. To go back to our analogy, during the first three months of April we found a similar number of red M&M’s every day in our similar sized samples.
That tells me that the incidence of coronavirus infections was not increasing during that time.
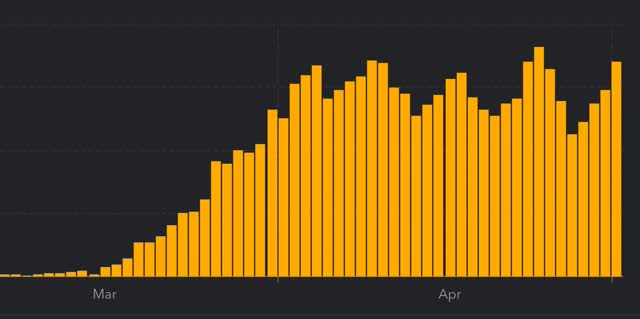
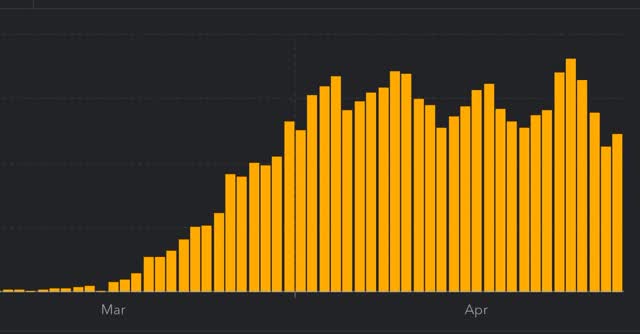
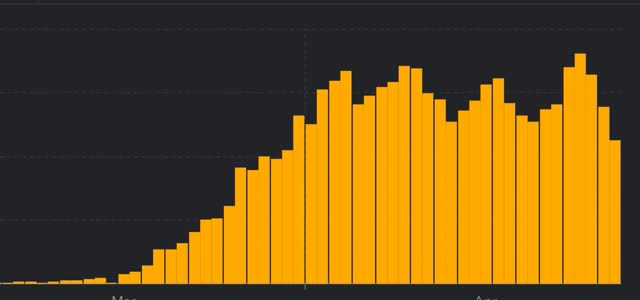
In the last few days, as shown in the below graph, the number of tests administered daily has increased. So has the number of infections found:
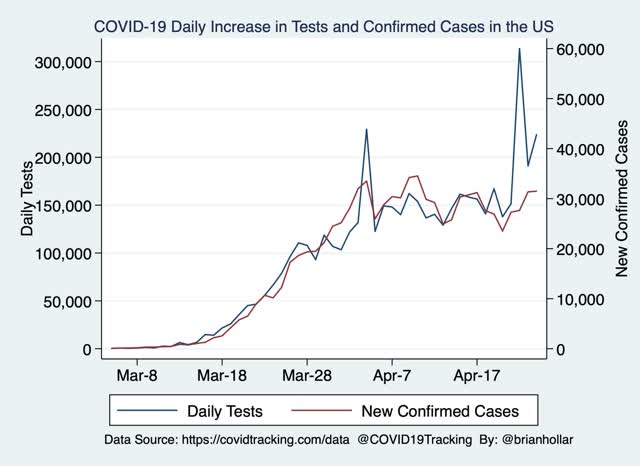
But the rate of increase has not been the same - far from it.
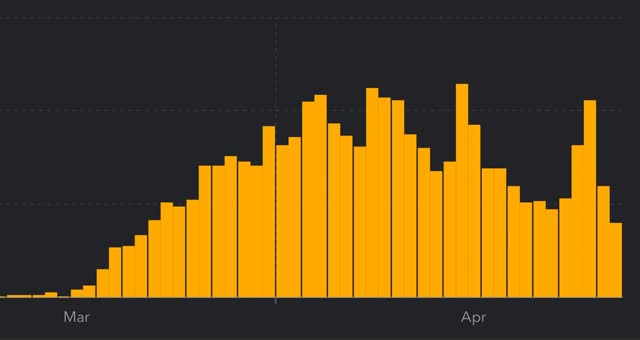
The above graph ends with April 24. Here’s what the number of new daily infections including April 25 looks like:
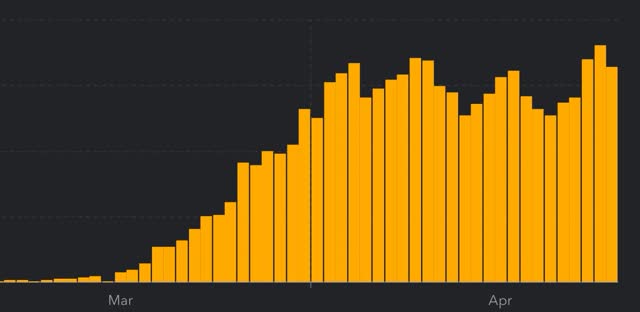
Now look at the first three-day peak from about three weeks ago (specifically, April 2-4). During that 3 day period, a total of 94,912 new infections were diagnosed vs. 103,735 in the past 3 days (April 23-25). That’s an increase of 9.3%.
Now let’s compare the number of tests administered over those same 3 day intervals. During the 3 day period of April 2-4, 484,256 tests were administered. During April 23-25, 717,079 tests were administered. That’s an increase of 48.1%.
So we administered 48.1% more tests, and only found 9.3% more infections. In other words, the number of recorded infections probably only increased because we had the increased ability to find them. That simply does not support any conclusion that the number of infections is increasing. The number of new daily infections is either staying the same, and, more likely, is decreasing — because we found infections in only 14.5% of the tests we administered in the past 3 days vs. 19.6% of tests administered during April 2-4.
That’s the significant open issue: are new daily infections actually declining, albeit at far too slow a rate, or are they just staying at a plateau? My suspicion is, because the rate of increase in infections found was so small compared with the big increase in testing, that the former situation, i.e., a slow decline from peak, is the truth.
Subscribe to:
Posts (Atom)