Saturday, October 31, 2020

Weekly Indicators for October 26 - 30 at Seeking Alpha


 - by New Deal democrat

My Weekly Indicators post is up at Seeking Alpha.

Neither of the two constraints determining where the economy will go in the next few quarters are economic themselves. Rather, they are (1) the course of the pandemic, which will in turn be heavily influenced by (2) the outcome of the US elections on Tuesday.

As usual, clicking over and reading rewards me a little bit for my efforts as well as bringing you up to the virtual moment on the economy.

Friday, October 30, 2020

Personal income and spending both surprisingly continued to increase in September, plus a note on GDP


 - by New Deal democrat

Yesterday the first estimate of Q3 GDP was reported. Since this report includes 2 long leading indicators, it gives us insight into what the economy might be like in the 2nd half of next year.


I have a post on that up at Seeking Alpha. As usual, clicking over and reading should be informative for you, and it rewards me a little bit for my efforts.

This morning personal income and spending for September was reported. Both real income and spending increased, which is positive - and surprising.

On the spending side, below I show real personal spending (blue) in comparison with real retail sales (red), both scaled to 100 as of January of this year:


Both show similar trajectories, collapsing in April and rebounding since, including a further monthly increase from August to September. While real retail sales have exceeded their precession peak, the broader measure of real personal spending has still only recovered about 85% of its decline.

On the income side, here is a long term view of real personal  income minus transfer payments (like unemployment insurance)(red, right scale) vs. real disposable personal income (blue, left scale):


The former is one of the coincident economic series focused on by the NBER in declaring the beginning and end dates for recessions. Similarly to real personal income less transfer payments discussed above, it has rebounded by about 70% from its April bottom. Disposable income, however, increased sharply with the emergency Congressional stimulus, and remains elevated several percent above where it was just before the pandemic hit, as shown better in the close-up of the last two years shown below:


The continuing improvement in spending, and the fact that income remains elevated, despite the failure of Congress (due almost 100% to the Senate) to extend any further stimulus, is the biggest surprise in the economic data over the past several months.

Thursday, October 29, 2020

Jobless claims: continued slow progress


 - by New Deal democrat

A quick note about the first report of Q3 GDP released this morning: the rebound is only about 2/3’s of the decline from last year. We are still about 3.5% below that number. On a *relative* basis, this was a “good” number, but on an absolute basis, this is still quite depressed.

This week’s new jobless claims continued to decline further below 800,000, and continued claims also made a new pandemic low.

On a non-seasonally adjusted basis, new jobless claims declined by 28,354 to 732,223. This would be a new pandemic low, except October 3’s number was revised to 731,249. Seasonally adjusted claims declined by 40,000 to 751,000, a new pandemic low. The 4 week moving average also decreased by 25,000 to 787,250, also a new pandemic low: 


Here is a close-up of the last three months since the end of July highlighting the slower progress in initial claims since then:


Continuing claims (which lag initial claims typically by a few weeks to several months) on a non-adjusted basis declined by 662,405 to 7,422,454. With seasonal adjustment they declined by 709,000 to 7,756,000. Both of these are new pandemic lows:


Continuing claims are now about 2/3’s below their worst level from the beginning of May, but are still about 1 million higher than their worst levels during the Great Recession.

Generally the situation with layoffs has continued to improve at a slow pace. This is of a piece with the same slow continued improvement in most of the “weekly indicators” I update each Saturday. But with infections setting new daily highs, and hospitalizations also rising, even before the onset of winter, I am concerned - and indeed expect - that jobless claims will start to rise again in the next 1 - 2 months.

Wednesday, October 28, 2020

Coronavirus dashboard for October 27: The EU is now worse than the US


 - by New Deal democrat

Total US confirmed infections: 8,777,432*
Average US infections last 7 days: 71,833 (new record high)
Total US deaths: 226,695
Average US deaths last 7 days: 806 (vs. recent low of 689 11 days ago)

*I suspect the real number is about 15,000,000, or 4.5% of the total US population
Source: COVID Tracking Project

The pandemic is once again raging out of control in parts of the country, and it is likely to be far worse over the winter months. 


Let’s start today by comparing the US with the EU countries plus Canada.


While in Canada the virus is still under control, on average, the EU is seeing nearly twice as many daily infections per capita as the United States:


The EU is at parity with the US now in terms of deaths, and that can be expected to rise further as well:


Here are new infections and deaths per capita for the US as a whole:


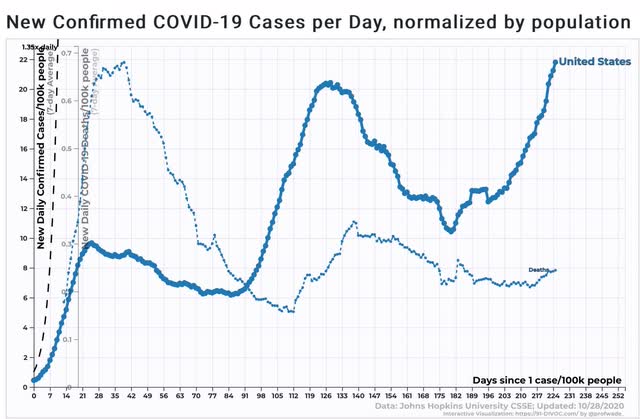
Although the infection rate is worse than ever, because of either a change in the demographics of those infected (younger vs. old people) and/or better medical treatments, the death rate is nowhere near what it was early in the pandemic.

The two worst States for both infections and deaths are North and South Dakota, shown below:


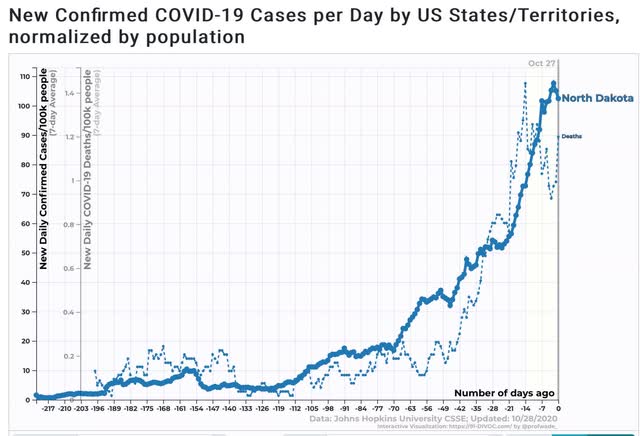
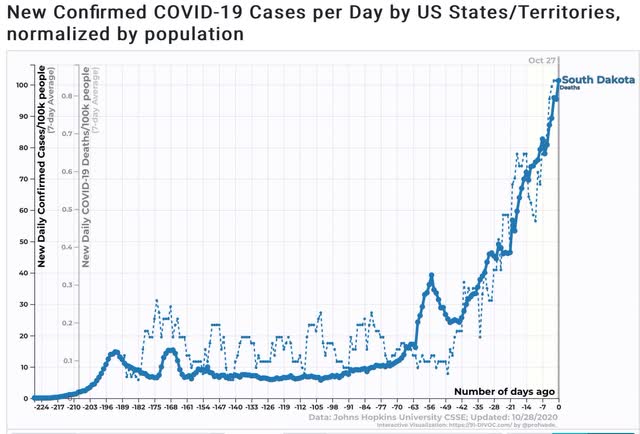
Again, the death rate is nowhere near that of NY or NJ early in the pandemic.

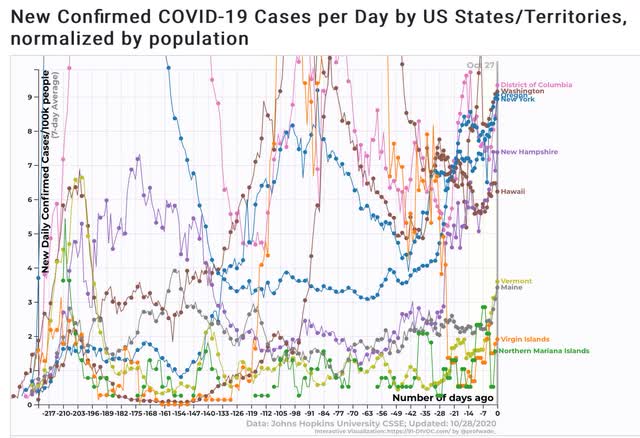
Turning to the bottom 10 US jurisdictions, the infection rate has recently been rising in all of them except for some Pacific islands and the three States of northern New England:


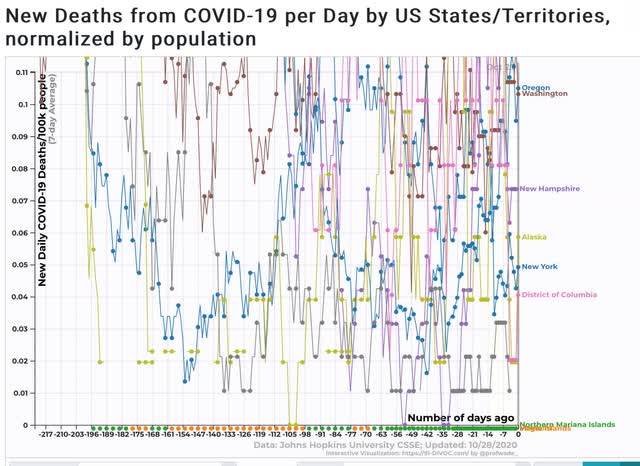
The same is true of the bottom 10 US jurisdictions for deaths - although again this is not a “bad” death rate compared with earlier in the pandemic, or compared to other States and countries:


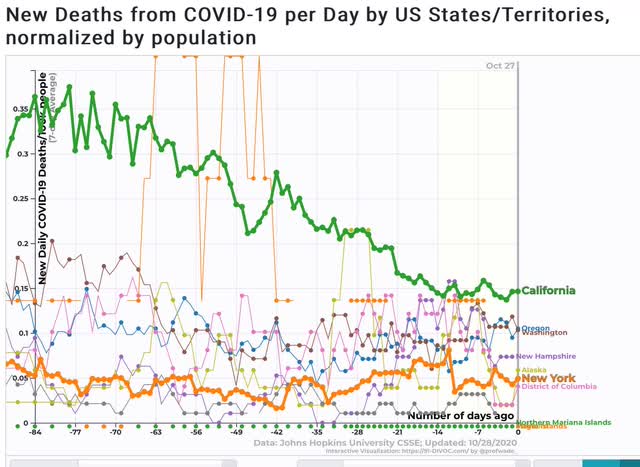
Finally, New York is still in the bottom 10 for per capita infections, and California just above - but both show recent increases:


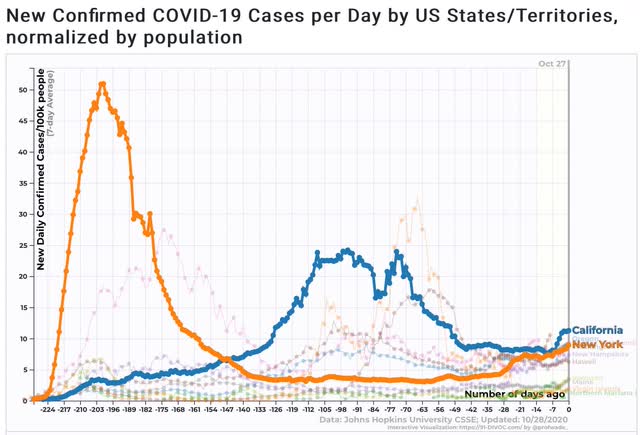
In terms of deaths, New York is still doing well, and California is still slowly declining - although that may change with the recent uptick in infections there: