- by New Deal democrat
It was a sparse week for significanlt monthly data. Consumer sentiment, both as to the present and the future, returned to their pre debt debacle levels as measured by the University of Michigan. Gallup's daily survey has shown some improvement but not nearly back to pre-July levels. Meanwhile, both import and export prices declined significantly, suggesting that inflation may be beginning to recede.
Asice from Oil, the high frequency weekly indicators generally had another positive week, although housing was a little soft and money supply receded.
Starting with jobs, the BLS reported that Initial jobless claims fell 7,000 to 390,000. Only 3 weeks in the last 3 years have been lower. The four week average declined to 400,000. The four week average remains close to its best reading in over 3 years.
The American Staffing Association Index remained at 91 last week. In the last couple of months, this series has resumed a slight upward trajectory, but remains lower YoY.
Tax withholding was up slightly YoY. Adjusting +1.07% due to the 2011 tax compromise, the Daily Treasury Statement showed that for the last 20 days throught November 9, $132.9 B was collected vs. $130.2 a year ago, a gain of $2.7 B or 2.0%.
Housing indicators declined slightly. The Mortgage Bankers' Association reported that seasonally adjusted purchase mortgage applications increased 4.8% last week. On a YoY basis, purchase applications were down -2.5%. Despite the decline, this remains back in the range that purchases mortgage applications have had been in for the 15 months before September. Refinancing rose 12.1% w/w. Refinancing has been very volatile and affected by small changes in interest rates.
Meanwhile, YoY weekly median asking house prices from 54 metropolitan areas at Housing Tracker showed that the asking prices declined -0.9% YoY. The areas with YoY% increases in price increased by four to a new high of 19. The areas with double-digit YoY% declines decreased back to 2. One third of all metropolitan areas in this survey now have YoY positive changes in asking prices.
Retail same store sales were strongly or tepidly positive depending on the reporting source. The ICSC reported that same store sales for the week of November 5 increased 2.7% YoY, and 1.0% week over week. Shoppertrak reported that YoY sales rose 3.7% YoY and were up 8.5% week over week.
Weekly BAA commercial bond rates decreased .25% to 5.11%. contrarily, yields on 10 year treasury bonds fell .21% to 2.07%. This is the fifth week in a row of decreasing spreads between the two rates, a good sign, inconsistent with an ongoing recession.
The American Association of Railroads reported that total carloads increased 3.5% YoY, up about 18,000 carloads YoY to 537,700. Intermodal traffic (a proxy for imports and exports) was up 8000 carloads, or 3.5% YoY. The remaining baseline plus cyclical traffic increased 9800 carloads or 3.4% YoY. Total rail traffic has improved substantially in the last month after having turned negative for 6 of 12 weeks during the summer.
Money supply continues to recede from its Euro crisis induced tsunami. M1 declined anoother -1.1% last week. It is now completely flat m/m but remains up 20.0% YoY, so Real M1 remains up 16.1%. M2 also declined another -3/7% w/w. It remained up 0.3% m/m, and 9.9% YoY, so Real M2 was up 6.0%. The YoY increase in both M1 and M2 remains near historic high levels. Despite the news out of Italy and Greece, this still may reflect a return of some confidence as to the Euro situation.
Finally, the Oil choke collar engaged after just a few weeks of relatively good news. Oil closed over $99 a barrel on Friday. This is back above the recession-trigger level calculated by analyst Steve Kopits. Gas at the pump declined $.03 to $3.42 a gallon. Measured this way, we probably are still about $.15 above the 2008 recession trigger level. Gasoline usage is once again off substantially, down -4.3% YoY, at 8671 M gallons vs. 9056 M a year ago. The 4 week moving average is off 5.5%. This is the steepest YoY drop yet in that average, and may be evidence that consumers have permanently altered their gasoline usage habits towards more conservation.
The coincident and short leading part of the high frequency indicators (jobs related, retail sales, rail traffic, and commercial bonds) have strongly rebounded from their brief contraction a couple of months ago. There is simply no recession or even a stall in these numbers. The decline in the longer leading indicators, however -- mortgages, money supply, and Oil -- is troublesome.
Have a nice weekend.
Saturday, November 12, 2011
Friday, November 11, 2011
The Liquidity Trap Seen From the Borrower's Perspective
Over the last week, I've taken an in-depth look at the latest senior loan officer survey (see here, here, here and here). These posts have helped to explain the overall liquidity trap situation from the borrower's perspective. Put another way, this analysis explains why record low interest rates aren't creating booming growth; there is simply very little loan demand right now.
Consider the following charts:
The only people making commercial and industrial loans are the largest 100 banks.
 The smaller banks are getting out of the C and I loan business -- at least for now. My guess is the 100 largest banks are only dealing with the largest borrowers.

Consider the following charts:
The only people making commercial and industrial loans are the largest 100 banks.


Moving on to the consumer, we're seeing households cutting back on overall debt:


The financial services obligation ratio tells us the households are still cutting back on debt, which is evidence from the slight drop in household debt outstanding.

Finally, commercial real estate is in terrible shape, meaning no one in this area of the economy is borrowing either.
Simply put, there is little overall borrowing demand right now.
Thursday, November 10, 2011
Senior Loan Survey: Commercial Lending
Finally, in looking at the latest senior loan survey, let's take a look at commercial lending:
 First, note that most respondents are not tightening lending standard -- although they are already at their tightest levels in over 5 years. At the same time, loan demand while slightly positive, is dropping.
And consider the above numbers in relation to this chart of total construction spending:

Overall there is simply very little commercial loan demand right now.
Domestic banks continued to report little change in their standards on CRE loans, which were widely described in a special question in the previous survey as being at or near their tightest levels since 2005. In contrast, a large fraction of foreign respondents reported having tightened standards on CRE loans, in a substantial shift from the net easing reported by those institutions in the prior two surveys. Modest fractions of domestic and foreign banks reported a strengthening of demand for CRE loans, on net, although these reports were a bit less widespread than in the two previous surveys.Commercial real estate is still in the doldrums, which is understandable considering the sorry state of US real estate overall. Let's move onto a few data points.

And consider the above numbers in relation to this chart of total construction spending:

Overall there is simply very little commercial loan demand right now.
Morning Market


On the ETFs of all the major averages, notice that prices have broken uptrends and are now standing at or near very important technical support levels at prices established several months ago. Also note that prices are simply consolidating/meandering sideways. Traders are still waiting for ... something. No one will know until we see it; but a catalyst is needed to definitively move in one direction or the other.

After bouncing along the long-term trend line, gold prices have started to move higher in an upward sloping channel. The EMAs are all moving higher and the shorter EMAs are above the longer. Prices are advancing and retreating in a good, disciplined manner, allowing traders to take profits and giving new entrants a place to enter.
Senior Loan Survey: Consumer Loans
When looking at consumer credit, it's important to remember the backdrop against which we're looking at the data.

Consumers are slowing their borrowing in a big way, indicating an overall lack of demand. This is also reflected in

The chart for total consumer debt outstanding
From the Federal Reserve
Let's take a look at the data from the bank's perspective:

The first chart shows the percentage of banks tightening lending standards for consumer loans. Notice this number has been below 0 for a small amount of time and has been decreasing since the tightening caused by the recession. However, the second chart shows a smaller number of institutions willing to make the loans (although the number is still positive). The lower graph shows the percentage of banks that are seeing an increase in consumer loan demand increasing. The net takeaway from the above charts is that consumer loan demand is starting to pick-up a bit.

Consumers are slowing their borrowing in a big way, indicating an overall lack of demand. This is also reflected in

The chart for total consumer debt outstanding
From the Federal Reserve
Modest fractions of banks reported having eased standards on consumer credit card loans and on other non-auto loans. As in the previous survey, somewhat larger fractions of banks reported having eased standards on auto loans.
Banks, on net, continued to report having narrowed the spreads of interest rates on auto loans over their cost of funds, though these reports have been volatile over the past few quarters. A modest net fraction of banks also reported lengthening maximum maturities and lowering minimum required credit scores on auto loans. Small numbers of banks reported having eased some terms on credit card loans.
A small number of banks, on net, reported a strengthening of demand for consumer credit card and auto loans, in line with the past few quarters. Banks reported small, mixed changes, on net, in the demand for other types of consumer loans.
Let's take a look at the data from the bank's perspective:

The first chart shows the percentage of banks tightening lending standards for consumer loans. Notice this number has been below 0 for a small amount of time and has been decreasing since the tightening caused by the recession. However, the second chart shows a smaller number of institutions willing to make the loans (although the number is still positive). The lower graph shows the percentage of banks that are seeing an increase in consumer loan demand increasing. The net takeaway from the above charts is that consumer loan demand is starting to pick-up a bit.
Oil's In the Middle of A Nice Rally

Apologies From Texas
Last night, the country learned with absolute certainty what we in Texas have known for some time: our governor is a MORON. On behalf of my state, I apologize for subjecting the country to this vision of ineptitude.
Morning Market

Yesterday, we saw prices move through support, rally into what was support (and is now resistance) and then sell-off to levels established last week.

If we look at the riskier markets we see a stronger sell-off and move overall volatility.

In contrast, we did see the Treasury market move higher, but not by much.

In fact, if we take a closer look at the daily chart we see a very weak candle on low volume. While prices did move through important technical areas (104.6) they didn't really move much higher.

In fact, if we look at the long end of the Treasury market, we see that prices didn't move through the 119.25/119.50 area which would indicate a new move higher.
I would expect the equity markets to continue moving a touch lower; the fundamental background is still negative and the SPYs, IWMs and QQQs all printed negative days on higher volume. In addition, all three are between their respective 10 and 20 day EMAs, so the 20 day is a natural downside target. However, the lack of strong upward movement in the treasury market means traders will be looking for other assets for their safety play. What's probably keeping the rally in check is the higher inflation we're seeing, which already means the yield on the 10-year is negative.
Wednesday, November 9, 2011
Bonddad Linkfest
- German growth is projected to slow next year
- Italy borrowing costs reach breaking point
- IEA warns on energy policy
- Chinese inflation eases
- Fed hawks ask for more policy guidance from the Fed
- US job openings increase
- China's home sales fall by 25%
- Why are soybean prices low?
- JOLTs survey released
- Let banks fail

Senior Loan Survey: Residential Lending
Let's now look at the residential lending loan market, which the latest Fed lending survey described thusly:
Put another way, there was a slight bump in residential mortgage demand which was probably caused by refinancing activity -- a natural result of very low interest rates.
Let's take a look at the supply and demand data:

The chart on the left shows that demand has actually been weaker for quite some time (Remember -- this is a banking survey; there are many non-bank lenders in the residential mortgage business). The chart on the right shows the last three years of activity, which has also been weak.

The chart on the left shows the huge tightening in lending standards that started as it appeared the housing bubble was bursting. The chart on the right shows the tightening spike, but also that lenders are no longer tightening. That does not mean there has been a loosening of standards -- just that no more lenders are making it harder to get a loan.
What these charts show is there consumer demand is weak -- a conclusion that jibes with the continued drop in the various financial obligation ratios published by the Fed and this chart, which shows total residential mortgage debt outstanding:

Reports of strengthened demand for mortgage loans to purchase homes outnumbered reports of weaker demand for the first time since early 2010, perhaps reflecting refinancing activity.5 The number of banks reporting weaker demand for home equity lines of credit increased in the third quarter, particularly among smaller banks.
Few banks reported changes in standards on prime or nontraditional closed-end residential real estate loans, in line with the past several surveys. Similarly, very few banks reported any change in standards for home equity lines of credit, also in line with recent surveys.
Put another way, there was a slight bump in residential mortgage demand which was probably caused by refinancing activity -- a natural result of very low interest rates.
Let's take a look at the supply and demand data:

The chart on the left shows that demand has actually been weaker for quite some time (Remember -- this is a banking survey; there are many non-bank lenders in the residential mortgage business). The chart on the right shows the last three years of activity, which has also been weak.

The chart on the left shows the huge tightening in lending standards that started as it appeared the housing bubble was bursting. The chart on the right shows the tightening spike, but also that lenders are no longer tightening. That does not mean there has been a loosening of standards -- just that no more lenders are making it harder to get a loan.
What these charts show is there consumer demand is weak -- a conclusion that jibes with the continued drop in the various financial obligation ratios published by the Fed and this chart, which shows total residential mortgage debt outstanding:

Morning Market

The 10 day chart shows the large price drop at the beginning of last week when Greece announced they would put austerity measures to a vote. Since then, prices have been in a slight uptrend. However, price are still below highs set a week and a half ago.

The daily chart shows that prices are consolidating around the 200 day EMA. The shorter EMAs are all rising. The 10 day has crossed over the 200 day EMA and the 20 is about to do so. Prices are also using the EMAs as technical support. In short, this chart has some good, underlying bullish developments. Recent action is really more a pause than anything else.

The treasury market gapped higher last week in reaction to the Greek situation. However, for the last week prices have been moving sideways, consolidating just above the EMAs. And while the EMAs are moving higher, they are tightly inter-twined, indicating a lack of conviction on the part of traders. This chart also looks like treasury traders are pausing, waiting to see what the next developments are.

The dollar has consolidated just below the 200 day EMA. Prices are currently entangled with the EMAs and all the shorter EMAs are moving sideways and are intertwined.
All of these charts add up to one conclusion: the markets are pausing. The Greek vote decision threw a huge wrench into a very tense situation -- one that was not needed especially considering that it appears the EU situation was resolved. Now traders are relieved that the Greek situation has been somewhat resolved but they are still concerned about the overall economic picture.
Tuesday, November 8, 2011
Bonddad Linkfest
Yesterday, for reasons that I don't know, the links did not work. Sorry about that, folks. I've tested these to your wonkish content.
- Bruce Bartlett on Fed Policy
- German exports rise .9%
- Italy on the interest rate brink
- Consumer credit up, but...
- Credit standards to European banks tightening
- German slowdown likely to lead to EU recession
- New poverty measure paints bleaker picture
- France unveils 5-year budget plan
- Russia on course to overcome grain shortfall
- Banks are flush with cash
This is What Happens When You Don't Spend on Infrastructure
From the FT:
Rows of cargo containers clutter the tarmac outside an overflowing warehouse at Jakarta’s airport where there are not enough landing slots for all the planes. The chaotic scene offers the most graphic illustration of how strong economic expansion is straining Indonesia’s worn out infrastructure just as it emerges, once again, as a regional power.
The young democracy of 240m may be booming, but the situation at the capital’s airport epitomises one of the biggest problems holding back south-east Asia’s largest economy: its roads, ports, power plants and bridges have fallen far behind its needs because of years of government underspending.
Senior Loan Office Survey, C and I Loans
Yesterday, the Federal Reserve released the senior loan officer survey. This is a very important document as it provides extensive detail about the condition of US lending.
Why is this information important? The primary reason the Fed has lowered interest rates to barely positive is to spur lending. However, if businesses aren't borrowing -- or if banks aren't lending -- than this policy won't be nearly as effective.
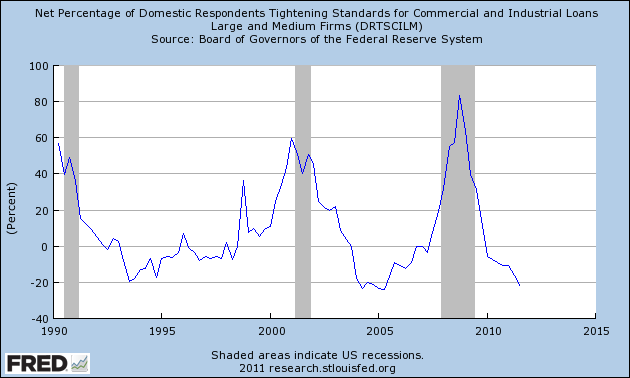
Let's start by looking at the commercial an industrial section of the report.
 Above is a chart of the overall responses. The vast majority of respondents didn't change their overall standards. Let's place these numbers in historical context.

Since the worst parts of the recession, we've seen an overall loosening of lending standards on large C and I borrowers. Current levels are near the lows of the preceding two expansions.
But these reponses are for larger borrowers -- what about for smaller borrowers?

Here, again, we see a general unchanged situation.
Let's place these numbers in historical context

Like the chart for loans to larger borrowers, the number of institutions tightening lending standards to smaller firms is also dropping.
Let's see how this is playing out in the total number of C and I loans that have been extended.

After taking a serious nosedive during and slightly after the recession, the total number of C and I loans is increasing.

However, it's not the smaller banks that are making the loans, but

The largest 100.
Why is this information important? The primary reason the Fed has lowered interest rates to barely positive is to spur lending. However, if businesses aren't borrowing -- or if banks aren't lending -- than this policy won't be nearly as effective.
Let's start by looking at the commercial an industrial section of the report.
Regarding lending standards, fewer domestic banks eased standards and terms on commercial and industrial (C&I) loans over the third quarter compared with recent quarters, particularly on loans to large and middle-market firms.2 About one-fourth of foreign respondents, which primarily lend to businesses, reported that they had tightened lending standards on C&I loans.3 All of the domestic and foreign respondents that reported having tightened standards or terms on C&I loans cited a less favorable or more uncertain economic outlook as a reason for the tightening. In response to a special question, a large number of both domestic and foreign respondents indicated that they had tightened standards on loans to European banks and their affiliates or subsidiaries. Standards for commercial and residential real estate loans changed little over the past three months, and a small net fraction of banks indicated that they had eased standards on several types of consumer loans.Let's place the above statements in context.
According to the survey, changes in loan demand were mixed. A moderate net fraction of banks reported weaker demand for C&I loans, in contrast to the increased demand reported in the previous three surveys; however, some large domestic banks continued to report stronger demand.4 Several large banks also reported increased demand for commercial real estate (CRE) loans. On the household side, demand for loans to purchase homes reportedly increased, though those reports may reflect the moderate rise in refinancing activity. Demand for home equity loans decreased, and demand for consumer loans reportedly was little changed.

Since the worst parts of the recession, we've seen an overall loosening of lending standards on large C and I borrowers. Current levels are near the lows of the preceding two expansions.
But these reponses are for larger borrowers -- what about for smaller borrowers?

Here, again, we see a general unchanged situation.
Let's place these numbers in historical context

Like the chart for loans to larger borrowers, the number of institutions tightening lending standards to smaller firms is also dropping.
Let's see how this is playing out in the total number of C and I loans that have been extended.

After taking a serious nosedive during and slightly after the recession, the total number of C and I loans is increasing.

However, it's not the smaller banks that are making the loans, but

The largest 100.
Market Monday

Today I wanted to start with oil, which I haven't covered in a bit. This market is starting to look very strong. Prices are in a clear uptrend and have been since the beginning of October. Prices have moved through the 10, 20 50 and 200 day EMA. The shorter EMAs are moving higher with the 10 crossing the 200 recently. Prices became entangled with the 200 day EMA a week and a half ago, but are now above this EMA. Bottom line: this chart is looking bullish.

Copper formed a double bottom in October and has since moved higher. However, the shorter EMAs are now moving higher at a less steep angle. Prices have also become entangled with all the EMAs and have been moving sideways for the last week printing very small bars. While oil is showing an anticipation of recovery, copper is still waiting for further evidence.

Although the junk bond market dropped sharply a bit ago, it has since rebounded. Prices are now over the 200 day EMA and the shorter EMAs have all started to move higher with the 10 crossing over the 200.

The corporate bond market has also caught a strong bid, advancing strongly over the last few weeks. All the EMAs are moving higher and prices have moved through important resistance levels. Also note that volume is slightly higher over the last week or so. The strength of the latest rally indicates a rush into safety.
Monday, November 7, 2011
Bonddad Linkfest
- Where gridlock meets politics
- A year before the elections, the mood is very dour
- Most of the unemployed no longer receiving benefits
- Junk bond market shows better times ahead
- Credit Unions Poach Clients
- Euro area retail sales from .7% in September
- German industrial production drops 2.7% in September
- Greek government reaches deal
- Sarkozy proposes another austerity budget
- Income mobility drops in the US
No Virgina, the CRA/GSE's Didn't Cause the Financial Crisis
One of the things that drives me nuts is when -- regardless of a point being thoroughly and completely dis-proven and debunked -- it still makes it's way into political discussion. Of course, most of the time these things pop up (the world isn't warming, evolution is only a theory) from some whack-job who can't handle the complexity of the modern world, and instead pines for a simpler idealized day (which of course, never really existed, but that doesn't stop them from thinking it existed). Or, they're just plain stupid. Either way, it's an attempt to obfuscate the basic data in furtherance of some meme.
Case in point: the CRA caused the melt-down. I love this theory. Never mind that the CRA was passed 25 years prior to the melt-down (that's one hell of a delayed reaction), nor the fact that real estate bubbles popped up all over the world (did Spain also have a CRA?) No -- these objective data points are not relevant! All government is bad, so the CRA is bad and that's that.
Thanks to Barry over at the Big Picture, we have a really nice explanation/takedown of this moronic talking point. Let's start with Barry's column from the Washington Post. Barry's done this thing called research, or "diligent and systematic inquiry or investigation into a subject in order to discover or revise facts, theories, applications." He's written a thing called a book. Be careful, as the results are nuanced (a subtle difference or distinction in expression, meaning, response). Here is the chain of events from Barry's Washington Post column:
Then, of course, there is this report from the Minneapolis Federal Reserve and this from the Washington Fed.
So -- if you still believe that -- despite the overwhelming body of factual data listed above -- that the CRA and GSEs caused the financial meltdown, you are formally admitting that
Case in point: the CRA caused the melt-down. I love this theory. Never mind that the CRA was passed 25 years prior to the melt-down (that's one hell of a delayed reaction), nor the fact that real estate bubbles popped up all over the world (did Spain also have a CRA?) No -- these objective data points are not relevant! All government is bad, so the CRA is bad and that's that.
Thanks to Barry over at the Big Picture, we have a really nice explanation/takedown of this moronic talking point. Let's start with Barry's column from the Washington Post. Barry's done this thing called research, or "diligent and systematic inquiry or investigation into a subject in order to discover or revise facts, theories, applications." He's written a thing called a book. Be careful, as the results are nuanced (a subtle difference or distinction in expression, meaning, response). Here is the chain of events from Barry's Washington Post column:
1.) Fed Chair Alan Greenspan dropped rates to 1 percent — levels not seen for half a century — and kept them there for an unprecedentedly long period. This caused a spiral in anything priced in dollars (i.e., oil, gold) or credit (i.e., housing) or liquidity driven (i.e., stocks).For those of you that want to switch the argument to "the GSEs" caused the market, here is another complete and thorough refutation from Barry's Blog:
2.) Low rates meant asset managers could no longer get decent yields from municipal bonds or Treasurys. Instead, they turned to high-yield mortgage-backed securities. Nearly all of them failed to do adequate due diligence before buying them, did not understand these instruments or the risk involved. They violated one of the most important rules of investing: Know what you own.
3.) Fund managers made this error because they relied on the credit ratings agencies — Moody’s, S&P and Fitch. They had placed an AAA rating on these junk securities, claiming they were as safe as U.S. Treasurys.
4.) Derivatives had become a uniquely unregulated financial instrument. They are exempt from all oversight, counter-party disclosure, exchange listing requirements, state insurance supervision and, most important, reserve requirements. This allowed AIG to write $3 trillion in derivatives while reserving precisely zero dollars against future claims.
5.) The Securities and Exchange Commission changed the leverage rules for just five Wall Street banks in 2004. The “Bear Stearns exemption” replaced the 1977 net capitalization rule’s 12-to-1 leverage limit. In its place, it allowed unlimited leverage for Goldman Sachs, Morgan Stanley, Merrill Lynch, Lehman Brothers and Bear Stearns. These banks ramped leverage to 20-, 30-, even 40-to-1. Extreme leverage leaves very little room for error.
6.) Wall Street’s compensation system was skewed toward short-term performance. It gives traders lots of upside and none of the downside. This creates incentives to take excessive risks.
7.) The demand for higher-yielding paper led Wall Street to begin bundling mortgages. The highest yielding were subprime mortgages. This market was dominated by non-bank originators exempt from most regulations. The Fed could have supervised them, but Greenspan did not.
8.) These mortgage originators’ lend-to-sell-to-securitizers model had them holding mortgages for a very short period. This allowed them to get creative with underwriting standards, abdicating traditional lending metrics such as income, credit rating, debt-service history and loan-to-value.
9.) “Innovative” mortgage products were developed to reach more subprime borrowers. These include 2/28 adjustable-rate mortgages, interest-only loans, piggy-bank mortgages (simultaneous underlying mortgage and home-equity lines) and the notorious negative amortization loans (borrower’s indebtedness goes up each month). These mortgages defaulted in vastly disproportionate numbers to traditional 30-year fixed mortgages.
10.) To keep up with these newfangled originators, traditional banks developed automated underwriting systems. The software was gamed by employees paid on loan volume, not quality.
11.) Glass-Steagall legislation, which kept Wall Street and Main Street banks walled off from each other, was repealed in 1998. This allowed FDIC-insured banks, whose deposits were guaranteed by the government, to engage in highly risky business. It also allowed the banks to bulk up, becoming bigger, more complex and unwieldy.
12.) Many states had anti-predatory lending laws on their books (along with lower defaults and foreclosure rates). In 2004, the Office of the Comptroller of the Currency federally preempted state laws regulating mortgage credit and national banks. Following this change, national lenders sold increasingly risky loan products in those states. Shortly after, their default and foreclosure rates skyrocketed.
1. Private markets caused the shady mortgage boom: The first thing to point out is that the both the subprime mortgage boom and the subsequent crash are very much concentrated in the private market, especially the private label securitization channel (PLS) market. The Government-Sponsored Entities (GSEs, or Fannie and Freddie) were not behind them. The fly-by-night lending boom, slicing and dicing mortgage bonds, derivatives and CDOs, and all the other shadiness of the mortgage market in the 2000s were Wall Street creations, and they drove all those risky mortgages.For further complete and total dedunking, there are these two links (here and here)
Here’s some data to back that up: “More than 84 percent of the subprime mortgages in 2006 were issued by private lending institutions… Private firms made nearly 83 percent of the subprime loans to low- and moderate-income borrowers that year.”
As Center For American Progress’s David Min pointed out to me, the timing doesn’t work at all: “But from 2002-2005, [GSEs] saw a fairly precipitous drop in market share, going from about 50% to just under 30% of all mortgage originations. Conversely, private label securitization [PLS] shot up from about 10% to about 40% over the same period. This is, to state the obvious, a very radical shift in mortgage originations that overlapped neatly with the origination of the most toxic home loans.”
2. The government’s affordability mission didn’t cause the crisis: The next thing to mention is that the “affordability goals” of the GSEs, as well as the Community Reinvestment Act (CRA), didn’t cause the problems. Randy Krozner summarized one of the better studies on this so far, finding that “the very small share of all higher-priced loan originations that can reasonably be attributed to the CRA makes it hard to imagine how this law could have contributed in any meaningful way to the current subprime crisis.” The CRA wasn’t nearly big enough to cause these problems.
I’d recommend checking out “A Closer Look at Fannie Mae and Freddie Mac: What We Know, What We Think We Know and What We Don’t Know“ by Jason Thomas and Robert Van Order for more on the GSEs’ goals, which, in addition to explaining how their affordability mission is a distraction, argues that subprime loans were only 5 percent of the GSEs’ losses. The GSEs also bought the highly rated tranches of mortgage bonds, for which there was already a ton of demand.
3. There is a lot of research to back this up and little against it: This is not exactly an obscure corner of the wonk world — it is one of the most studied capital markets in the world. What has other research found on this matter? From Min:
Did Fannie and Freddie buy high-risk mortgage-backed securities? Yes. But they did not buy enough of them to be blamed for the mortgage crisis. Highly respected analysts who have looked at these data in much greater detail than Wallison, Pinto, or myself, including the nonpartisan Government Accountability Office, the Harvard Joint Center for Housing Studies, the Financial Crisis Inquiry Commission majority, the Federal Housing Finance Agency, and virtually all academics, including the University of North Carolina, Glaeser et al at Harvard, and the St. Louis Federal Reserve, have all rejected the Wallison/Pinto argument that federal affordable housing policies were responsible for the proliferation of actual high-risk mortgages over the past decade.
The other side has virtually no research conducted that explains their argument, with one exception that I’ll cover below.
4. Conservatives sang a different tune before the crash: Conservative think tanks spent the 2000s saying the exact opposite of what they are saying now and the opposite of what Bloomberg said above. They argued that the CRA and the GSEs were getting in the way of getting risky subprime mortgages to risky subprime borrowers.
My personal favorite is Cato’s “Should CRA Stand for ‘Community Redundancy Act?’” from 2000 (here’s a write-up by James Kwak), which argues a position amplified in its 2003 Handbook for Congress financial deregulation chapter: “by increasing the costs to banks of doing business in distressed communities, the CRA makes banks likely to deny credit to marginal borrowers that would qualify for credit if costs were not so high.” Replace “marginal” with Bloomberg’s “on the cusp” and you get the same idea.
Bill Black went through what AEI said about the GSEs during the 2000s and it is the same thing — that they were blocking subprime loans from being made. In the words of Peter Wallison in 2004: “In recent years, study after study has shown that Fannie Mae and Freddie Mac are failing to do even as much as banks and S&Ls in providing financing for affordable housing, including minority and low income housing.”
5. Expanding the subprime loan category to say GSEs had more exposure makes no sense: Some argue that the GSEs had huge subprime exposure if you create a new category that supposedly represents the risks of subprime more accurately. This new “high-risk” category is associated with a consultant to AEI named Ed Pinto, and his analysis deliberately blurs the wording on “high-risk” and subprime in much of his writings. David Min broke down the numbers, and I wrote about it here. Here’s a graphic from Min’s follow-up work, addressing criticism:
Even this “high risk” category isn’t risky compared to subprime and it looks like the national average. When you divide it by private label, the numbers are even worse. Private label loans “have defaulted at over 6x the rate of GSE loans, as well as the fact that private label securitization is responsible for 42% of all delinquencies despite accounting for only 13% of all outstanding loans (as compared to the GSEs being responsible for 22% of all delinquencies despite accounting for 57% of all outstanding loans).” The issue isn’t this fake “high risk” category, it is subprime and private label origination.
The Financial Crisis Inquiry Commission (FCIC) panel looked carefully at this argument and also ended up shredding it. So even those who blame the GSEs can’t get the numbers to work when they make up categories.

Then, of course, there is this report from the Minneapolis Federal Reserve and this from the Washington Fed.
So -- if you still believe that -- despite the overwhelming body of factual data listed above -- that the CRA and GSEs caused the financial meltdown, you are formally admitting that
- you are stupid,
- you are a dolt,
- you are a moron,
- you are a trained seal who claps and barks when the appropriate words and phrases are uttered,
- Your grandparents were closely related, they had multiple male and female children who inter-married and you are their offspring
- You are proof that lobotomies are still conducted on a regular basis
- You have sniffed more glue than should be humanly possible
- Look -- there's a black helicopter (I thought they only flew at night....)!
- That evolution may be working backwards
- Contact sports require head gear
Morning Market

On the SPY's notice that since the arrow, the vast majority of the bodies have been small -- indicating there is a small difference between the opening and the closing prices. Last week shows an especially sharp example with a few gaps but very little intra-day action.

In contrast, the IWMs show a bit more intra-day volatility, but again, over the last week, the bodies are all very small, indicating a lack of conviction on the part of the bulls or the bears.

Finally, notice the QQQs have been moving sideways for a little under a month.

On the year-long chart of the SPYs, prices have hit the 61.8% Fib level (right around 126), which is also an important technical level established earlier this year. Prices are fluctuating around the 200 day EMA, but there really is little direction overall. Instead, we see a lot of sideways price action.
Subscribe to:
Posts (Atom)