Saturday, May 4, 2019
Weekly Indicators for April 29 - May 3 at Seeking Alpha
- by New Deal democrat
My Weekly Indicators post is up at Seeking Alpha.
The trend in the past couple of months across all timeframes has been very much to the positive. It is either a signal of a renewed boom, or else a countertrend bounce back from the December-January government shutdown + residual seasonality due to a late Easter. Because I do not think that the tail wags the dog, my vote is for the latter.
But I report, you decide!
Friday, May 3, 2019
April jobs report: great headlines, signs of fraying around the edges
- by New Deal democrat
HEADLINES:
- +263,000 jobs added
- U3 unemployment rate declined -0.2% to 3.6% (new expansion low)
- U6 underemployment rate unchanged at 7.3%
Leading employment indicators of a slowdown or recession
I am highlighting these because many leading indicators overall strongly suggest that an employment slowdown is coming. The following more leading numbers in the report tell us about where the economy is likely to be a few months from now. These were strongly positive on a m/m basis, but several showed deceleration YoY.
- the average manufacturing workweek was unchanged at 40.7 hours. This is one of the 10 components of the LEI. It is down -0.6 hours from its peak during this expansion.
- Manufacturing jobs rose by 4,000. YoY manufacturing is up 204,000, a big deceleration from last summer’s pace.
- construction jobs rose by 33,000. YoY construction jobs are up 256,000, also a big deceleration from last summer. Residential construction jobs, which are even more leading, however, actually declined by -2500, a signal that the housing slowdown from last year has finally bled through into jobs.
- temporary jobs rose strongly by 17,900. YoY these are up +53,500.
- the number of people unemployed for 5 weeks or less declined by -222,000 from 2,126,000 to 1,904,000. This is a new post-recession low.
Wages and participation rates
Here are the headlines on wages and the broader measures of underemployment:
Here are the headlines on wages and the broader measures of underemployment:
- Not in Labor Force, but Want a Job Now: declined by -106,000 from 5.227 million to 5.121 million
- Part time for economic reasons: rose by 155,000 from 4.499 million to 4.654 million
- Employment/population ratio ages 25-54: down -0.1% from 79.8% to 79.7%
- Average Hourly Earnings for Production and Nonsupervisory Personnel: rose $.07 from $23.24 to $23.31, up +3.4% YoY. (Note: you may be reading different information about wages elsewhere. They are citing average wages for all private workers. I use wages for nonsupervisory personnel, to come closer to the situation for ordinary workers.)
Holding Trump accountable on manufacturing and mining jobs
Trump specifically campaigned on bringing back manufacturing and mining jobs. Is he keeping this promise?
Trump specifically campaigned on bringing back manufacturing and mining jobs. Is he keeping this promise?
- Manufacturing jobs rose an average of +4,000/month in the past year vs. the last seven years of Obama's presidency in which an average of +10,300 manufacturing jobs were added each month.
- Coal mining jobs declined by -400 for an average of +58/month in the past year vs. the last seven years of Obama's presidency in which an average of -300 jobs were lost each month
Other important coincident indicators help us paint a more complete picture of the present:
- Overtime was unchanged at 3.4 hours.
- Professional and business employment (generally higher-paying jobs) increased by 76,000 and is up 535,000 YoY. This has decelerated slightly from last year’s pace.
- the index of aggregate hours worked for non-managerial workers rose by 0.2%
- the index of aggregate payrolls for non-managerial workers rose by 0.5%
Other news included:
- the alternate jobs number contained in the more volatile household survey declined by -103,000 jobs. This represents an increase of 1,429,000 jobs YoY vs. 2,720,000 in the establishment survey. Further, the survey has been negative for three of the last four months. This is a major disconnect and, because the household survey has a tendency to turn first, is a definite concern.
- Government jobs rose by 27,000.
- the overall employment to population ratio for all ages 16 and up was unchanged at 60.6% m/m and is up 0.3% YoY.
- The labor force participation rate declined -0.2% from 63.0% to 62.8% and is unchanged YoY.
SUMMARY
There was another major disconnect between the headline jobs and unemployment numbers and the rest of the report.
Let me start with the additional good stuff. Temporary help and construction jobs rose stoutly, the former very much at odds with the private weekly data. Short term unemployment fell to a new low. Services employment in general was very strong. Aggregate hours and payrolls for non-supervisory workers rose strongly again.
Now, the negatives. Residential construction jobs declined. Involuntary part-time employment rose, a sign of some fraying at the edges. Both the labor force participation rate and the prime age employment to population ratio fell. In other words, the unemployment rate fell because there were fewer people in the labor force. But the biggest negative is the fact that employment as measured by the household report declined for the third time in four months, is down for the year, and is up only 63,000 for the past six months.
Note that this survey was taken during the week when we had record low new jobless claims. In the two weeks since, those have jumped. I suspect we may see some similar payback in next month’s jobs report as well. So while we can celebrate the good headline and wage numbers, there are substantial signs of fraying around the edges.
Thursday, May 2, 2019
Beware a blowout April jobs report
- by New Deal democrat
I just wanted to note this before tomorrow’s jobs report is released.
I suspect that, just as initial jobless claims were distorted for several weeks to the positive side due to residual seasonality due in turn to the very late date on which Easter fell this year, the jobs report will have the same issue. This is in large part to the jobs survey week being the 13th, which this year was the week before Easter, and gave us one of the two sub-200k initial claims numbers.
So, if tomorrow is a blowout, take it with an extra grain of salt. We’ll have to average it with the May report next month, which will include the weaker weeks after Easter.
Initial jobless claims back off lows, show apparent unresolved seasonality
- by New Deal democrat
On Sunday I said, “Were the two recent sub-200k readings [on initial jobless claims] a spasm of unresolved seasonality because Easter came so late this year? Or are they truly telling us that the economy is heating up again? If the former, I would expect another reading like the 230k reading we got last week.”
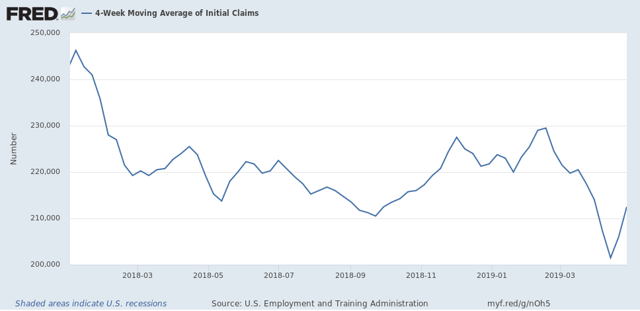
And this morning we got another exactly 230k reading. This strongly argues that there was indeed unresolved seasonality. The 4 week moving average of the two sub-200k readings and the 2 230k readings is a much truer signal, at 212,500:
I don’t normally bother with the non-seasonally adjusted numbers, but here is a look since January 1, 2018. I’ve marked the week after April 1, which was when Easter fell in 2018 vs. April 21 this year:
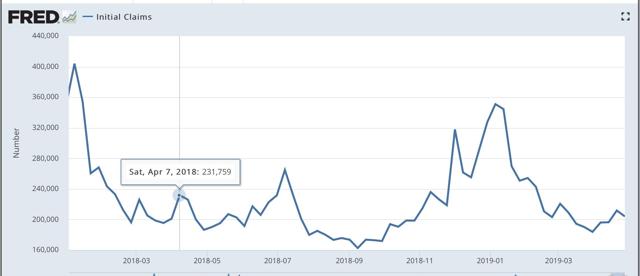
Note the low levels of layoffs in the several weeks before Easter vs. a slightly heightened level in the weeks just after. We’re seeing the same pattern this year - but with a three week delay.
Here is what the YoY% change in the 4 week average looks like:
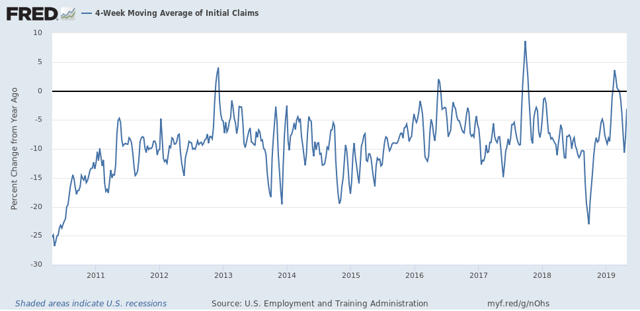
The current 4 week average is -3.1% less than it was 1 year ago. But it is still below 220,000+ average that we saw from November through mid-March. Since Easter was three weeks later this year, there is still one more week that might have some unresolved seasonality, so it’s possible we go back to 200,000 next week.
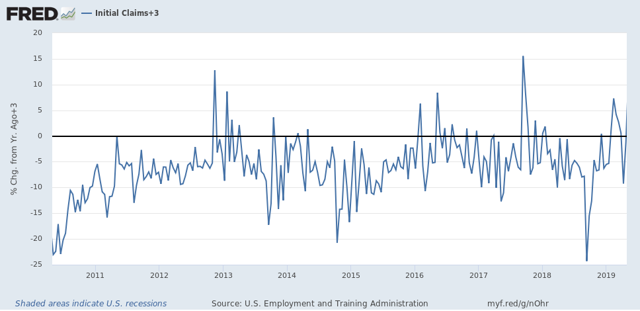
And here is a look at the YoY% change in non-seasonally adjusted claims, averaged biweekly to cut down on some of the noise. The last 6 weeks average to about -3% YoY, so I’ve added that so that it shows as 0, the better to compare with the last 9 years:
The spikes in late 2012 and late 2017 were hurricane-related. Aside from those, the period since December overall is the weakest since the 2016 “shallow industrial recession.”
As of now, both the 4 week seasonally adjusted view of Initial claims, and the non-seasonally adjusted view show us a picture of improving job security, but at a slow or decelerating rate.
Wednesday, May 1, 2019
Construction spending, manufacturing, and temp jobs all decelerate further or decline
- by New Deal democrat
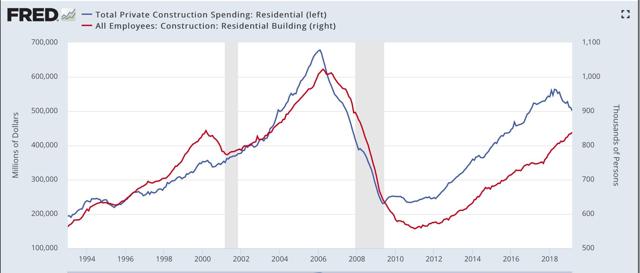
On Sunday I said, “Construction spending ... should follow housing permits and starts with a delay of several months. But, oddly, even though starts in particular have continued to languish, spending has come back strongly since last November. I’ll be looking to see if that anomaly continues, or whether construction spending reverts to its historical pattern.” I also wrote that “The Fed regional indexes have turned up in the last couple of months, so I am expecting [ISM manufacturing] to improve as well.”
Let’s take these in turn.
That anomalous increase in residential construction spending since last November got almost entirely erased in revisions, and it declined another -1.8% in March (blue in the graph below, compared with residential construction employment, red):
On a YoY basis, whenever residential construction spending has been this negative, residential construction employment has also declined:
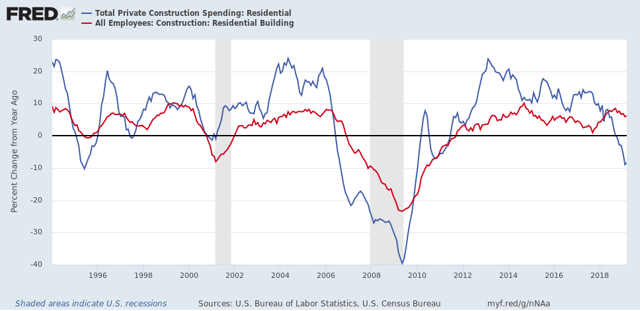
As of March, it hadn’t yet.
Turning to the ISM manufacturing report, it declined to 52.8, the lowest since October 2016. New orders fell to 51.7, the lowest level this year so far:
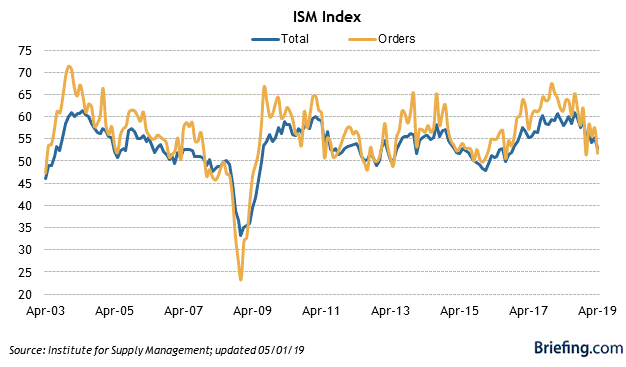
Employment also declined to 52.4, just above its recent low of 52.3 two months ago.
This is expansion, but not much.
By the way, yesterday the Staffing Index of the ASA for temporary jobs fell to -2.1% YoY:
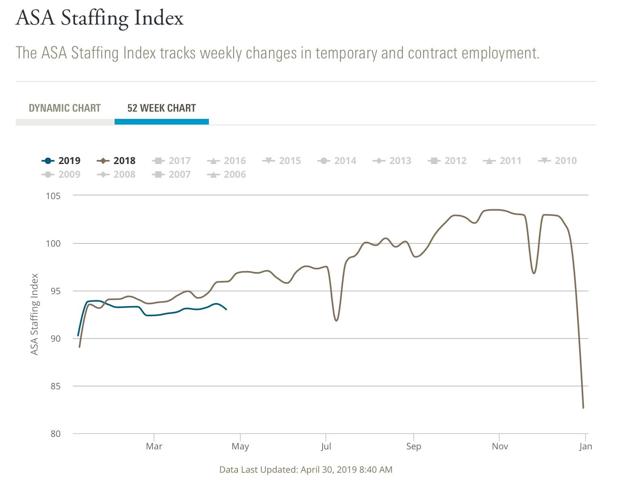
While this isn’t at “Great Recession” levels or even that of the 2015-16 downturn yet, it does suggest further weakness in that leading area.
All of which suggests that in Friday’s employment report, the three leading sectors of temporary, manufacturing, and construction jobs ought to continue to decelerate or decline.
Tuesday, April 30, 2019
Median wage and salary growth stalls in Q1, while overall positive trend remains intact UPDATE: real household income declined
- by New Deal democrat
The Employment Cost Index is a median measure of wages, and also total compensation, for the 50th percentile worker. Thus it escapes the “Bill Gates walks into a bar” issue with average measures. Sunday I wrote that “It has been improving for several years now, and I am expecting it to continue.”
Not quite. While both the wage and total compensation indexes, measured nominally, improved by +0.7% In the first quarter, on a YoY basis they declined slightly from +3.1% to +2.9%, and from +2.9% to +2.8%, respectively. Here’s the YoY graph:
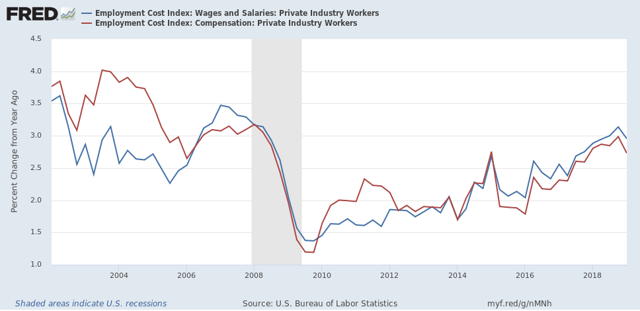
A quarterly look shows that the reason for the YoY deceleration is the outsized gains in Q1 last year, which were the best in over ten years:
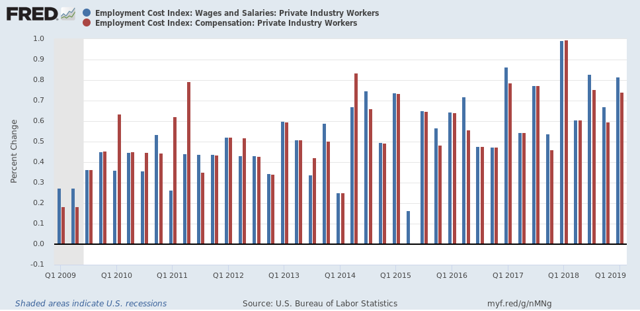
The overall trend nevertheless appears to be improvement.
While I am at it, another median measure — median usual weekly real earnings — was updated a couple of weeks ago for Q1 as well. This showed a similar trajectory:
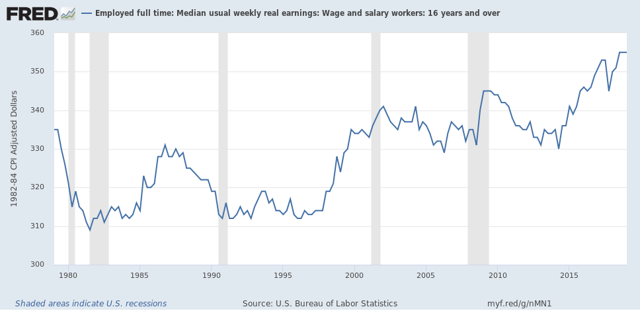
These have not improved YoY in the last two quarters, but the overall trend remains positive.
In the case neither the Employment Cost Indexnor usual weekly earnings, measured *nominally*, has the advance equaled what it was in the 2000s expansion (the only other expansion during the former’s history). In the case of *real* weekly median wages, the improvement has everything to do with the steep decline in the price of gas during 2015-16.
So, while the overall trend remains positive, Q1 didn’t add to it, and the secular trend is still subpar to the limited extent we have a prior comparison.
UPDATE: Median real household income has also turned down so far this year. This morning Sentier Research reported that:
“median annual household income was $63,425 for March 2019. The March 2019 median was 1.5 percent higher than that for March 2018 but $635 lower (about 1-percent) than in January 2019. ....Here is their accompanying graph:
Despite numerous monthly increases following the June 2011 post-recession low for median income, the March 2019 median was just 3.5 percent above the January 2000 level of $61,254 (first year in this monthly series) after adjusting for changes in prices.
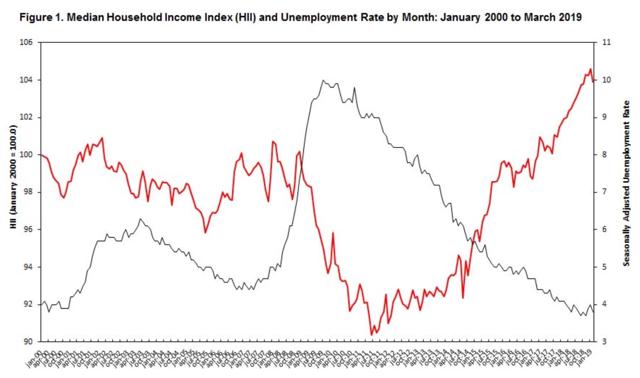
Put this together with the downturn during the first quarter in real personal income adjusted for transfer payments that the Census Bureau reported yesterday, and maybe we have some cause for concern.
Monday, April 29, 2019
The “mini-recession” rolls on
- by New Deal democrat
Yesterday I wrote: “Both [personal income and spending] are important to my “mini-recession” hypothesis. The February spending number might still be punk, but I am expecting spending in particular to come roaring back in March, especially after the blowout March retail sales report.”
That’s exactly what was reported this morning. Nominal personal income rose +0.1% each month. In real terms, income was flat in February and actually fell -0.1% in March. Nominal spending also rose +0.1% in February, and shot up +0.9% in March, so real spending was also flat in February but rose +0.7% in March:
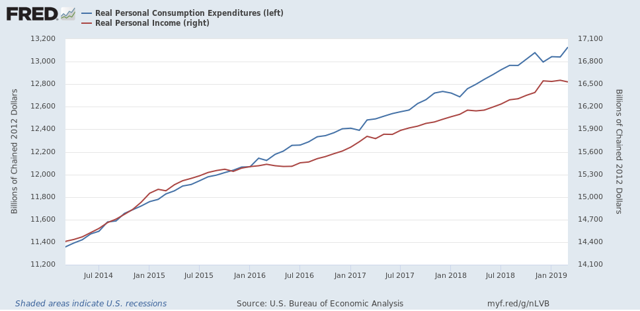
That’s exactly what was reported this morning. Nominal personal income rose +0.1% each month. In real terms, income was flat in February and actually fell -0.1% in March. Nominal spending also rose +0.1% in February, and shot up +0.9% in March, so real spending was also flat in February but rose +0.7% in March:
With the exception of March business sales, we now have all of the inputs for production, employment, sales, and income for the first quarter that the NBER typically makes use of in determining recessions. Here they all are together:
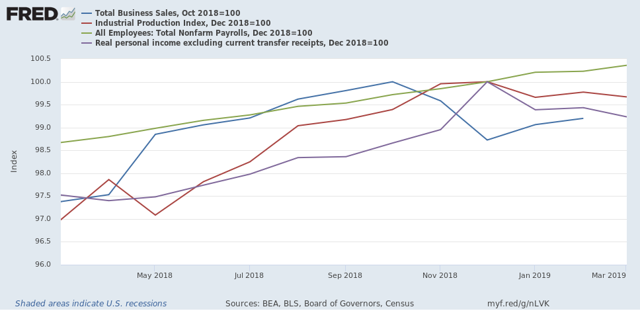
Since December, only employment and sales are up, and sales are still below their October peak.
Note that the NBER does *not* use GDP growth to date recessions. Based on the four that they do use, the “mini-recession” appears not to have ended yet.
Sunday, April 28, 2019
What I’m watching for this week
- by New Deal democrat
This week is going to be a really busy one for economic data. I’m not going to be able to do detailed posts on everything. But because in the past couple of months most of the data has gone against my “2019 slowdown” scenario, I thought both in the interests of transparency, and to put down a few benchmarks to anchor my analysis, I’d write down what I am looking for in each release.
Monday - personal income for March; personal spending for February (!) and March. Yes, we’re still playing catch-up in data releases delayed by the government shutdown. Both of these are important to my “mini-recession” hypothesis. The February spending number might still be punk, but I am expecting spending in particular to come roaring back in March, especially after the blowout March retail sales report. Basically, I think the last 45 days of Q1 pulled the economy back from a brief downturn in the first 45 days.
Tuesday - Q1 Employment Cost Index. This is a median measure of wages and benefits. It has been improving for several years now, and I am expecting it to continue. The Case-Shiller house price index also comes out Tuesday. The question will be whether house prices continue to outpace income, which I think is the case, and is one reason why the economy may be slowing, as $$$ paid on the mortgage or rent can’t be spent elsewhere. And finally, I’ll be checking to see if the weekly temporary staffing index continues to be negative.
Wednesday - Construction spending. This is one I am watching closely. It should follow housing permits and starts with a delay of several months. But, oddly, even though starts in particular have continued to languish, spending has come back strongly since last November. I’ll be looking to see if that anomaly continues, or whether construction spending reverts to its historical pattern. The ISM manufacturing index also comes out Wednesday. The Fed regional indexes have turned up in the last couple of months, so I am expecting this to improve as well.
Thursday - jobless claims. Were the two recent sub-200k readings a spasm of unresolved seasonality because Easter came so late this year? Or are they truly telling us that the economy is heating up again? If the former, I would expect another reading like the 230k reading we got last week.
Friday - payrolls. For my 2019 slowdown scenario to be right, the three leading sectors of temporary, manufacturing, and construction jobs ought to continue to decelerate or decline. I will also be looking to see if the YoY comparison in total payrolls weakens or not. Finally, I’ll be interested in whether the unemployment rate follows the downward trajectory of initial jobless claims.
One more thing. The Senior Loan Officer Survey for Q1 *might* be published this week. If so, it will tell me whether or not credit conditions are tightening or not, and if there has been any increase in loan delinquencies.
By the end of this week, my December through February “mini-recession” scenario should be finally validated, or not! And there will a lot to chew on as to whether my slowdown scenario is valid, or whether I need to not fight the data and re-evaluate.
Subscribe to:
Posts (Atom)