Saturday, November 9, 2019

Weekly Indicators for November 4 - 8 at Seeking Alpha


 - by New Deal democrat

My Weekly Indicators post is up at Seeking Alpha.

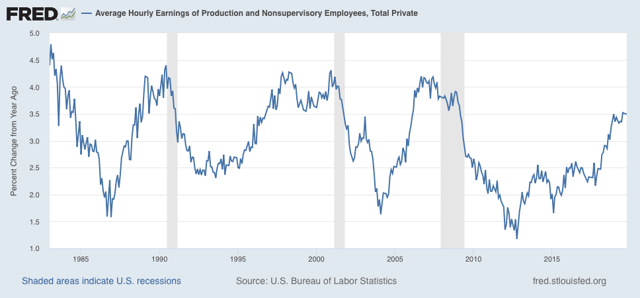
The biggest story of the week was the move higher in long term interest rates. This means that the “yield curve inversion” you’ve read so much about in the past year is over. At the same time, long term interest rates (e.g., for mortgages) haven’t moved back high enough to pose a danger to the housing market. In other words, they’re at a “sweet spot.”

A note on the political implications: my specialty is telling you what the economy is likely to look like a year from now. And one year from now is the 2020 Presidential election. That all of the recent news in the long leading indicators has been improvement means that the economy is very likely to be doing better on Election Day than it is now. Which means that the incumbent candidate’s approval is likely to be higher then than it is now. That doesn’t necessarily mean that Trump wins, but it is fair to say that it does mean that if the Democratic candidate wins, it will be by a lower margin than the present polling suggests. (I owe you this in a much more detailed post, but I wanted to give you the Cliff’s Note version now.)

Anyway, as usual, clicking over and reading my post at Seeking Alpha should be educational for you, and reward me a little bit for my efforts.

Friday, November 8, 2019

Scenes from the October employment report: leading sectors remain poor


 - by New Deal democrat

Yesterday I discussed unemployment and labor force participation from last week’s jobs report, which with the significant exception that better wage growth would probably lead to more people deciding that they’d like a job, remains very positive. Today let’s look at the bad news, which is the same as last month’s: leading indicators for employment are weak to negative.

To begin with, in the last 9 months, per the more reliable establishment report, 1,358,000 jobs have been added, an average of 151,000 per month, including census hiring, a distinct slowdown from 2018’s pace of 205,000: 


Next, let’s update the three leading sectors of employment that I have been tracking: temporary help (blue in the graph below), manufacturing (gold), and residential construction (red). Here’s what they look like compared with 2018, showing the slowdown this year (Note: the big decline in manufacturing last month was the GM strike, which will presumably be reversed in November):


While residential construction may be rebounding a little, don’t be fooled by the better-looking bars for August and September in temporary help. As I have pointed out before, this year there have been almost relentless downward revisions in that number between the initial report and the final one two months later.  That pattern held up yet again for August and September. Below are the original number for the last four months on the left, followed by the first and then final revisions to the right:

JUL +2200 -7300* -10,500
AUG +15,400 +14,500 +9,500
SEP +10,200 +20,100 ———*
OCT -8100
*1st revision only

In other words, the net change from the initial September report to the initial October report was -3200.

Further, the average manufacturing workweek is now down 1 full hour per week YoY from its peak. Although I only show data from 1983 onward below, going back 70 years there have only been 2 occasions where such a decline lasted longer than one month without a recession happening (1953 and 1966). In the modern era shown, only in 1985 and 1995 for one month apiece were there 1 hour declines without a recession following:


The issue with October’s data is whether this was affected by the GM strike as well. If it was, the number should rebound in November.

A look at the YoY% change in manufacturing hours for the past 35 years shows that such losses have *always* led to actual YoY losses in manufacturing jobs (but only sometimes to recessions):


So we should expect more and significant actual losses in manufacturing jobs going forward.

And, like temporary help, the revisions for manufacturing employment have all been downward for the past six months:

APR +4. +3 (-1)
MAY +3 +2 (-1)
JUN +17 +10 (-7)
JUL +16 +4 (-12)
AUG +3 +2 (-1)
SEP -2  -5 (-3)*
OCT -36 (GM strike)
*1st revision only

More broadly, there have been YoY losses in goods-producing jobs before all of the past 3 recessions, and going back 70 years, counting 12 recessions, in all but 3 there has been steep deceleration before and actual losses no later than two months into the recession, with only 2 false positives (1966 and 1985): 


So far this year, only 44,000 jobs have been added in the entire goods-producing sector (again, this may in part reflect the GM strike in October):


This is consistent with at very least a severe slowdown.

Where there has not been a slowdown is in the (non-leading) services sector, which remains at roughly 1.5% growth YoY:


In summary, to reiterate what I wrote last month, the leading indicators in the employment report strongly suggest that the goods-producing portion of the US economy is probably in a shallow recession right now, and that we should expect further losses in that sector. The economy in general and jobs in particular are being kept in expansion by consistent growth in the services sector.

Thursday, November 7, 2019

Scenes from the October employment report: full employment?


 - by New Deal democrat

Last Friday the household jobs report - the one that tells us about unemployment, underemployment, and labor force participation - has been particularly strong in the past three months. This has driven some impressive gains in labor force participation and the unemployment rate.

To begin with, gains in employment as measured by the household survey (red in the graphs below), as opposed to the larger (and, yes, more reliable) payrolls survey (blue), have totaled 1,222,000 in the last three months:


One month ago this gave us the lowest unemployment rate in the past 50 years, and the U6 underemployment rate is also at its lowest level, save for one month, since the series began in 1994. Each ticked up by +0.1% in October. In the below graph, both metrics are normed to zero at their lowest levels:


And even beyond that, those who aren’t even in the labor force, but say they want a job now, are less than 0.1% above their lowest level of all in comparison with the total labor force:


The only remaining weakness, and it is a significant one, is in the area of participation in the labor force. While participation in the labor force in the prime age group (red in the graph below) has jumped by +0.8% from July, and generally since 2017 has had the biggest YoY increases since the last of the baby boomer generation came of age 35 years ago:


During the employment boom of 1996-2001, prime age participation and employment were both as much as 1.6% higher than  they are now. In the below graph both prime age labor force participation and the prime age employment-population ratio are normed to zero at their October readings of 82.8% and 80.3% respectively, to show how the present level compares with earlier expansions (prior to 1987, the levels were never as high as presently):


Since the U6 underemployment rate is near record lows, as is the share of people who aren’t even in the labor force at present but say they want a job now, this shortfall is *by definition* people who told the Census Bureau that they *don’t* want a job now — chiefly because of disability or caring for family members (children or parents), in addition to those who are retired.

The reason for this shortfall is probably that wage growth (measured nominally, which is how employers give out raises) remains below that of previous expansions in the past 35+ years:


YoY real wage growth is +1.75% as of one month ago, which is pretty good, but is almost entirely driven by changes in the price of gas.

In short, increased wage growth would almost certainly draw more of those on the sidelines into the labor force.

Wednesday, November 6, 2019

A note about turnout in yesterday’s elections


 - by New Deal democrat

I haven’t seen any information yet on how turnout in last night’s elections, particularly in Virginia, which was an “off-off year” election, i.e., no statewide races at all, only state legislative and local races.

The state of Virginia keeps turnout statistics online back to 1976. The bottom line is, clearly something happened in the late 1990s that drove down turnout, which has been reversed in the last two years.

In the 5 “off years” with statewide races between 1977 and 1993, turnout averaged 61.6% of registered voters.

By contrast, turnout in the “off-off years” between 1979 and 1995, turnout averaged 54.6% of registered voters. That’s a 7% decline. 

Now, here are the same figures for the 10 state elections thereafter.

In the 5 “off years” with statewide races between 1997 and 2013, turnout averaged 44.8%, a decline of almost 17%.

In the 5 “off-off years” between 1999 and 2015, turnout averaged 31.0%, a decline of over 23%!

Two years ago, 2017, was the first “off year” election after Trump’s win. Turnout was 47.6%, a bounce from the five previous “off year” elections but nowhere near the previous averages.

We don’t have information yet from yesterday, but here’s what happened in the House district that ended in an exact tie two years ago, that was won by a drawing from a hat by the GOP candidate, which gave the GOP a 51-49 majority (that’s right, exactly *ONE VOTE* made all the difference between which party was in control of the House of Delegates.):

2015:


2017 (the tie):


2019


Turnout, at 20,000, was a lot closer to the 2017 “off year” 24,000  than the 2015 “off-off year”  14,000, probably about 39%. If that figure is representative of the statewide average, only a little less than half of the drop-off from the 1977-95 period will have been made up.

Big progress, but clearly still a long way to go.

UPDATE: This comes from Chaz Nuttycombe: median turnout in the Senate races was 41%, and for House of Delegates races was 40%, so pretty close to my estimate.

Tuesday, November 5, 2019

September JOLTS report: mixed with “hard” positives and a “soft” negative


 - by New Deal democrat

This morning’s JOLTS report for September was mixed, with a decline in job openings and an increase in layoffs, but advances in hiring and voluntary quits.

To review, because this series is only 20 years old, we only have one full business cycle to compare. During the 2000s expansion:

  • Hires peaked first, from December 2004 through September 2005
  • Quits peaked next, in September 2005
  • Layoffs and Discharges peaked next, from October 2005 through September 2006
  • Openings peaked last, in April 2007   
as shown in the below graph(averaged quarterly through Q3): 


Here is the monthly data for the past five years:


As you can see, hires and total separations are at or near their peaks. Quits have declined in the past two months from their all time high, but are still slightly higher YoY. On the other hand, job openings (which I consider “soft” data) have completely rolled over, and are actually negative YoY.

Next, here is the history of the “hiring leads firing” (actually, total separations) metric  quarterly through Q3 of this year:


While both hires and fires essentially went sideways in late 2018 and through the first half of this year, in the third quarter, after revisions, both shot up to new highs. 
      
Finally, For completeness’ sake, below are total layoffs and discharges. Note that these turned up appreciably in the six months or so before the Great Recession, with the quarterly average, shown in red, up 15% from its bottom - a similar level of increase that has historically been shown before recessions in YoY initial jobless claims during their lengthier history:  


These did sharply increase in September, but the three month average hasn’t increased nearly enough to be a source of concern yet.

One month ago, the deceleration in nearly all metrics had reached neutral levels. With revisions, this month’s “hard” hiring and total separations metrics have resumed a positive trend, while quits are weakly positive, layoffs and discharges are neutral, and only the “soft” job openings metric is negative.

With only one complete previous business cycle to go on, it is difficult to form any judgment from these cross-currents.

Monday, November 4, 2019

Q3 GDP points away from a producer-led recession


 - by New Deal democrat

In the past 60 years, most recessions have been consumer-led, and have been preceded by both increases in mortgage rates in excess of 2% and/or increases in the price of gas by 40% or more per year. Usually the Fed has been hiking rates by 2% or more, and the change in YoY inflation has also increased by 2% or more. Housing starts typically went down by 25% or more, and that fed through the rest of the economy over the next 12-24 months. The bottom line is that consumer budgets became stressed, so they cut back on spending. When real consumer spending per capita declined, a recession began.

The most notable exception was the recession of 2001. Housing went down by a maximum of 12.5%, and picked back up before the recession began. Real personal consumption expenditures were flat to slowly rising throughout the recession, except for immediately after the 9/11 attacks. 

What went down in 2001 were corporate profits, which fell by 20% or more adjusted by unit labor costs.

This leads me to the current situation. Mortgage rates went up by only 1.5% at the most between 2016 and 2018. While the Fed did hike rates over 2% in total, the hikes were very gradual. The change in YoY inflation never increased more than 1.2%. Oil prices did rise more than 40% YoY for most of 2018, but from very low levels, and for the past 12 months have *decreased* on a YoY basis by an average of 20%. Real wages, which were flat for most of 2016 and through 2017, have increased pretty consistently since early 2018 as well. Real retail sales and real consumption expenditures have risen to new highs.

In short, as I have said a number of time, “the consumer is alright.” There is no sign of a cutback in real per capita consumer spending that has led nearly all recessions. If a recession is going to happen now, it would have to be producer-led, like 2001. And that means, a substantial decline in corporate profits would happen first.

Which leads me to the point of today’s post. As of Friday, according to FactSet, Q3 corporate earnings are only 2% below their Q4 2018 peak, and they never went down more than 10%:


Further, the first estimate of Q3 GDP was released last week. Both long leading indicators in that report, real private residential investment and proprietors’ income, increased. In other words, no sign there of the kind of producer-led turndown that we would need to see before a 2001-style recession were to begin.

I discussed the Q3 GDP report with accompanying graphs last Friday at Seeking Alpha. As usual, clicking over and reading should be educational for you as well as rewarding me for my efforts.