Saturday, August 27, 2022

Weekly Indicators for August 22 - 26 at Seeking Alpha


 - by New Deal democrat

My Weekly Indicators post is up at Seeking Alpha.

In the past couple of weeks, the decline in gas prices has slowed considerably. Once they stabilize, the underlying economic fundamentals should reassert themselves. In the meantime, there are cross currents of interest rates and manufacturing orders, among other things.

As usual, clicking over and reading should be educational for you and remunerative in a very small way for me.

Friday, August 26, 2022

July personal income and spending: more modestly good fallout from lower gas prices


 - by New Deal democrat

There was more good fallout from the recent decline in gas prices in today’s July report on personal income and spending.

Personal income rose 0.2% for the month nominally, and nominal spending rose 0.1%. But because the relevant measure of inflation, the PCE deflator, declined -0.1%, real income rose 0.3% and real personal spending rose 0.2%. Meanwhile June’s income and spending numbers were revised higher and lower by 0.1% and -0.1%, respectively.

This year I have been comparing both real personal income and spending with that with their level after early 2021’s round of stimulus as of May one year ago. Accordingly, the below graph is normed to 100 as of May 2021:


Since then, real spending is up 2.5%, while real income has declined by -1.0%. 

Comparing real personal consumption expenditures with real retail sales since May 2021(essentially, both sides of the consumption coin) shows that both were a hair above being flat in July:


Finally, the personal saving rate was unchanged at 5.0%, tied with June for the lowest since right after the Great Recession in 2009 (note: below graph subtracts -5.0% to norm the current reading at zero):


This is the lowest since the end of the Great Recession. Only the ends of the 1990s boom and 2000s housing bubble were lower. 

Usually the savings rate tends to decrease as expansions grow longer, leaving consumers more vulnerable to shocks. Recent months have suggested that consumers have been digging deeper into their savings in order to deal with higher gas prices. Which isn’t entirely bad news, since recessions typically start when consumers get spooked enough to increase their savings rate. 

Instead, with gas prices having declined since June, consumers were probably a little more confident. This was a very modestly good report.

Thursday, August 25, 2022

Jobless claims: put the recession on hold! (For now)


 - by New Deal democrat

For the last several months, there had been nearly a relentless slow increase in new jobless claims. That trend has broken, at least for now.


Initial jobless claims declined by 2,000 to 243,000. The 4 week average, however, increased by 1,500 to 247,000.  Continuing claims declined -19,000 from their 4 month high water mark one week ago to 1,415,000:


Claims had been trending almost relentlessly higher, until one week ago. They were set to turn higher YoY in November, which would signal an imminent recession. We now have at very least a pause, and possibly (although I think it is unlikely) a reversal in trend. 

Mainly I put this down to the effects of lower gas prices, which have loosened the “choke collar” on consumer spending, although it may also reflect to some extent a bottoming of the implosion in crypto-related layoffs.


Shorter version: put the recession on hold, for now!

Wednesday, August 24, 2022

Coronavirus dashboard for August 24: the post BA.5 wave respite


 - by New Deal democrat

In general, things are headed in the right direction for now in the pandemic.


BIobot’s latest wastewater update from one week ago shows a 1/3rd decline in COVID particles nationwide. Here’s the regional breakdown:


The West, spearheaded by CA, is down 50%, and the South 33%. The Midwest is down the least, perhaps due to the larger % of BA.4.6 in that area. Speaking of which, here is the CDC’s latest update on variant proportions:


There has been virtually no change since one week ago. BA.5 makes up 90% of all cases, with BA.4 4%, and BA.4.6 6%. BA.4.6 makes up 16% of all cases in the Central Plains, up from 14% one week ago:


BA.4.6 is not much of a factor elsewhere.

With no new significant variant on the horizon at this point, cases have declined by about 1/3rd from their recent peak, to just over 80,000, while deaths (which lag) are still in the 575 range:


With the exception of 2 months around mid year 2021, deaths had been above 1000 per day, and as high as 2700 per day, at all times since the start of the pandemic until this past spring.

Hospitalizations have also started to decline, down over 15% since their recent peak:


If hospitalizations and deaths follow the pattern in cases, hospitalizations should be down to about 32,500 in several weeks, and deaths should gradually decrease back to about 350 thereafter.

Finally, some important demographic information. According to a study by the University of Washington, COVID remains a much more serious disease for the elderly, and for the unvaccinated.

Here is the population-adjusted breakdown by age and vaccination status of hospitalizations:


And here is the breakdown for deaths:


The information was not calculated for younger age groups because deaths among them were relatively rare.

Dr. Eric Topol also recently tweeted about the importance of older persons updating their vaccinations with booster shots:


Hopefully once the Omicron-targeting boosters become available this autumn, the Biden Administration will ramp up exhortations to older persons to become fully boosted.

In the meantime, for now there is a relative respite, which should last until either a new, fitter variant arrives, or recently acquired resistance through infection wanes.


Tuesday, August 23, 2022

July new home sales signal a recession is near


 - by New Deal democrat

Let’s start with reminders about new home sales data:

1. It is very noisy
2. It is heavily revised.
But
3. It usually leads at peaks and troughs.

With that in mind, unless today’s new home sales data for July is revised away, it is very significant.

First of all, June’s sales data was indeed revised slightly lower from 590,000 to 585,000. More significantly, the median price of a new home, originally reported at +7.2% YoY, was revised higher to +10.7%.

In July, new home sales declined to 511,000 at an annualized pace. That is the lowest since January 2016. It is also 49.3% off its peak of 1.036 million in August 2020. Here is the long term view since the start of the data in the 1960s:


This is simply a huge decline. Typically a decline of only 33% from peak has been enough to indicate the imminent onset of a recession. The only bigger decline was the housing bust from 2005-07.

The YoY data tells the same story. The only similar YoY% declines that did not signal recessions were in 1966 and 2010:


I’ve included the far less noisy single family permits (red) in the above graph as well. Permits tend to lag by a month or two, and are currently only down -11.3%. Again, unless today’s data is revised away, it is likely permits will be down over -20% YoY within several months, which also has almost always signaled an oncoming recession.

Finally, the median price of a new home rose on a monthly basis to $439,400, below April’s peak of $458,200:


But because price data is not seasonally adjusted, the best way to look at it is YoY. My rule of thumb is that, when YoY growth is less than half of the peak in the past 12 months, the measure (if we could seasonally adjust it) has probably peaked.

YoY prices in July increased 8.2%, only about 1/3rd of the 24.2% YoY increase last August:


This tells us the prices most likely peaked in May, the last time the YoY% increase was more than half of the peak. Even with the upward revision to June, averaging the last 2 or 3 months of price data yields a result more than 50% below the peak average 2 or 3 months of price data from last summer.

In summary: sales have continued to fall, prices have now likely turned down, and inventory can be expected to continue to increase. Further, the decline in sales is so severe that, unless very heavily revised upward, it almost certainly means a recession is near.

Monday, August 22, 2022

The state of inflation


 - by New Deal democrat

There’s no big economic news today, and as usual very limited COVID reporting over the weekend, so let’s catch up on the state of inflation in the economy.


Three of the biggest components of inflation have been gas, housing, and vehicles. Let’s look at each in that order.

According to GasBuddy, average US prices as of today are $3.86/gallon:


As the above graph shows, that means that almost 80% of the Ukraine war premium in prices has been deflated.

Although we’re only 2/3’s of the way through the month, here’s what the monthly inflation correlation looks like so far:


In the above graph, I’ve divided the change in gas price by 16, roughly in equivalent scale to total inflation. Because these is about a +.15% underlying bias to core inflation, I’ve subtracted that for a better correlation. Based on that, actual inflation in August looks unlikely. Another month of unchanged prices, if not outright deflation for the month appears likely.

That’s the good news.

Turning to housing, here’s the graph I ran several weeks ago of the latest FHFA and Case Shiller house price indexes through May, vs. owner’s equivalent rent, how the Census Bureau measures housing in the CPI:


Because OER lags actual house prices, increases in which so far have not decelerated significantly in those indexes, we can expect monthly OER increases in line with the +.5% or +.6% of last few months, if not even slightly higher, as shown in the graph below:


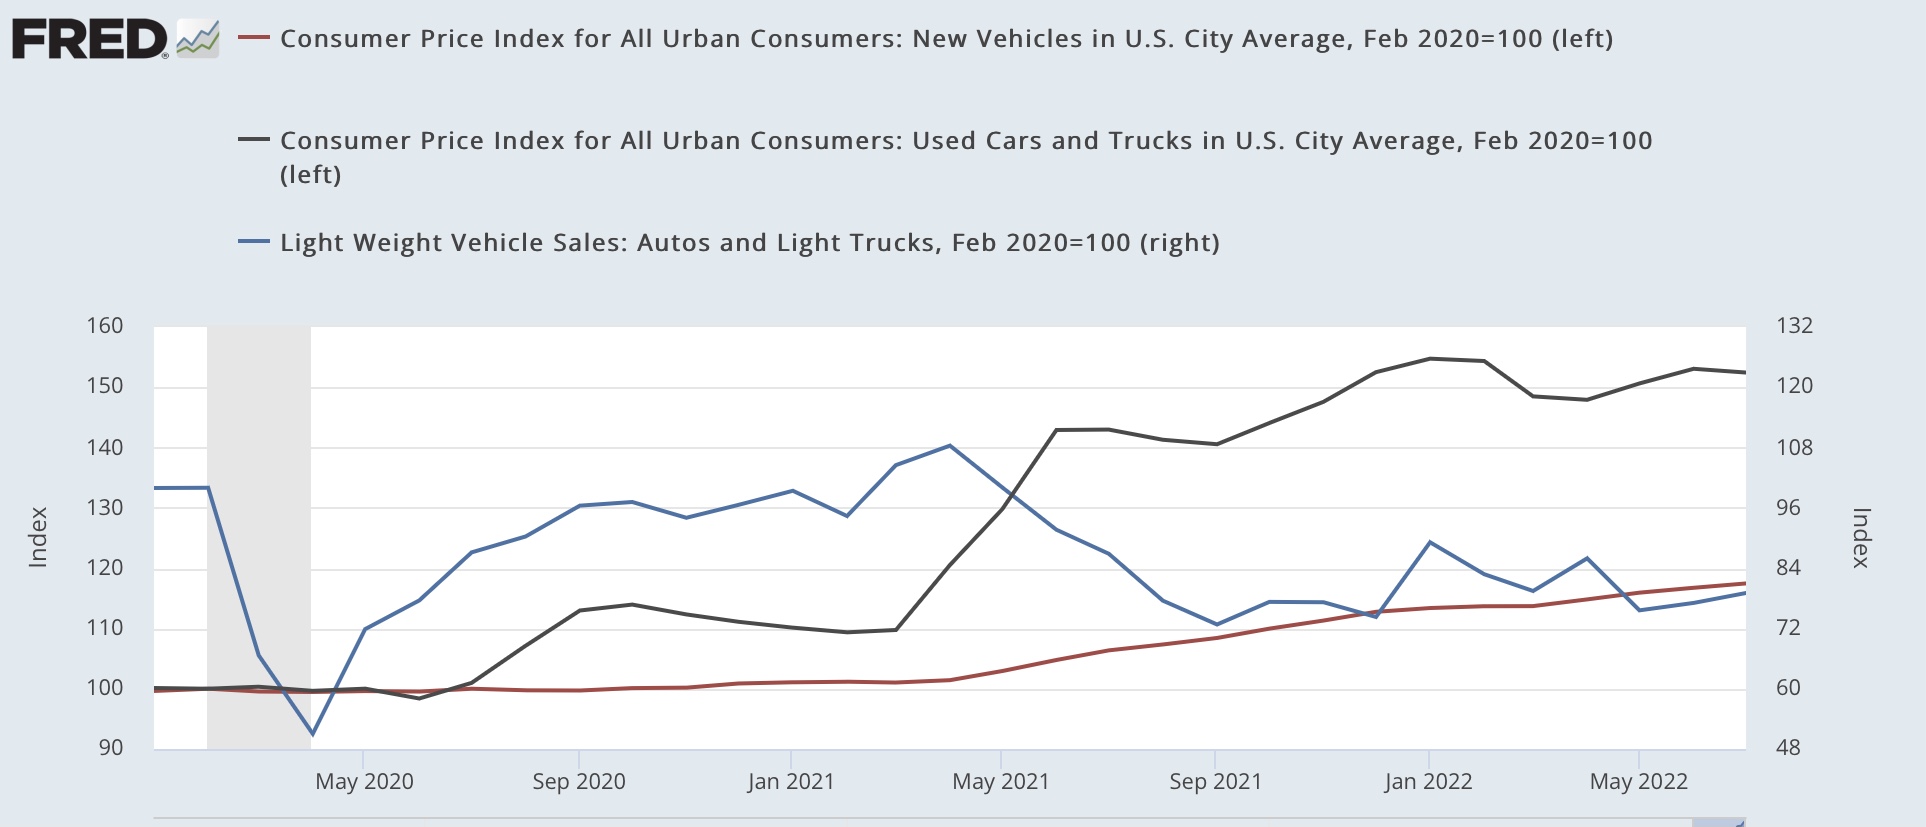
Finally, let’s turn to vehicles. Used car prices started to increase sharply in spring 2021, and are now 50% higher than they were just before the pandemic. The good news there is that seasonally adjusted prices (black in the graph below) are no higher than they were 8 months ago, in December of last year:


New car prices (red) started to appreciate sharply several months after used car prices, and are now 18% higher than just before the pandemic. Further, in the past year, they have increased by at least .6% in every month except for last winter.

As you might expect, new vehicle sales (blue, right scale above) have declined sharply (about 25%) in response to the big price increases.

Via Wolf Street, according to Cox Automotive vehicles in stock and in transit to dealers is still 70% below what it was just before the pandemic:


In short, there is no sign of any abatement in inflation either of housing or of new vehicles. The decline in gas prices should result in another good consumer price reading for August, but the future course of oil prices, as shown below, will determine the trajectory of any further gas price declines: