Saturday, November 2, 2019
Weekly Indicators for October 28 - November 1 at Seeking Alpha
- by New Deal democrat
My Weekly Indicators post is up at Seeking Alpha.
The last long leading indicator that I was concerned about, corporate profits for Q3, resolved to the upside this week, according to FactSet. This means that all of the long leading indicators which had been negative a year ago are gone. Short leading indicators also slightly improved this week.
As usual, clicking over and reading should bring you up the moment on the economy, and also rewards me with a penny or two for my efforts.
Friday, November 1, 2019
October jobs report paints a portrait of a full (or nearly full) employment economy
- by New Deal democrat
HEADLINES:
- +128,000 jobs added (+148,000 ex-Census)
- U3 unemployment rate up +0.1% from 3.5% to 3.6%
- U6 underemployment rate up +0.1% from 6.9% to 7.0%
Leading employment indicators of a slowdown or recession
I am highlighting these because many leading indicators overall strongly suggest that an employment slowdown is coming. The following more leading numbers in the report tell us about where the economy is likely to be a few months from now. These were mixed:
- the average manufacturing workweek fell -0.2 from 40.5 hours to 40.3 hours. This is one of the 10 components of the LEI and is negative.
- Manufacturing jobs declined by -36,000 (but would have risen by +6,000 were it not for the GM strike). YoY manufacturing is up 49,000, a sharp deceleration from 2018’s pace.
- construction jobs rose by +10,000. YoY construction jobs are up +148,000, also a deceleration from summer 2018. Residential construction jobs, which are even more leading, rose by +2,900.
- temporary jobs declined by -8,100. September’s strong number, however, was revised even higher to +20,100.
- the number of people unemployed for 5 weeks or less rose by -100,000 from 1,868,000 to 1.968,000.
Wages and participation rates
Here are the headlines on wages and the broader measures of underemployment:
Here are the headlines on wages and the broader measures of underemployment:
- Not in Labor Force, but Want a Job Now: declined by -127,000 from 4.880 million to 4.753 million
- Part time for economic reasons: rose by 88,000 from 4.350 million to 4.438 million
- Employment/population ratio ages 25-54: rose +0.2% from 80.1% to 80.3% (NEW EXPANSION HIGH).
- Average Hourly Earnings for Production and Nonsupervisory Personnel: rose $.04 to $23.70, up +3.5% YoY. (Note: you may be reading different information about wages elsewhere. They are citing average wages for all private workers. I use wages for nonsupervisory personnel, to come closer to the situation for ordinary workers.)
Holding Trump accountable on manufacturing and mining jobs
Trump specifically campaigned on bringing back manufacturing and mining jobs. Is he keeping this promise?
Trump specifically campaigned on bringing back manufacturing and mining jobs. Is he keeping this promise?
- Manufacturing jobs rose an average of +4000/month in the past year vs. the last seven years of Obama's presidency in which an average of +10,300 manufacturing jobs were added each month.
- Coal mining jobs fell -100, an average of -67 jobs/month in the past year vs. the last seven years of Obama's presidency in which an average of -300 jobs were lost each month
Other important coincident indicators help us paint a more complete picture of the present:
- Overtime remained at 3.2 hours
- Professional and business employment (generally higher-paying jobs) rose by 22,000 and is up +402,000 YoY.
- the index of aggregate hours worked for non-managerial workers rose by 0.1%
- the index of aggregate payrolls for non-managerial workers rose by 0.3%
Other news included:
- the alternate jobs number contained in the more volatile household survey rose by 241,000 jobs. This represents an increase of 1,928,000 jobs YoY vs. 2,093,000 in the establishment survey.
- Government jobs declined by -3,000 (+17,000 ex-census).
- the overall employment to population ratio for all ages 16 and up was unchanged at 61.0% m/m and is up 0.4% YoY.
- The labor force participation rate rose +0.1% from 63.2% to 63.3% and is up 0.4% YoY.
SUMMARY
This was a very good report with few negatives, which were chiefly in manufacturing.
In particular, it is looking even clearer that we may be at practical “full employment.” The prime age employment population ratio has matched its high point of the 1980s and 2000s expansion, and was only higher for 15 months in 1999-2000. Those not in the labor force but who want a job now are also at a 25 year low as a share of the labor force. Meanwhile, nonsupervisory wages remained at an expansion high YoY at +3.5% (except for one month, and still below peak YoY changes in the past 3 expansions).
The negatives were the slight tick upward in the unemployment and underemployment rates (and the GM strike was not big enough to account for those). The manufacturing workweek declined further, a bigger warning for job losses to come. Temporary jobs, including revisions were flat, so they are above July’s trough but below last autumn’s peak.
Reasonably speaking, with revisions, this report paints a portrait of a full or nearly full employment economy with a few soft spots, and wages that still ought to be making more progress.
Thursday, October 31, 2019
The consumer / employment sector of the economy continues powering along
- by New Deal democrat
..... aaaaand, I’m back. Did you miss me?
Here is the essence of my view of the economy right now:
1. The producer sector of the economy is struggling, partly due to higher interest rates in the last two years filtering through the system, and partly due to stupid and irrational trade wars.
2. The consumer + employment sector of the economy, on the other hand, is moving right along, fueled mainly by very low inflation (low gas prices continue) and also by lower mortgage rates.
3. The longer term outlook (one year or more out) continues to improve.
This morning we got three reports focused on the consumer/employee. Let’s take a look at each.
First, real personal income improved by +0.3% in September, and real personal spending improved by +0.2%:
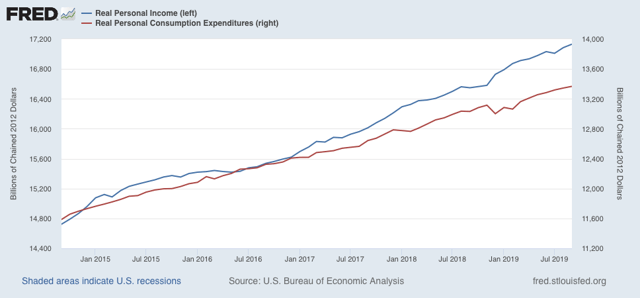
That’s all to the good.
Second, initial jobless claims continue to be close to their bottom. The four week moving average and the monthly average for October, both at 214,750, are lower than they were one year ago:
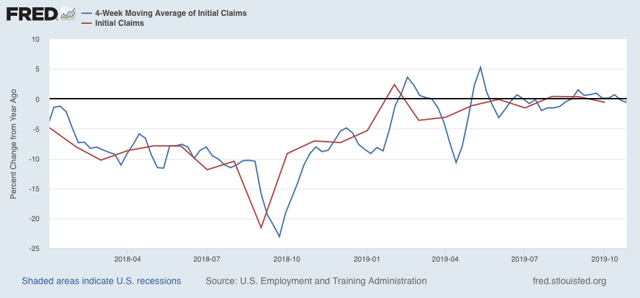
So long as the employment situation continues like this, I see little chance of any imminent downturn. Needless to say, the employment situation continues to be good.
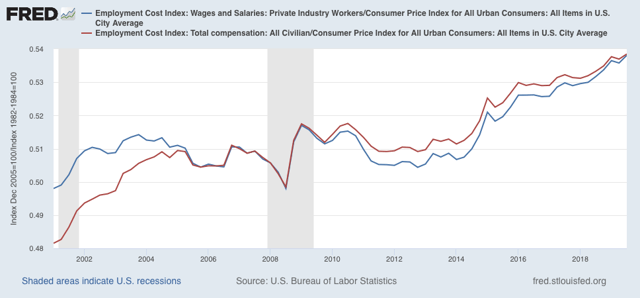
Finally, the employment cost index for the Third Quarter also came in very positive, both for wages and total compensation (things like pensions and medical insurance). The former was up +0.9%, and the latter up +0.7%:
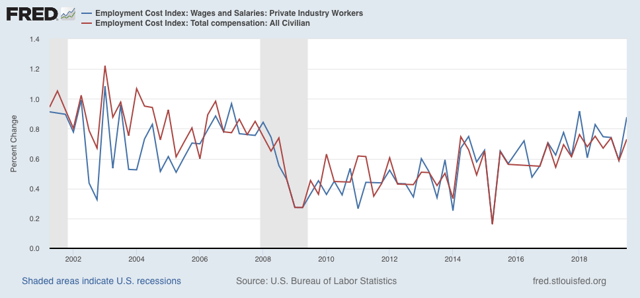
Both set new record highs in real, inflation-adjusted terms, if only slightly so:
So, both on the employment end and the compensation end, things are looking pretty good at the moment for average middle/working class Americans.
Wednesday, October 30, 2019
Cross one item off the bucket list
- by New Deal democrat
Here’s a picture of what I’ve been doing:

Generic picture of water and land ... except, if you look carefully, the grassy area at the bottom is slightly curved. That’s because, on the left is the Ohio River, and on the right is the upper Mississippi. I’m standing at the tip of land in Cairo. Illinois. Across the Ohio is Kentucky. To the far right is Missouri. Right where the two fishing boats are you can see the turbulence where the two currents meet. Although the Ohio is wider and, according to what I read, has a bigger volume of water, on this particular day the upper Mississippi had the stronger current.
By the way, did I ever mention that I am a nerd?
Tuesday, October 29, 2019
Still traveling
- by New Deal democrat
I’ve been busy checking off a few items on the bucket list.
I’ll be back at work in a couple of days.
I’ll post a quick update tonight or tomorrow if I get a chance.
Subscribe to:
Posts (Atom)