Saturday, May 21, 2022

Weekly Indicators for May 16 - 20 at Seeking Alpha


 - by New Deal democrat

My Weekly Indicators post is up at Seeking Alpha.

The yield curve tightened some more this week (but did not invert).

Meanwhile, I am seeing a fair amount of commentary suggesting that a recession is imminent. This is jumping the gun, and is mainly relying on the downturn in the stock market as well as the increase in gas prices. These are short leading indicators, but only signal correctly once the long leading indicators have been in place for a sustained period of time - which they have not.

As usual, clicking over and reading will bring you up to the virtual moment as to the economy, and will bring me a little beer money.

Friday, May 20, 2022

Coronavirus dashboard for May 20: signs of a peak in BA.2.12.1 in bellwether jurisdictions; is BA.4/BA.5 next?


 - by New Deal democrat

With no significant economic data today, let’s take a look at where the BA.2.12.1 COVID wave is.


Nationwide cases (thin line below) have increased about 3.5x from their bottom of roughly 26,700 five weeks ago, to just over 100,000. Meanwhile deaths (thick line) appear to still be in the process of making a bottom at under 300 per day:


A longer term perspective shows that, compared with the Omicron peak, both deaths and cases are comparatively very low:


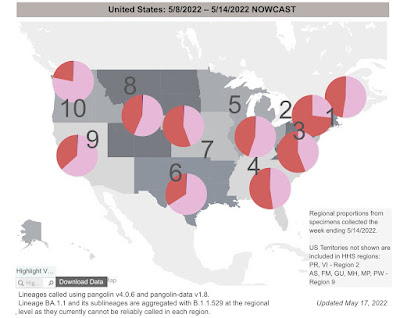
The CDC variant update shows that, as of last week, the BA.2.12.1 variant was causing just under 50% of cases nationwide. Its share has been increasing by only about 6%-7% per week nationwide in the past month:


As usual, different regions of the country show very different progress of the BA.2.12.1 variant:


NY, NJ, and PR remain the epicenter, with BA.2.12.1 constituting a majority of cases along the rest of the East Coast and, surprisingly, in the central Plains. Meanwhile it constitutes a distinct minority of cases along the West Coast.

Focusing on the bellwether region, in NY, NJ, and PR, BA.2.12.1 made up almost 75% of cases last week:


And this week showed the first signs that BA.2.12.1 cases are peaking in the Northeast and portions of the upper Midwest that also began to rise early this spring:


Puerto Rico has been particularly hard hit, so I am showing it separately, but it too is apparently peaking:


New Jersey has still been rising, with a possible peak beginning to form in the past few days:


With the exception of PR, where cases increased 30x, and Vermont, where cases only increased roughly 2.5x, the other bellwether States increased roughly 5x from their March bottoms to their present peaks.

If we extrapolate the experience of the bellwether jurisdictions to the rest of the country, we can expect cases to continue to rise for about another month, with a peak of about 140,000 -150,000 cases. A similar increase in deaths would put a peak of roughly 1400-1600/day in about 2 months.

With ever more evidence that reinfections are becoming common, plus plenty of evidence that the Omicron variants can break through vaccinations (although it must be emphasized that cases in vaccinated people are typically much milder, with much less risk of poor outcomes), we meanwhile await the inevitable next variant, which may or may not be the BA.4 and BA.5 lineages from South Africa, which are now being found in almost every State albeit in very small amounts.


Thursday, May 19, 2022

Initial claims: a little cooling in the white hot employment market


 - by New Deal democrat

Initial jobless claims rose 21,000 to 218,000, continuing above the recent 50+ year low of 166,000 set in March. The 4 week average also rose by 8,250 to 199,500, compared with the all-time low of 170,500 set six weeks ago. On the other hand, continuing claims declined another -25,000 to 1,317,000, yet another new 50 year low (but still well above their 1968 all-time low of 988,000):


Initial claims have trended slightly higher over the past 2 months, which, while it shows some cooling in the white hot employment market, is nowhere near a cause for concern at this point. This continues to be the brightest spot in the entire economy.


Wednesday, May 18, 2022

Housing permits and starts decline slightly, but housing still an economic positive over the next 12 months


 - by New Deal democrat

Housing permits and starts declined, but not by much, in April.

Importantly, while typically permits, especially single family permits, lead these series, in the past year there has been a unique divergence between permits and starts due to construction supply shortages.  This has been reflected in the number of housing units authorized but not started increasing to 50+ year records. In April that number declined by a tiny 0.6 million annualized to 293.3: 


As a result, I am paying the most attention to the three month average of housing starts (blue in the graph below) for the time being, as these reflect actual economic activity, vs. permits (gold) which don’t. And that three month average increased slightly to 1.743 annualized, a new 15 year record:


Meanwhile, single family permits (red above, right scale) declined .53 million units annualized to a 5 month low of 1.110. This is -9% off from their peak in January 2021, and does give us the best signal as to where housing is going in the near future.


And what does that future hold? Below are the YoY% change in starts (blue) and single family starts (red), vs. the YoY change in mortgage rates (inverted, *10 for scale), showing that mortgage rates are higher by 2% YoY (shown as -20%). The last time this drastic an increase in mortgage rates YoY happened was in 1994. Note that housing permits and starts declined 20% in the next year, and changes in mortgage rates in 1999 and 2018 resulted in similar declines in permits in starts in 2000 and 2019.  At present the three month average of starts is still 13% higher YoY, while single family permits are now down -4% YoY:


The “demographic tailwind” that buoyed housing activity 5 and 10 years ago has dissipated, as the number of 25-35 year old first time buyers has stopped increasing. Thus I expect a 20% YoY decline in housing permits and starts to manifest in roughly the coming 12 months. But while ordinarily that would be a major negative long leading indicator, actual construction starts mean the downturn will be delayed until the 50+ year record backlog has been cleared - which might take another 6 to 12 months. Since starts are the actual, hard economic activity, this indicates that housing is still going to make a positive to the economy looking out ahead 12 months.

Tuesday, May 17, 2022

Industrial production continues to show excellent growth


 - by New Deal democrat

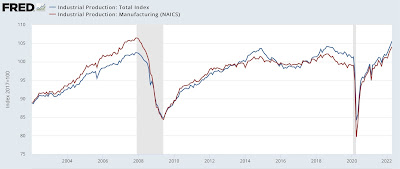
I call industrial production the King of Coincident Indicators, because it speaks volumes about where the economy is at any particular moment, and empirically is the indicator whose peaks and troughs coincide most definitively with NBER recession dates.

In April the story told by industrial production continued to be very positive, as total production rose by 1.1%, and manufacturing production rose by 0.8%.  The former made yet another new record high, while the latter has only been exceeded in a 12 month period from spring 2007 through winter 2008:


On a YoY basis, total production is up 6.4%, while manufacturing is up 6.0%. Compared with the last 40 years, and particularly the last 20, this is excellent  growth:


Taken together, this morning’s economic reports show us a consumer who is still doing OK, and a production sector that also continues to perform well.

Real retail sales signal further expansion, but also continue to suggest slower payrolls growth ahead


 - by New Deal democrat

Nominal retail sales for the month of April were up 0.9%, and previous months were revised higher. That means that , after inflation, real retail sales for April were up 0.6%, a very positive number.

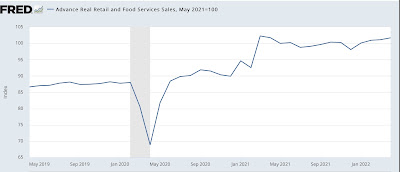
Yesterday I wrote that, rather than a YoY comparison with last April, during the stimulus spending spree, the more important comparison was with last May. Although the direct YoY comparison is absolutely unchanged, vs. last May real retail sales were up 1.7%:


This is consistent with a relatively slow consumer-fueled expansion (a moderate expansion would be a number more like 2.5%-3.0% YoY), and not consistent with any imminent recession.

Next let’s turn to employment, because real retail sales are also a good short leading indicator for jobs.

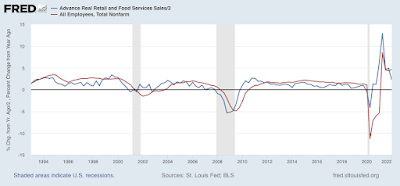
As I have written many times over the past 10+ years, real retail sales YoY/2 has a good record of leading jobs YoY with a lead time of about 3 to 6 months. That’s because demand for goods and services leads for the need to hire employees to fill that demand.  The exceptions have been right after the 2001 and 2008 recessions, when it took jobs longer to catch up, as shown in the graph below, averaged quarterly through the First Quarter: 


Now here is the monthly YoY comparison through April:


The above graph is an excellent way to compare the relationship in a more normal expansion, viz., 2019, where real retail sales/2 was in the .3%-1.0% range, vs. last year, where they were in the 5% range. I have been expecting the blowout job numbers of about 500,000 per month to end in several months. This report is more evidence for that, since the comparison with last May is 0.85%. This suggests that monthly job gains are going to slow down to a range of about 100,000-300,000 per month by early autumn.

Finally, real retail sales per capita is one of my long leading indicators. Here’s what it looks like for the past 25 years:


These are up 1.4% since last May, and the highest of all time except for March and April 2021. While for that reason I can’t call these a positive, the recent rebound in no way resembles their declining pattern before the last two recessions, and switches the long leading signal from negative to neutral for this metric.


Monday, May 16, 2022

Will tomorrow’s real retail sales report forecast a recession, or just a continued slowdown?


 - by New Deal democrat

No economic data today of significance; but tomorrow one of my favorite economic indicators, retail sales, will be reported for April. Since real retail sales lead employment, and generally are a short leading indicator for the economy as a whole, I wanted to update on what I see as their importance right now.


Here are real retail sales per capita (red) vs. real aggregate payrolls per capita (blue), both normed to 100 as of last May (note: I chose May because of the stimulus fueled spending spree in March and April that abated by then):


As you can see, payrolls have continued to grow by about 10% since then, while real retail sales per capita have for all intents and purposes been flat for the 10 months since, up only 0.3% as of March.

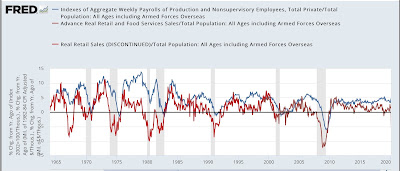
Why is this important? Here is a look at the same two metrics going back 60 years measured YoY:


Two important relationships ought to jump out. First, while the relationship is noisy on a monthly basis, over the longer term real retail sales lead payrolls, usually on the order of about 6 months. Second, real retail sales being negative YoY for any sustained period of time is an excellent harbinger of recession. Not only have they turned negative YoY in advance of every recession in the past 50+ years, but on the few occasions where a recession did not follow a negative number that was sustained for more than a month or two - 1966, 1987, 1994, 2002 - there was a marked economic slowdown that was not far off from recession.

Now let’s take a look at the same numbers for the past 3 years:


Note that payrolls were up 20% YoY in April 2021, and real retail sales jumped 50%! Since the biggest previous advance was about 12% YoY, had I included this data in the long term chart above, everything else would have been squiggles.

Note also that real retail sales per capita were negative YoY in March. They will presumably remain negative in April, because they are being compared with the stimulus spending spree last April.  For purposes of a pre-recession marker, the real marker is whether they will be down compared with last May, after the spending spree. Since consumer prices increased 0.3% in April, retail sales must increase 0.3% just to keep pace. A decline of -0.4% or more would make them negative compared with last May.

Because my suite of long leading indicators has not indicated a recession this year, I am expecting real retail sales to escape such a negative reading. But not necessarily by much. At the moment, they are forecasting a marked slowdown in the economy continuing this year. We’ll get the update tomorrow.