Saturday, September 22, 2018
Weekly Indicators for September 17 - 21 at Seeking Alpha
- by New Deal democrat
My Weekly Indicators post is Up at Seeking Alpha.
A number of indicators that have been on the cusp of changes have rebounded. But a byproduct is, that if interest rates are moving further away from Scylla, they are moving closer to crashing into Charybdis.
As usual, clicking over and reading is not only hopefully informative to you, but also ever so slightly renumerative to me!
Friday, September 21, 2018
A bold forecast: there will be no autumn surge in housing this year
- by New Deal democrat
The big issue this year in housing is whether increased mortgage rates and higher prices have merely resulted in a deceleration in the increase in new housing sales and construction, or whether housing is actually rolling over.
As I've written several times in the last month, there is accumulating evidence that it is actually the latter: housing has at very least plateaued. The acid test will be what happens in the next four months. Here's why.
(As an aside, as I recently learned from reading a biography of Mark Twain, who hid out during the Civil War in Nevada and California, the "acid test" is a real thing. Real gold does not dissolve in acid, but "fool's gold" a/k/a iron pyrite, does. So there.)
(As an aside, as I recently learned from reading a biography of Mark Twain, who hid out during the Civil War in Nevada and California, the "acid test" is a real thing. Real gold does not dissolve in acid, but "fool's gold" a/k/a iron pyrite, does. So there.)
Let's start by going back seven years, which is the last time mortgage rates were higher than they are now, and before house prices bottomed. Here's what mortgage rates (blue, left scale) and the least volatile housing metric, single family housing permits (red, right scale), look like:

Note a few things:
- mortgage rates declined nearly 2%, from 5% to 3.3%, from 2011 through mid-2013.
- during that big decline, single family permits rose over 60%.
- during the "taper tantrum" of 2013, mortgage rates rose back to 4.6%
- permits stalled for a year after the tantrum, and established a new, less steep trend line that was broken to the downside by this week's August housing permits report.
- after mid-2013, mortgage rates established three meaningful intermediate lows: in early 2015, mid-2016 (due to "Brexit"), and mid-2017.
- each of these three intermediate lows in mortgage rates coincided with a temporary acceleration of the growth in housing permits
- mortgage rates have just made a new 7 year high, reaching 4.87% this week.
Now let's zoom in on the last 2 years. This second graph is the same data as the one above, except I have normed single family permits to 100 as of July 2016:

Note that permits rose 13% between July and December 2016, and rose another 9.7% between August and December of last year. Both of these surges took place during the temporary declines in mortgage rates, and stopped when rates ratcheted higher.
In other words, despite jumps in mortgage rates in late 2013 and early 2017, the trendline in permits only decelerated compared with its longer term trend. Aside from this month's permits report, they never actually rolled over.
The difference this year is that there has been no decline in interest rates: in fact, since March, mortgage rates have actually headed slightly higher. Further, depending on the measure, house prices, as shown in the graph below, are roughly 40% to 50% higher than they were at their bottom in 2011 -- far in excess of household income growth:

So, here is my bold forecast: unless mortgage rates decline below 4.5% in the next few months, there will be no autumn surge in permits such as there was in the last two years. Similarly, at very least no meaningful new high will be established in single family permits (more than 2% above February's number), and more likely than not, there will be no new high at all.
And since the Fed seems bent on raising interest rates next week, unless there is to be a yield curve inversion, mortgage rates are quite unlikely to decline below 4.5%. They may even go higher.
Thursday, September 20, 2018
Housing has at very least plateaued
- by New Deal democrat
First of all, my extended take on yesterday's report on August housing permits and starts, "The most important single housing report in the last 7 years," is up at Seeking Alpha.
While housing starts remain in a weak uptrend, I have downgraded housing permits overall to neutral, and single family permits to a slight negative.
This morning's report on existing home sales for August just adds more confirmation that housing is at very least plateauing.
While month over month sales were unchanged, they were tied for a 12 month low. Further, existing home sales have not made a new monthly high since last November, 9 months ago. The 3 month average has not made a meaningful new high since April of last year.
The median price of an existing home, at $264,800, continues to outpace wage growth, up 4.6% YoY, and a slight YoY% increase from last month.
(The NAR is picky about other sites posting graphs of their statistics, but if you want to see graphs of the above information, they are at this link on the NAR site.)
The recent further increase in mortgage rates is also only going to put more pressure on housing.
This quote from this morning's report sums up the situation pretty well:
“Rising interests rates along with high home prices and lack of inventory continues to push entry-level and first time home buyers out of the market,” said [NAR spokesman Lawrence] Yun. “Realtors continue to report that the demand is there – that current renters want to become homeowners – but there simply are not enough properties available in their price range.”Unless next week's new home sales report contains an unexpected positive surprise, the rating on the overall housing market is a slight negative, meaning downward pressure on the overall economy beginning next summer.
Wednesday, September 19, 2018
Housing: a big miss in permits with important ramifications
- by New Deal democrat
NOTE: I'll have a more comprehensive report up at Seeking Alpha later, and will link to it once it is posted.
Despite a smart month over month increase in starts, this morning's report on housing permits and starts, taken as a whole, was a sharp negative.
It's true that starts, both in total and for single family units only, were higher than their readings from the last two months. This is something that I forecast one month ago, because permits had had a couple of good months, and starts tend to follow permits with about a one month lag. But they were below every other reading but one for this entire year.
Permits were another story entirely. Last month I said that I expected them to stagnate, based on higher mortgage rates this year. They did even worse than that. Total permits came in at a 12 month low, and are down -5.7% YoY, and down -12% from their March high. This is recession watch territory. The less volatile single family permits came in at an 11 month low. While they are still up +2.1% YoY, they are down more than -7% from their February high. This is also enough to turn this important long leading indicator negative, as we have gone 6 months without a new high and are down over -5%.
The data isn't up on FRED yet, so here is the Census Bureau's graph:

This, by the way, is in line with the recent weekly data on purchase mortgage applications, which has been running essentially flat YoY.
Bottom line: this is big news with important ramifications
Tuesday, September 18, 2018
A hypothesis for Prof. Krugman: the transmission method was FEAR
- by New Deal democrat
In his recent column disagreeing with Ben Bernanke, Paul Krugman asks for an explanation as to how a financial panic could lead to years thereafter of a slow recovery. Specifically, Krugman says that he "really really wants to hear about the transmission mechanism."
After all, the financial panic eased in 2009. And yet, outside of the very noteworthy exceptions of corporate profits generally and Wall Street bank profits specifically, the economic recovery was lethargic.
Now, to a great extent, the debate between "credit event" and "housing event" is somewhat a semantic one. You simply don't get a housing bubble unless there is a credit bubble to enable it. Similarly, absent a credit bubble in consumer lending for either housing (the 2000s) or appliances and furniture (the 1920s), you don't get a big consumer downturn (see, e.g., 2001, in which consumers sailed right through a brief and shallow recession brought on in large part by a stock market bubble. See also the quick late 1980s recovery from the 1987 stock market crash).
But if you are looking for a transmission mechanism that lasted after 2009, as usual you have to look beyond narrow-minded neoclassical economy orthodoxy. Because from a behavioral point of view, the answer looks pretty simple: FEAR.
Behavioral economists have shown that people in general react twice as strongly to the fear of a loss vs. the anticipation of an equivalent gain. A good example in the everyday economy is that consumers cut back spending twice as sharply in the face of an oil price spike, as they loosen their spending in the face of a steep decline in gas prices.
It is crystal clear that the financial panic of September 2008 instilled fear in the vast mass of households. I believe that there is very good evidence that it persisted for most of this decade.
To begin with, here is a graph of consumer confidence as measured by the University of Michigan:

I have zoomed in on 2007-2015, because i want to emphasize that consumer confidence did not rebound meaningfully at all once it crashed in 2008, until about 2014. Furthermore, any time there was a whiff of renewed crisis during that timeframe, confidence plummeted, in the case of the 2011 "debt ceiling debacle," all the way back to its bottom, but also in response to the Deepwater Horizon massive oil spill (2010), the "fiscal cliff" (end of 2012) and the GOP's government shutdown (2013).
That, ladies and gentlemen, is fear.
Meanwhile, households didn't just deleverage out of debt during the 2008 financial panic, but they continued to deleverage and deleverage and deleverage all the way until late 2014 -- well after housing prices had bottomed (red in the graph below):

and they haven't meaningfully increased their exposure to debt since.
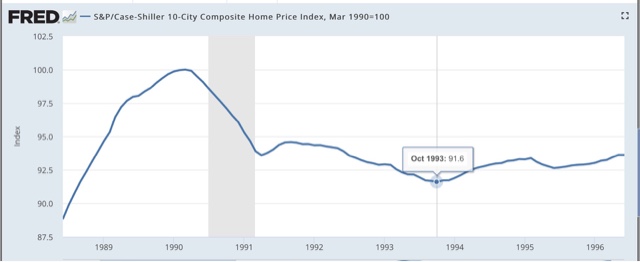
Further, there was a housing boom from 1986-88 without a credit bubble. Afterward house prices declined 10% into the early 1990s:
But the below graph of the personal savings rate shows that, unlike the 1990s, when the household savings rate went into a sustained decline, as household debt levels increased (see first graph above), following the great recession, the savings rate maintained its higher level, with the exception of 2012-13 when a one year 2% rebate of Social Security withholding taxes that resulted in higher spending, which resulted in a one year decline in saving when it expired:

So, I believe a good case can be made that the "transmission mechanism" that Krugman seeks is that the trauma of the 2008 financial crisis instilled a continuing sense of fear in consumers that there might be a repeat, leading to a shunning of debt and a resulting more subdued increase in the consumption that is 70% of the U.S. economy.
Monday, September 17, 2018
A detailed look at Industrial Production during this expansion
- by New Deal democrat
In the past week there's been a little highbrow relitigation of the drivers of the "Great Recession" between Paul Krugman and Ben Bernanke. Bernanke plumps for it having been a "credit event" -- and as to the crisis of 2008, he is clearly correct -- while Krugman says it was primarily a "housing event," although Krugman also acknowledges that he is mainly speaking of the aftermath from 2009 onward.
Since neither the 10% decline in housing prices between 1989 and 1992, nor the NASDAQ internet bubble of 1999-2000 managed to cause the worst downturn in 75 years, my own view is that it was precisely because there was a credit bubble in the biggest asset that is owned by a majority of Americans -- for which there was no financial help forthcoming to the middle class -- that the effects were so longstanding. Had the government -- as it did for the 1930s Dust Bowl -- bought up or crammed down existing mortgages, and took repayment of the loans out of housing appreciation whenever the owners eventually sold, it is likely that the consumer rebound from the recession bottom would have been much more "V"-ish.
But neither Krugman nor Bernanke, so far as I can tell, mentions a third important reason for the slowness of the recovery: the second installment of the China shock. Because it is crystal clear that businesses decided, once demand picked up beginning in late 2009, to move plants and hiring overseas.
This is plain when we look at how employment recovered. Services employment recovered in relatively "V"-ish fashion: two years down and three years up. Even goods employment ex-manufacturing came back in more delayed fashion, and is at 97% of peak 2007 levels. But manufacturing employment only began to turn very late and, at 92.5% of peak 2007 levels, is still far behind:

When we look at industrial production itself, a similar pattern unfolds: mining production, led by fracking, took off quickly, while manufacturing industrial production turned more slowly, and has never recovered all the way back to where it was in 2007. In other words, IT'S NOT JUST ROBOTS!!!

At the beginning of this year, I said that a big question for 2018 would be whether the US economy was booming. At that time, I concluded it was not because, while unemployment was very low, wage measures were lackluster, and industrial production had not reached a sustained level of at least 4% that typified the 1960s or late 1990s.
Well, while wages have improved a little, they are still lackluster. But industrial production, measured as a whole, has finally exceeded 4% YoY, at 4.9%, as of August:

But, alas, it turns out that this surge in production is also narrow. When we sort out production between manufacturing and mining, here's what we get:

Manufacturing production growth exceeded 5% per year for almost all of the 1960s, and for much of the 1990s. But even now it is only up 3.1% YoY, while mining has exceed 10% growth YoY for much of the past 10 years.
In short, the "boom" in industrial production is really just an energy sector boom. US manufacturing is only showing mediocre growth.
Subscribe to:
Posts (Atom)