Saturday, January 22, 2022

Weekly Indicators for January 17 - 21 at Seeking Alpha


 - by New Deal democrat

My Weekly Indicators post is up at Seeking Alpha.

A few months ago, in the midst of the Boom, virtually every indicator across all time spectrums was positive. In the past months, we have begun to see the deterioration in that situation, as every week one or two more indicators in one or another part of the time spectrum have shifted to neutral or negative.

This doesn’t mean that the situation is negative; more like that it is normal, with some negatives and neutrals, put still a majority of positives.

As usual, clicking over and reading will bring you up to the moment on the relevant leading and coincident economic data, and will bring me a little cash for my grocery shopping.

Friday, January 21, 2022

Coronavirus dashboard: Omicron has peaked; now what?


 - by New Deal democrat

Let’s start out with the good, or at least less catastrophic news: it’s almost certain that the Omicron wave has peaked in the US. In fact, the only Census region it is still up week over week is in the Midwest:
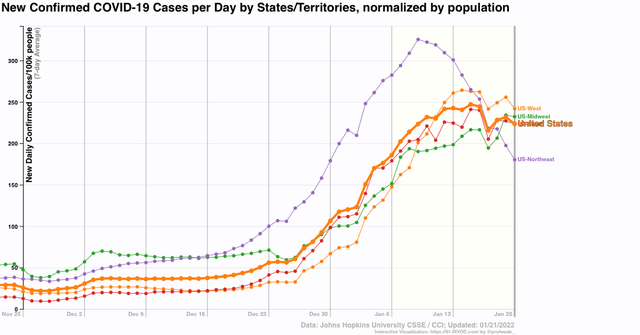

In almost all of the areas hit hard early - Puerto Rico, and the NYC and DC metro areas - cases are down sharply since peaking. Additionally cases are down substantially in California, Florida, and Illinois:
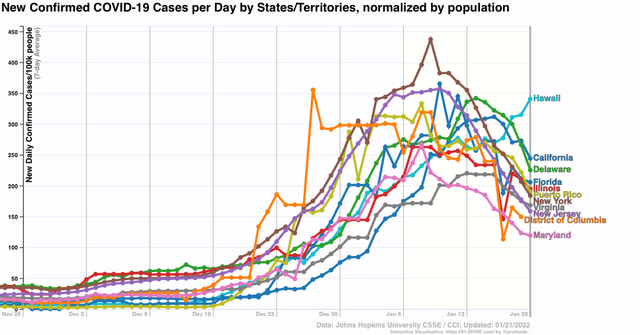

Only Hawaii, anomalously, has continued to increase.

This follows the pattern set in South Africa, where cases are now down over 80% from their peak, and deaths have plateaued after a 5 week lag:
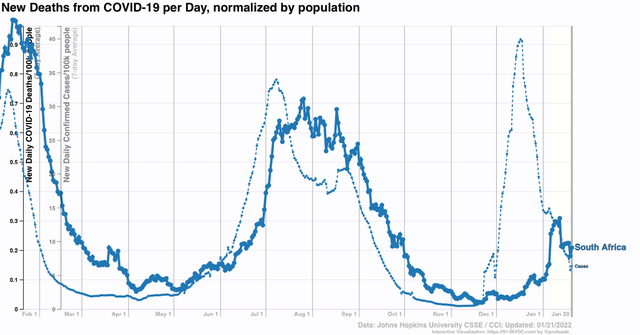

Note that deaths have increased less than cases in each of the last two waves, and only increased about 30% as much as cases during Omicron.

The situation is similar in the UK:
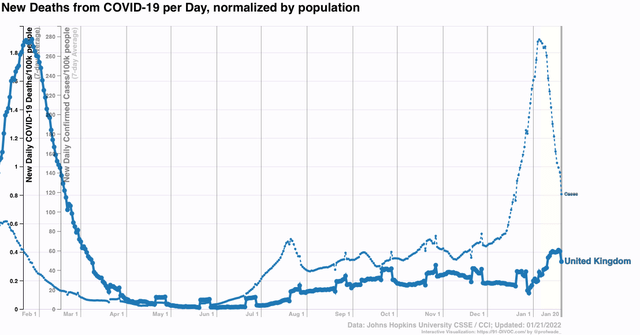

It appears the US will follow a similar trajectory with deaths, which probably will peak at under 2500 per day in late February:
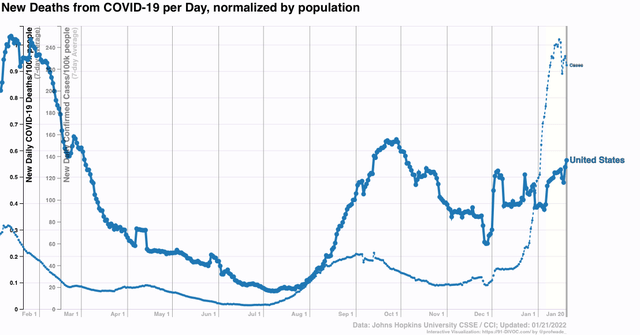


Returning to the US, although I won’t bother with a graph, cases are only up 10% or more in the past week in the States of AK, AL, AZ, HI, ID, KS, MT, KY, LA, NE, NV, NM, ND, OK, SC, TN, UT, WV, and WY. Hospitalizations have peaked simultaneously with cases, which suggests either a capacity or triage issue, and/or people are reluctant to seek treatment there. ICU admissions are still slowly increasing:
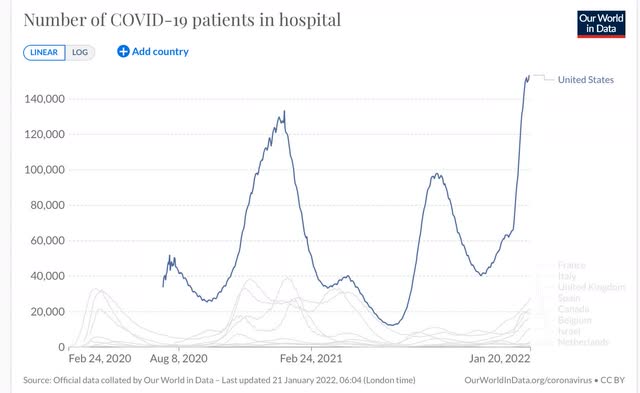

Because of the capacity/triage/reluctance issue, it is unclear the extent to which hospitalizations rose less steeply than cases,  Hospitals will remain under severe strain for several more weeks.

If cases in the US decline roughly as a mirror image of how they rose during Omicron, what next?

Trevor Bedford, the biostatistician whose work has been invaluable throughout the pandemic, has a guess: 


“We estimate that as of Jan 17 the US as whole has had a cumulative ~15M confirmed cases of Omicron, or approximately 4.5% of the population recorded as confirmed cases. The large majority (>90%) of these accumulated since Dec 14

Assuming between a 1 in 4 and 1 in 5 case reporting rate suggests that between 18% and 23% of the country was infected by Omicron by Jan 17, with the large majority infected in a span of just ~4 weeks.

“There may be a longer tail of circulation after the peak (as seen in South Africa), but a rough expectation would have an equivalent number of cases in the next 4 weeks on the other side of the peak. This would suggest 36-46% of the US infected by Omicron by mid-Feb. 

“My big question now is to what extent will Omicron-like emergence events characterize "endemic" circulation of SARS-CoV-2? Given it occurred once, having it occur again would not be at all surprising, but I don't know whether to expect this every year or every ten.”

Note the big assumption that only 20% to 25% of all COVID cases under Omicron have been “confirmed,” with the rest flying under the radar.

My own rule of thumb has been a ratio of 2:1 or 2.2:1. The reason for this is the experience of North and South Dakota one year ago, where there were massive outbreaks - the biggest of any States before Omicron - one year ago, with 60% of all tests being positive. That hasn’t prevented both States from having Omicron outbreaks more than 50% higher than the worst of that wave:
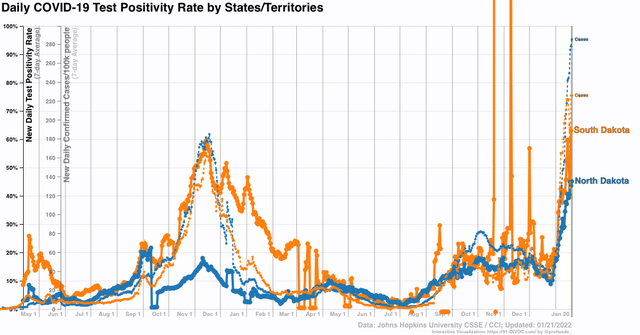

If North and South Dakota’s previous wave, with 10% of their populations having *confirmed* cases and 60% test positivity strongly suggesting a huge number of unconfirmed cases, didn’t lead to sustained resistance to reinfection, is a 10% *confirmed* outbreak in the US as a whole, with 45%+ test positivity, going to have a different result?

In other words, the situation going forward very much depends on whether and when the next unusual variant hits, and how much resistance has been obtained by the vast unvaccinated idiot population in the US. As the below graph shows, only 15% more of the US population got vaccinated in the past 7 months, despite both the Delta and Omicron waves:
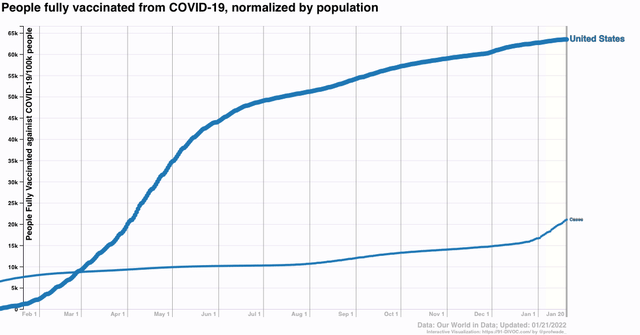

If “real” cases are 2.2x confirmed cases, then about 45% of the US population has had COVID since the pandemic started, with the distribution presumably skewed with a greater percent among the unvaccinated during the past 7 months.

With COVID circulating freely among wild mammal populations (and domesticated cats as well), there are going to be more variants. Our best hope is that Trevor Bedford is right, and in general most succeeding waves of COVID from here on exact less and less of a toll, with occasional bigger spikes. For my part, I continue to be hopeful that there will be a big respite in spring.

Thursday, January 20, 2022

Omicron and seasonality bedevil new jobless claims


 - by New Deal democrat

It is likely that the effects of Omicron as well as quirks of seasonality were behind this week’s big jump in new jobless claims.

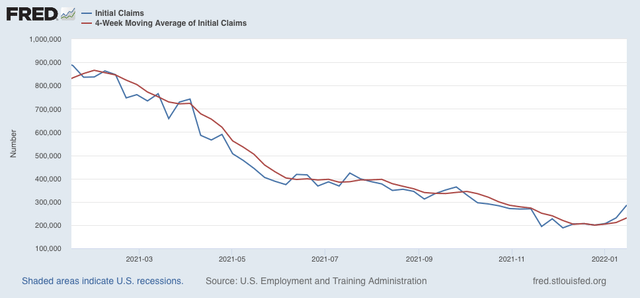
New claims jumped 55,000 on a seasonally adjusted basis last week to 286,000. The 4 week average of new claims increased 20,000 to 231,000:


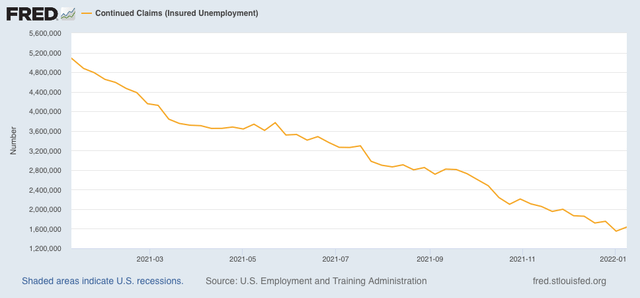
Continuing claims for jobless benefits rose 84,000, to 1,635,000, which is still very close to a 50 year low (not shown):


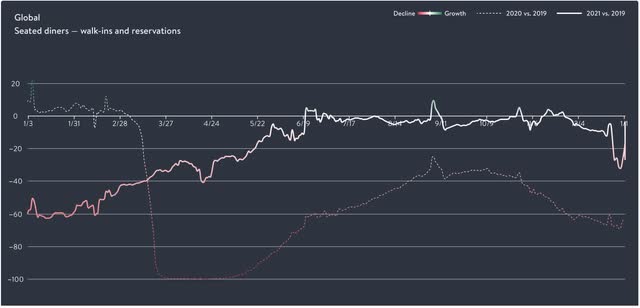
There are probably two reasons for the big jump in new claims. The first is Omicron. We won’t have the State by State breakdown for one more week, but it would hardly be surprising if the big increases were most profound in those States hardest hit by Omicron in the previous weeks (generally, the NYC and DC metro areas). Certainly in the last several weeks Omicron has hit restaurant reservations, which have declined by 25% or more compared with a year ago (graph shows global reservations, but US reservations are nearly identical):


Layoffs in the service industries as a result of gigantic rises in infections would not be a surprise at all.

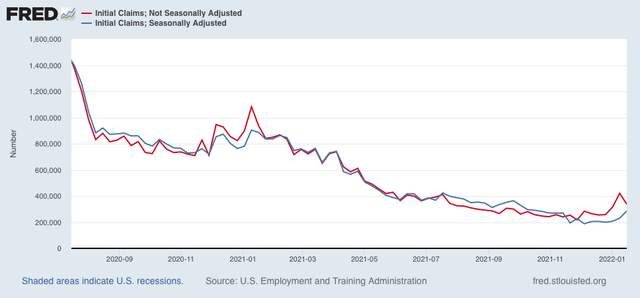
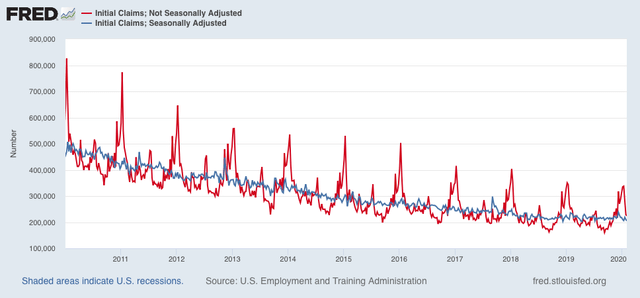
Secondly, here is a comparison of seasonally adjusted (blue) vs. not seasonally adjusted (red) claims in the past 18 months:


Note that in the corresponding week last year non-seasonally adjusted claims were no higher than seasonally adjusted. This year they failed to decline to that level. More generally, non-seasonally adjusted claims typically are below the seasonally adjusted number from August through November, and then rise to a peak in the second full week of January, as shown above, and also below in this graph of the 10 years just before the pandemic:


The past 6 months have resulted in levels of new claims equivalent to the range of those  during 2016 and 2017, except that typically claims rise slowly during autumn from a low point in August, and in 2021 they declined slowly through autumn. Because of the typically sharp declines from peak in new claims in mid-January, something as simple as the creep of the days of the week for equivalent dates can make a big difference. In other words, next week there may be a much bigger drop than there was for the equivalent week in 2016 and 2017.

The effects of Omicron are going to continue for at least a few more weeks. The quirks of seasonality should resolve after another week. Until I see more going on, I do not see any reason to overreact to the last two weeks’ big increase in claims.

Wednesday, January 19, 2022

Housing ends 2021 with a bang


 - by New Deal democrat

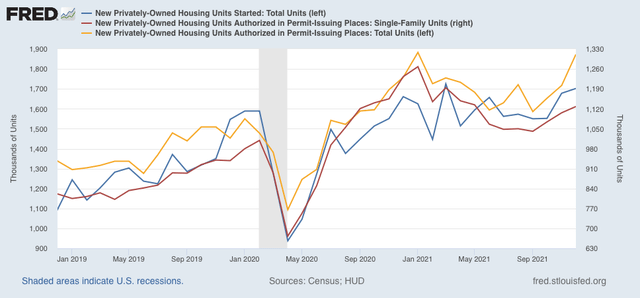
Housing ended 2021 with a bang, as housing starts (blue in the graph below, left scale) increased to 1.702 million annualized, and permits (gold) to 1.873 million annualized, in both cases the highest level since 2006 with the sole exception of last March / January, respectively. Single family permits (red, right scale), which are the least noisy, increased to 1.128 million annualized, the highest reading since May, but well below the 8 months previous to that:


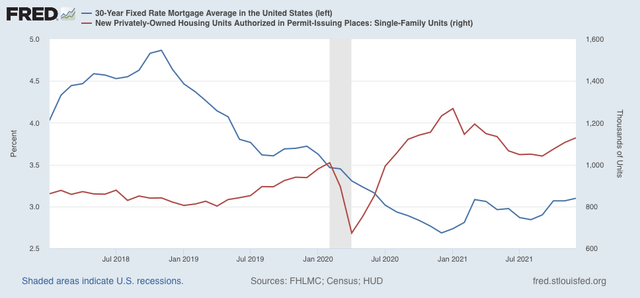
Because this is December data, even though it is seasonally adjusted, it may still be affected by Christmas seasonality, as exacerbated by the pandemic (right scale below). To some extent it may also be a reaction to the recent increase in mortgage rates (blue, left scale) off their bottom:


We have seen this dynamic before, where prospective homeowners, seeing an increase in mortgage rates and expecting more, “lock in” purchases before they become more expensive. 

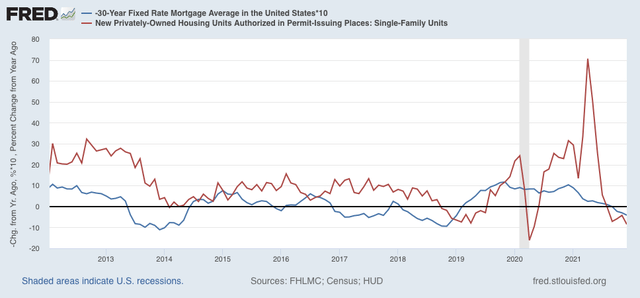
Below is the same data on mortgages and single family permits, but presented YoY:


This makes it easier to see that housing permits have historically followed mortgage rates (inverted), with a 3 to 6 month lag. Mortgage rates have turned higher than they were 1 year ago, and permits have turned lower than one year ago.

According to Mortgage News Daily, mortgage rates yesterday averaged 3.7%, the highest in over a year. Should these higher rates continue, we can expect a significant decline in new housing permits and starts in the next few months.

In the meantime, because housing permits and starts are an important component of the long leading indicators, this data will play an important role in my long term forecast, which will be determined after data for Q4 GDP is reported next week.

Tuesday, January 18, 2022

Short term economic forecast through mid year 2022


 - by New Deal democrat

My short term forecast for the first half of this year is up at Seeking Alpha.

This forecast is based on the same system I have successfully used since before the Great Recession. Most forecasters, deliberately or not, cherry pick data points to fit a previously arrived at intellectual point of view, and simply project the current trend ahead (or else default to the inevitable “We’re DOOOMED!). The short leading indicators, in contrast, forecast a change in the trend before the lion’s share of the data is affected.

Clicking through and reading will give you a good idea of what is ahead from now till the 4th of July, and will pay for some bourbon and firewood to help get me through the cold winter nights still ahead.

Monday, January 17, 2022

Fox News and white grievance


 - by New Deal democrat

In his recent book “Kill Switch,” Adam Jentleson, a former aide to the late Senator Harry Reid, persuasively argues that the Senate filibuster arose by accident, when a rule revision in 1805 failed to include the “previous question” resolution, which would require a vote on the issue pending, because it was thought superfluous. He also shows by overwhelming evidence that for the past 200 years, by far the single most common use of the filibuster was to defeat civil rights legislation benefiting Blacks.


And in the past week, it has become apparent that Senators Manchin and Sinema would join GOPers to uphold a filibuster against voting rights legislation once again. 

Which brings me to a couple of recent graphs posted by Kevin Drum. He is the sort of commentator I read, even though I frequently disagree with him, because his arguments are worthy of thinking through, and sometimes he finds genuine gold nuggets.

An example of the former is when he argues,  as he did today  , that “the progressive wing of the party [“blew it” by] insist[ing] on pushing voting rights laws that had zero chance of passing. Biden knew this from the start and said so. Then Bernie Sanders insisted on an insane BBB bill that would have been unprecedented in the history of the country,” and as a result is responsible for “Joe Biden's disastrous approval rating and the chaotic shape of the Democratic Party.”

I am trying to think of the counterfactual situation where the progressive wing of the Democratic Party simply allowed the infrastructure bill to pass and then sat back somnolently while nothing else happened. Somehow I fail to see that Joe Biden’s approval rating would be any better. Hmmmm . . . I rather think that, whether they articulate this blame or not, the public is really pissed off at being governed by John Roberts’ reactionary 6 on the Supreme Court, with an assist by co-Presidents Manchin and Sinema, and that the attempt by progressives to get more done has not worsened this perception.

But, as an example of the latter, Drum has shown very persuasive data many times showing that the decline in the crime rate since the early 1990s correlates really well with the abatement of lead paint beginning 20 years before. Less lead poisoning in boys leads to less crime in young men 20 years later. Q.E.D. And it really does seem to be true.

Anyway, that brings me to the point of today’s post. Because recently Drum has also been arguing that the main source of the US’s turn to proto-fascism has overwhelmingly been Fox News (much moreso than even Facebook). Below are a couple of graphs he has posted over the past several months to that point.

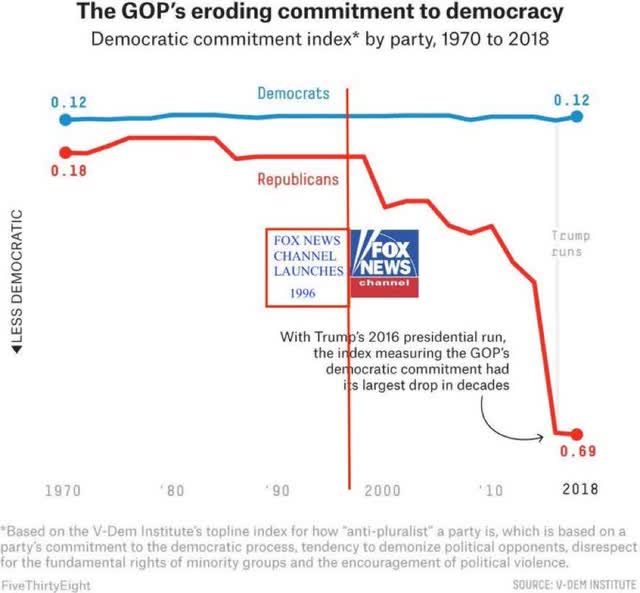
First, commitment to democracy in the US by political party:


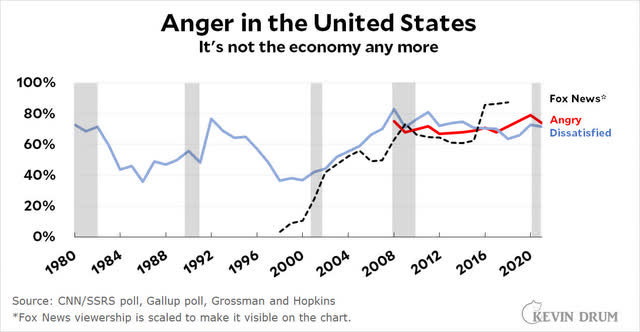
Second, anger or dissatisfaction with the direction of the country in the United States:


While correlation is not causation, it is certainly true that Fox News’s almost entire worldview of white grievance overlays quite well with both the collapse of commitment to democratic institutions by GOPers, and anger at the direction of the country.