Saturday, March 5, 2016
Weekly Indicators for February 29 - March 4 at XE.com
- by New Deal democrat
My Weekly Indicators post is up at XE.com.
This is one of those time when watching the high frequency data is so important, because the trends do appear to be changing.
Friday, March 4, 2016
February jobs report: solid headlines, decidedly mixed internals
- by New Deal democrat
HEADLINES:
- +242,000 jobs added to the economy
- U3 unemployment rate unchanged at 4.9%
With the expansion firmly established, the focus has shifted to wages and the chronic heightened unemployment. Here's the headlines on those:
Wages and participation rates
- Not in Labor Force, but Want a Job Now: down -103,000 from 5.973 million to 5.870 million
- Part time for economic reasons: unchanged at 5.988
- Employment/population ratio ages 25-54: up +0.1% from 77.7% to 77.8%
- Average Weekly Earnings for Production and Nonsupervisory Personnel: unchanged at $21.32, up +2.4%YoY. (Note: you may be reading different information about wages elsewhere. They are citing average wages for all private workers. I use wages for nonsupervisory personnel, to come closer to the situation for ordinary workers.)
The more leading numbers in the report tell us about where the economy is likely to be a few months from now. These were neutral to negative.
- the average manufacturing workweek was unchanged at 41.8 hours (but last month was revised up +0.1. This is one of the 10 components of the LEI, the net will be a posittive.
- construction jobs increased.by +19,000. YoY construction jobs are up +253,000.
- manufacturing jobs decreased by -16,000, and are up +25,000 YoY.
- Professional and business employment (generally higher-paying jobs) increased by +23,000 and are up 604,000 YoY.
- temporary jobs - a leading indicator for jobs overall decreased by -9,800.
- the number of people unemployed for 5 weeks or less - a better leading indicator than initial jobless claims - increased by +48,000 from 2,249,000 to 2.297,000. The post-recession low was set 6 months ago at 2,095,000.
Other important coincident indicators help us paint a more complete picture of the present:
- Overtime was unchanged at 3.3 hours.
- the index of aggregate hours worked in the economy fell by -0.4 from 105.3 to 104.9.
- The broad U-6 unemployment rate that includes discouraged workers declined from 9.9% to 9.7%.
- the index of aggregate payrolls fell by -0.7 from 127.8 to 127.1.
- the alternate jobs number contained in the more volatile household survey increased by +520,000 jobs. This represents an increase of 2,843,000 jobs YoY vs. 2,673,000 in the establishment survey. [Note: I updated this to correct an error, as I originally had +555,000 jobs for this]
- Government jobs rose by +12,000.
- the overall employment to population ratio for all a ges 16 and above -rose by 0.2 from 59.6 to 59.8 m/m and +0.5% YoY. The labor force participation rate rose 0.-1% from 62.7% to 62.9% and is now up +.0.1% YoY (remember, this incl udes droves of retiring Boomers).
The headline numbers - strong job gains, and a decline in the broad U6 underemployment rate - are certainly welcome.
Other significant positives included positive revisions to the last two months, an increase in both the employment to population ratio and labor force participation rate, and a decline in those out of the labor force who want a job now (but still about 1.4 million above its 1999 and 2007 lows).
But there were some significant and/or worrisome negatives as well. Last month's big increases in wages and hours were partially reversed. More worrisome was the establishment of a trend in declining temporary jobs (a leading indicator for overall employment), and negatives in two other leading sectors: a rise in short term unemployment, and a loss of manufacturing jobs
In short, while the strong positives in coincident measures of employment are certainly welcome, the decline in some important leading indicators for employment raises a significant yellow flag.
Thursday, March 3, 2016
February ISM manufacturing suggests slowdown still has a ways to go
- by New Deal democrat
I wrote a month ago that before either an inventory slowdown or a recession end, the new orders sub-index of the ISM Manufacturing Index turns up first. The inventories component tends to trough at the end of a recession, or sometimes bounce along a bottom for a few months.
Last month I compared ISM new orders (red in the graph below) with real GDP. A similar order occurs with Industrial production (blue):

It was encouraging one month ago that new orders were above 50 showing expansion.
So what happened this month? Once again new orders were positive (red in the graph below). Inventories, however, also ticked up slightly (blue):

Note, by the way, that both new orders and inventories are consistent with levels we saw during past non-recession inventory corrections, in 1996, 2002, and 2012.
For me to be confident that this slowdown was ending, I would want to see new orders spike to at least 54. They didn't do that. That doesn't mean that I expect things to get worse. In fact there are encouraging signs in things like steel production and rial shipments that we may have bottomed. The failure of new orders to pick up means at least that we aren't out of the woods yet.
Wednesday, March 2, 2016
Houses and cars put up a yellow flag
- by New Deal democrat
I have a new post about the two most leading sectors of the consumer economy - housing and cars - up at XE.com.
Tuesday, March 1, 2016
The danger of Donald Trump the demagogue: What Larry Summers Said
- by New Deal democrat
Apologies for the light posting this week. I'm travelling again.
No photo this time, but I just paid $1.49 a gallon for gas. I wonder if i will ever see a price that low again in my lifetime. Yesterday morning at hotel breakfast, I had an unpleasant encounter with an odler white couple badmouthing CNN for calling Trump on at least not knowing that he ought to refuse support from the KKK.
Which brings me to Larry Summers, who makes the best case I have read to date on why Trump's popularity is so dangerous:
The possible election of Donald Trump as President is the greatest present threat to the prosperity and security of the United States. ... [N[ever before had I feared that what I regarded as the wrong outcome would in the long sweep of history risk grave damage to the American project.
The problem is not with Trump’s policies, though they are wacky in the few areas where they are not indecipherable. It is that he is ... demagogically offering the power of his personality as a magic solution to all problems—and making clear that he is prepared to run roughshod over anything or anyone who stands in his way. ...
Donald Trump is the type of demagogue the founders warned us about. Well put, Larry Summers.
Monday, February 29, 2016
Fed rate hikes and rents: What Dean Baker says
- by New Deal democrat
Dean Baker notices that, excluding shelter, consumer prices have only "surged" from negative to +0.4% YoY:
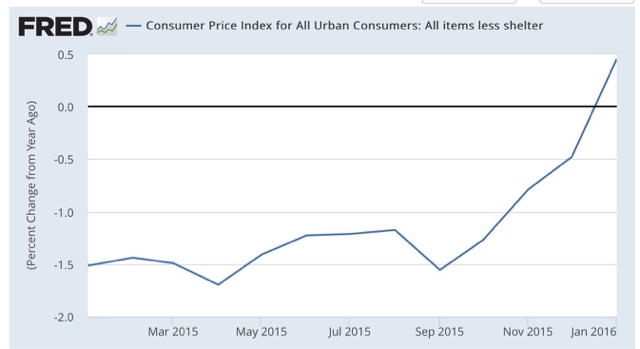
Which still makes YoY inflation ex -shelter still close to its lowest value in 70 years:

He says:
If higher inflation is being driven by rising rents, it is not clear that higher interest rates are the right tool to bring prices down. Every Econ 101 textbook tells us about supply and demand. The main factor pushing up rents is more demand for the limited supply of housing. The best way to address this situation is to construct more housing.
But housing is perhaps the most interest sensitive component of demand. If we raise interest rates, then builders are likely to put up fewer new units. This will create more pressure on the housing stock and push rents up further.
Sunday, February 28, 2016
Subscribe to:
Posts (Atom)