Friday, May 28, 2021

Real personal income has completely made up its recession losses, now exceeds pre-recession peak


 - by New Deal democrat

The last of the 4 monthly coincident markers for whether the economy is in recession vs. expansion was reported this morning for April. Let’s take a look.


In nominal terms, personal income declined -13.1%, taking back most, not by no means all, of March’s big 20.7% gain. After taking inflation into account, in real terms it declined -13.7%. Meanwhile nominal personal spending increased 0.5%, but in real terms declined -0.1%, barely touching March’s 4.0% gain:


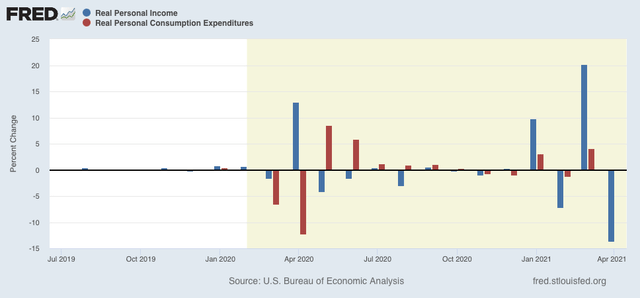
An issue came up at Seeking Alpha about why I believe that demand-driven inflation will be transitory. The above graph shows why. After 2020’s big stimulus package, real personal spending increased sharply and then the effect completely dissipated over a few months. It appears that the same is already happening this year. Which would only leave supply-side temporary bottlenecks in production as sources of continued inflation.

Below I’ve take then same data as above and normed both to 100 as of February 2020:


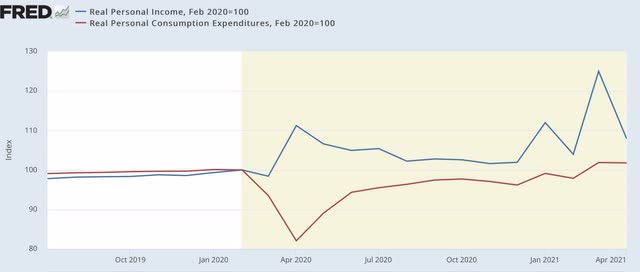
Both real income and spending are above their pre-recession levels. Simply put, in this crisis decisive action by the government to put cash in consumers’ hands has worked.

But the “official” recession vs. expansion metric is real personal income less transfer receipts (things like unemployment insurance), shown below:


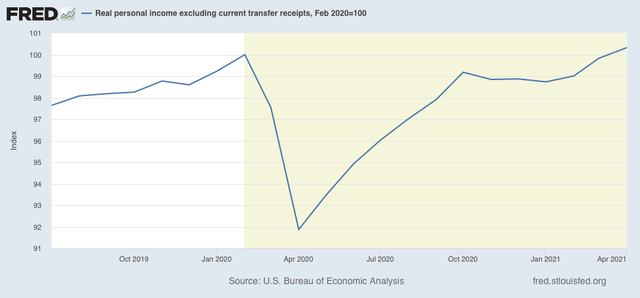
This too is now above its pre-recession levels. Although I won’t post a graph, this joins real sales making up all of its lost recession ground. But the two most important metrics - industrial production and employment - still have a ways to go.

Thursday, May 27, 2021

New jobless claims continue to decline at rate of 100,000 per month, while continued claims stall at elevated level


 - by New Deal democrat

New jobless claims continue to be the most important weekly economic datapoint, as increasing numbers of vaccinated people and outdoor activities have led to an abatement of the pandemic - both new infections and deaths are near their lowest points in a year. 

We have hit my objective for new claims to be under 500,000 by Memorial Day. Even better, we are already approaching my second objective, which is for them to be below 400,000 by Labor Day. 

REMINDER: Because of the unprecedented number of layoffs during the early lockdowns, for the last year I have given heightened importance to the non-seasonally adjusted numbers. After May is over, their importance recedes and I expect to discontinue tracking them.

New jobless claims declined 38,000 to 406,000. On a unadjusted basis, new jobless claims declined 34,131 to 420,472. The 4 week average of claims also declined by 46,000 to 458,750. All of these were new pandemic lows.


At the peak of the pandemic lockdowns, new claims were running 6 million to 7 million per week. Here is the trend since the beginning of last August:


In the past 3 months, claims have trended down an average of roughly 100,000 per month. If this continues for just 1 more month, new claims will be at levels which in the past have been consistent with full or nearly full employment deep into expansions. At their current level, claims are consistent with being very early in a recovery in the past:


Continuing claims, which are reported with a one week lag, and lag the trend of initial claims typically by a few weeks to several months, declined 96,000 to 3,642,000, (blue), 2,000 above their pandemic low from two weeks ago. On an unadjusted basis (red), they declined 149,996 to 3,521,314:


The long term perspective again shows that these are equivalent to the worst levels of most previous recessions, versus at 2,000,000 or below during strong expansions:


As I wrote last week, March’s employment gains may have been more of an outlier than April’s. If we simply averaged the 2 months together that would be an average jobs gain of 518,000, then the continued big decline in initial claims would give us a May jobs gain of over 500,000 when that report is issued next Friday.

I continue to think initial jobless claims will continue their recent strong decline, while the failure of continuing claims to make meaningful new lows in the past 2 months is a genuine concern that the pace of new hiring has not been picking up.

Wednesday, May 26, 2021

Comprehensive April housing report: beware the inventory and price boomerang!


 - by New Deal democrat

Now that we have all of the April housing data, my comprehensive look at this long leading sector is up at Seeking Alpha.

It’s pretty clear that sales and new construction have peaked in the short term. So, what happens when all of those people who would have put their houses on the market in 2020, but didn’t because of the coronavirus, decide to put them on the market later in 2021 or in spring 2022?

As usual, clicking over and reading puts a penny or two in my pocket to reward me for my efforts.

Tuesday, May 25, 2021

New home sales decline in April, revised sharply lower for March; prices continue to skyrocket, while inventory increases


 - by New Deal democrat

This morning both new home sales and two price indexes for houses were released for April, completing our view of that important long leading sector.


As anticipated, not only did new home sales decline for the month, but March was also hugely revised to the downside ( over 10%!):


With these revisions, the peak for new home sales becomes the December-January period, exactly as is the case for housing permits, starts, and existing home sales.

But if sales are down, prices are continuing to skyrocket:


As measured by the FHFA, prices increased 1.4% seasonally adjusted just in the past month! YoY they are up 13.9%.  For the Case Shiller national index, the monthly change was +2.0%, and the YoY change was +13.2%.

Housing inventory is increasing again, up about 3% m/m and now only down about 2% YoY, vs. a trough of being down over 12% YoY.

I’ll have more later at Seeking Alpha.

Monday, May 24, 2021

Coronavirus dashboard for May 24: 3 weeks to 0 new cases?


 - by New Deal democrat

No, that won’t happen. But, even so, that is the current trajectory. Let’s start with the overview:


Total *confirmed* cases: 33,117,737
Total deaths: 589,893

Note that there are many more cases that we don’t know about because the people were never tested. Since about half of cases appear to be only mildly or non-symptomatic, an additional 10% of the population having been infected seems like a reasonable guess. And excess deaths for 2020 ran closer to 900,000, so we may also be missing many deaths.

Before I go further, let me address an article that appeared over the weekend in the Wall Street Journal suggesting that an “intelligence source” had confirmed that it was likely that the virus escaped from a lab in Wuhan. That report seems to have convinced both Nate Silver and Matt Yglesias.

A pretty good takedown of that article appears here:

Essentially, somebody associated with an intelligence agency in the Trump Administration authored a report - but not an actual official intelligence report - in the closing weeks of that Presidency making the claim, possibly for political reasons, based on a document that is never disclosed or identified, and the document itself disclaimed that “additional corroboration” was needed. The same “information” likely was the basis of similar reports last April, one by the BBC which subsequently had to walk back its claims.

Oh.

Turning to the updated data, we are within a few days of 50% of the entire US population having received one dose. with 50% of the adult population and nearly 40% of the total population being fully vaccinated:


Deaths declined by about 7% in the past week to an average of 546/day, while cases declined almost 25%, by about 8,000 to 25,270/day:


If this decline of nearly 1,200/day, which has been going on for the past 7 weeks, were to continue for just 3 more weeks, we would arrive at 0 cases per day! The slow pace of the decline in deaths is of some concern as, if anything, I would expect that to accelerate and decline faster than new cases. So it will have to be watched.

Finally, below is a comparison of new cases over the past 8 weeks for the 5 States that have administered the fewest vaccinations per capita (MS, AL, LA, AR, and WY) vs. the 5 jurisdictions that have administered the most (VT, MA, HI, CT, and DC):


The only overlap is that of Alabama. The other 4 States with few vaccination are in the top 1/2 for new cases, while the 5 jurisdictions with the most vaccinations are in the bottom 1/2. At some point soon, the federal government may have to step in directly to administer vaccinations to willing people (probably among the minority Black population) in those States in the Deep South that have been recalcitrant.