Saturday, December 18, 2021

Weekly Indicators for December 13 - 17 at Seeking Alpha


 - by New Deal democrat

[Brief programming note: this coming week will only see existing home sales on Wednesday, and new home sales plus jobless claims on Thursday. In other words - don’t be surprised if I take a couple of days off. Omicron permitting]

My Weekly Indicators post is up at Seeking Alpha.

While the large majority of the strictly economic data continues positive in all time frames, it can be trumped at a moment’s notice by Omicron.

I expect the comments on this week’s post at that site to be “interesting,” but not in an intellectually challenging way, if you catch my drift and I think you do.

In any event, clicking over and reading will bring you up to the virtual economic moment and pay for my postage to send out all my Christmas gifts.

Friday, December 17, 2021

Coronavirus dashboard: an urgent warning about Omicron’s exponential spread


 - by New Deal democrat

Here is a graph of the growth in Omicron vs. Delta cases in London from 2 days ago:
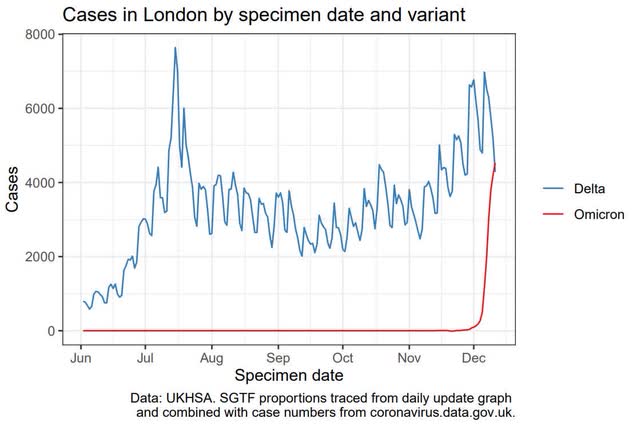

Shocking, isn’t it?

Now here is the same data, updated yesterday, just one day later:


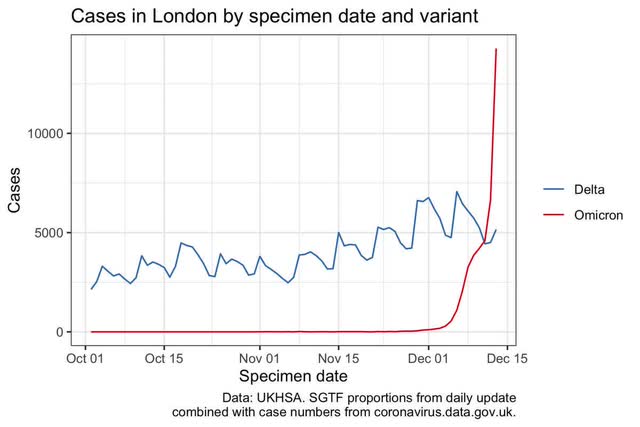
Do I have your attention? In one day, the number of Omicron cases literally went through the top of the previous graph.

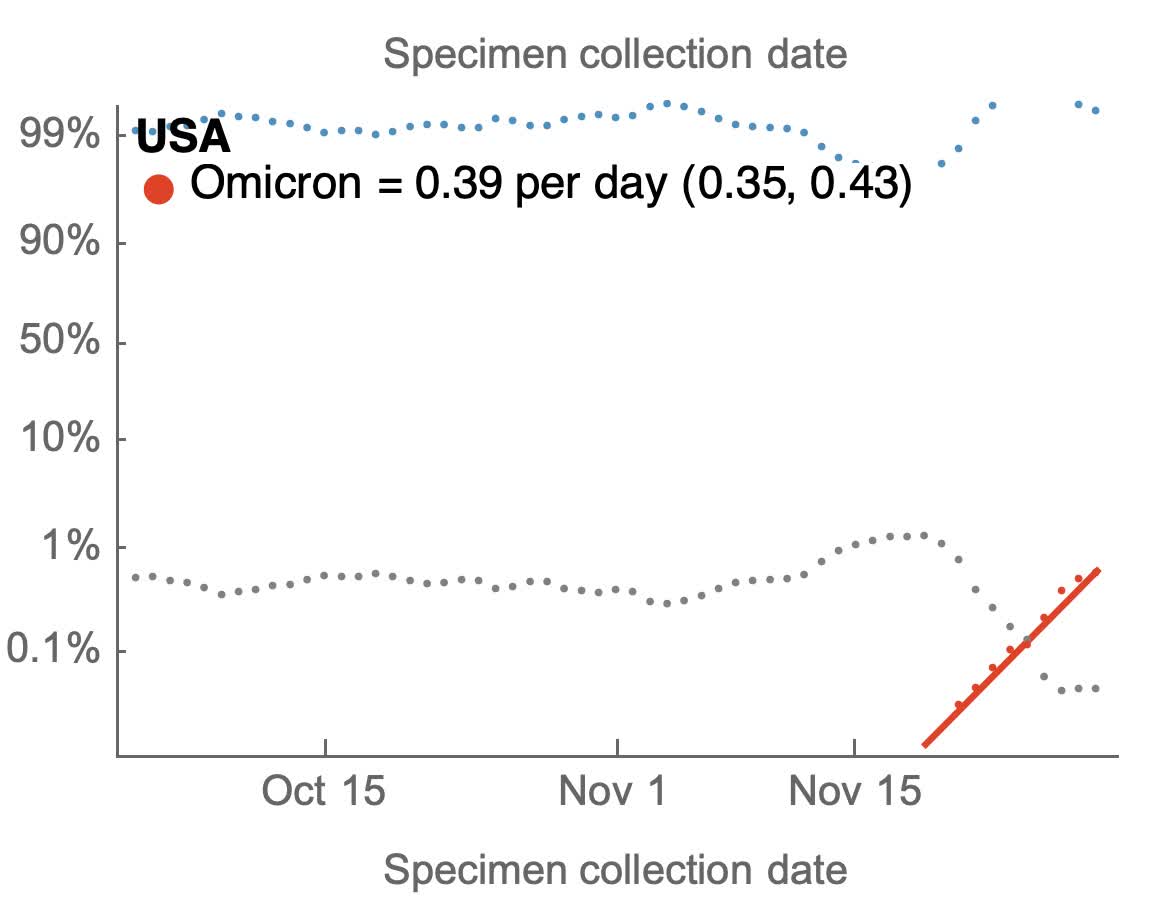
Dr. Trevor Bedford, a geneticist who was the first to demonstrate that there was community spread of Covid-19 in the US back in late February 2020, is now tracking the daily exponential growth of Omicron, with a 10 day lag because that is how long it takes for reliable testing data to be accumulated. Here are his current graph of 5 countries including South Africa, the UK, and the US:

https://github.com/blab/rt-from-frequency-dynamics/tree/master/results/omicron-countries

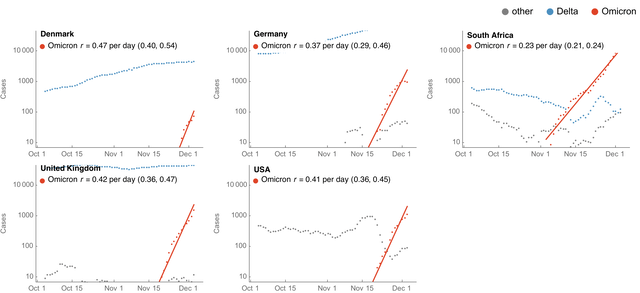
Depending on the country, the number of Omicron cases is doubling every 2 to 3 days. 

As of 10 days ago, he estimates about 1000 cases per day in the US were Omicron. If we use 3 days as the doubling time, that is close to 10,000 cases today.

Projecting that rate of growth forward, here is what we get:

- about 100,000 cases a day by December 27 

- 1 million cases a day by January 6

-10 million cases a day by January 16.

This in a health system where many hospitals have already reached their limit.

Will it get that bad? Exponential growth keeps going until, well, it doesn’t (see, e.g., Delta during July and August, peaking quickly just before Labor Day).

In that regard, in South Africa, Omicron May have peaked a few days ago, see:


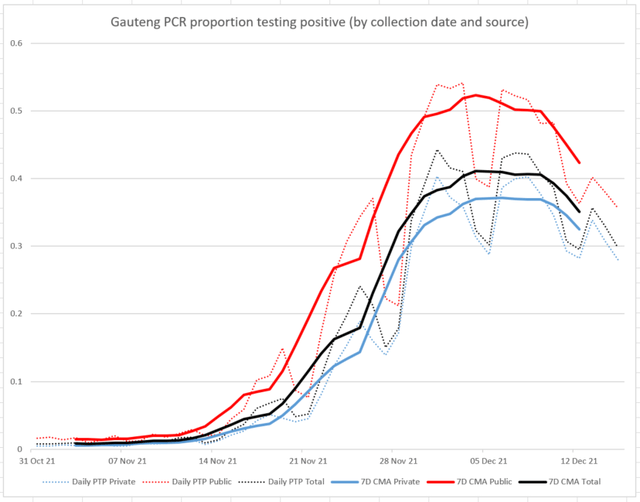
If Delta burned through the dry tinder in about 2 to 3 months, in South Africa Omicron sped that up to about 30 to 45 days.

In South Africa, cases went from 400 to 24,000 in 4 weeks, an 60-fold increase.

Two other countries with major Omicron spread, Denmark and Norway, went from 400 cases each to 8000 and 4000, respectively, a 20-fold and 10-fold increase. Interestingly (although I won’t bother with the graph, in Norway cases seem to have peaked in the last few days after 12 weeks of increase). The good news is, if South Africa and Norway are the templates, then like Delta there is a certain subset of the population that is uniquely susceptible, and once Omicron infects those people, it runs out of fuel.

Consistent with, and maybe because of this, here is Dr. Andy Slavitt:
https://mobile.twitter.com/Porter_Anderson/status/1471683867304206337

“We’re in store for a quick, fast-spreading, and hopefully soon-to-be-over wave that’s going to overwhelm hospitals. All of us who take advantage of the science will be in good shape. For the country as a whole, this is going to be a rough January.”

As cases rise, when could they peak? He says: “I talked to a dozen scientists or so in the last couple of days and the consensus seems to be forming around the third week in January.”

In the US, the post-Delta trough was about 75,000 cases per day about 6 weeks ago. A 10-fold increase like Norway would be 750,000 cases per day. A 50-fold increase, like South Africa, would be 3,750,000 cases per day.

Since the consensus spoken of by Dr. Slavitt is late in January, that appears to be consistent with the worst-case scenario.

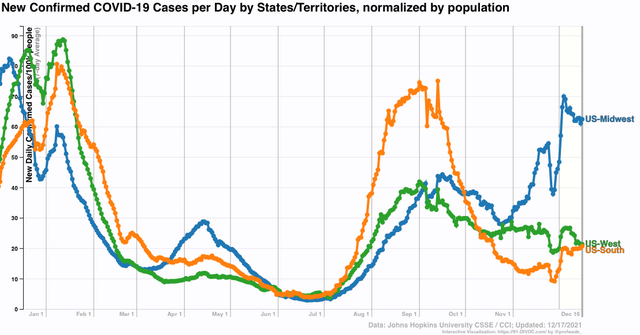
While cases in the South, West, and Midwest are generally still much better than they were one year ago at this point:


In the Northeast, where there is evidence Omicron is already a significant share of total infections, cases are already close to their all-time daily highs, and look to exceed those numbers by Monday or Tuesday:


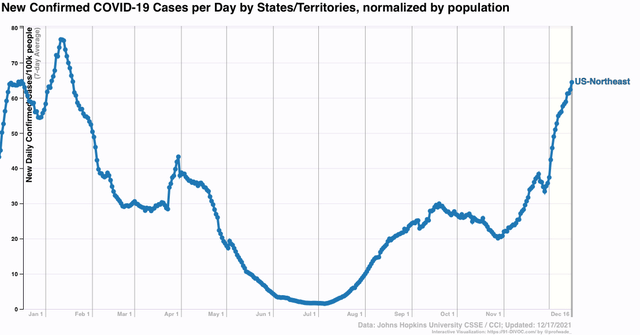
I am afraid this is what the US as a whole is looking at within a week or two, if not within days.

If the above is true, at some point between now and New Year’s Day there is going to be a March 2020 style nearly instant crash in public and economic activity.

Please use extra caution, even if you are fully vaccinated and boostered. Stay safe!

Thursday, December 16, 2021

Production, layoffs, housing hit the positive trifecta in November


 - by New Deal democrat

We got a blizzard of November and December data this morning across all three - coincident, short leading, and long leading - timeframes: industrial production, jobless claims, and housing permits and starts. All three were positive.

Let’s start with the King of Coincident Indicators, industrial production, which rose 0.5% in November. Manufacturing production rose 0.7%. They are 2.3% and 0.6% above where they were before the pandemic:


Both also are at 2.5 year highs, although below their peak levels during the last expansion. At this point the *only* important metric which has not exceeded its pre-pandemic level is employment, which as I explained last week, has a persistent 4,000,000 shortfall compared with job openings, which will only be closed once the pandemic is past (or at least mainly past).

Let’s turn now to the short leading indicator of initial and continuing jobless claims, which continue at or near their best levels in the past half-century.

Initial claims rose 18,000 to 206,000 from last week’s 50 year low, while the 4 week average declined 16,000 to 203,750, which is not just a new pandemic low, but a new 50 year low:


Once again, virtually nobody is getting laid off.

Continuing claims also declined 154,000 to 1,845,000 to another pandemic low, which in the past 45 years was only bettered during the 2 year period from March 2018 through March 2020:


Finally, let’s look at the long leading indicator of housing permits and starts, which also improved across the board in November. Total permits increased 3.6% from October, and the less volatile single family permits increased 2.7%. Housing starts increased 11.8%:


Total permits are in the upper part of their range for the past year, while both the less volatile single family permits and the 3 month average of the more volatile housing starts are solidly off their bottoms. This has been expected, since mortgage rates moderated over the summer, and permits and starts follow typically with a 3 to 6 month lag. 

In summary, the economy right now continues to hit on all cylinders except for a shortfall in employment. Over the next few months the outlook continues very positive, and looking out a full year the evidence continues to be on net, on the plus side as well.

Wednesday, December 15, 2021

Real retail sales declined in November, but continue to auger well for strong jobs growth


 - by New Deal democrat


Retail sales, one of my favorite “real” economic indicators, were reported this morning for November. They increased 0.3% for the month, and October’s blockbuster report was revised 0.1% higher, to +1.8%. After inflation, though, “real” retail sales declined  -0.5%. 

Although real retail sales are down -2.6% from their April peak, they are +12.9% higher than they were just before the pandemic hit, and are also 4.4%  higher than January of this year: 


They are also up 10.6% YoY. 

How extreme is that? The below graph subtracts 10.6% YoY growth from retail sales from 1948 through 2019:


In the past 70+ years before the pandemic, real retail sales have only been higher for about 16 months, all in the 1940s, 50s, and 60s - over half a century ago. Which, not coincidentally, is the last time the US had a very worker-strong economy. As I pointed out last month, this kind of explosive sales growth is a very important - perhaps *the* most important - driver of the transportation bottleneck, since our “just-in-time” global networks cannot handle such a sudden increase. 

Now let’s turn to employment, because real retail sales are also a good short leading indicator for jobs.

As I have written many times over the past 10+ years, real retail sales YoY/2 has a good record of leading jobs YoY with a lead time of about 3 to 6 months. That’s because demand for goods and services leads for the need to hire employees to fill that demand.  The exceptions have been right after the 2001 and 2008 recessions, when it took jobs longer to catch up, as shown in the graph below, which takes us up to February 2020:


Now here is the same graph since July 2020:


Several months ago, despite two lackluster initial jobs reports, I wrote that this “argues that we can expect jobs reports in the next few months to average out about even with those from one year ago, which averaged about 500,000 per month.”

Those months were revised well higher, which means that job growth indeed has continued to average about 500,000 per month. I fully expect the “relatively” poor November jobs report to be revised higher, and that the next few months’ jobs reports  should continue to average about 500,000 as well.

Tuesday, December 14, 2021

The state of the American consumer


 - by New Deal democrat

Yesterday I updated my alternative “consumer nowcast” fundamentals-based model of the economy, which serves as a check on my other models, and posted it over at Seeking Alpha.

Hard to believe that I first wrote up that model over 15 years ago way back when I was a fledgling diarist at Daily Kos. The one surprise has been that, back then, I didn’t think interest rates could decline further in any meaningful way. Silly me!

Anyway, for a review of the economy based on the state of the average American household, go over and take a look. Any my lunch money will thank you.

Monday, December 13, 2021

How to track the Omicron variant in close to real time


 - by New Deal democrat

No economic data today, and Covid information is pretty useless because of lack of reporting over the weekend. I drafted a long piece about the state of the American consumer, which I’ve decided to put up at Seeking Alpha, since, hey!, why shouldn’t I earn some lunch money for it? I’ll post a link when one is available.

But in the meantime let me drop this link by Dr. Trevor Bedford, an expert in the genetic evolution of viruses. He is tracking the number and percentage of all cases that are the Omicron variant in several countries, including the US, from daily reporting. Here is what today’s graph for the US shows:


Note that this is in log scale, and the data lags by 10 to 14 days. What we can say is that IF the trend has continued, by now about 10% or more (10,000 or higher) of all cases in the US are Omicron, and one week from now, about 50% will be. 

Checking this daily for the next few weeks will keep you well ahead of the punditry you are reading in most media.