Friday, December 9, 2022

November producer prices: YoY measures mask recent sharp deceleration to mainly tolerable levels


 - by New Deal democrat

Consumer prices for November won’t be reported until next Tuesday, but this morning we got the upstream producer prices. The news was mainly good, although not good enough to likely dissuade the Fed from its current course of interest rate hikes.


This is one of those cases where YoY measures give a false picture in comparison with seasonally adjusted monthly data.

YoY producer price growth decelerated, but is still very high: final demand prices increased 7.4%, “core” final demand less food and energy increased 8.1%, and commodity prices are up 8.2%:


That’s down from their respective peaks, but still very high compared with the last 40 years pre-pandemic.

But now let’s look at the seasonally adjusted monthly changes:


Since June there’s been a marked deceleration in final demand prices, and an outright decline in commodity prices.

So let’s norm June to 100, and see what we get:


Final demand prices are only up 0.4% in 5 months; less food and energy up 1.4%; and commodities are down -6.1%. Onan annualized basis, the first measure is trending at 1.0% rate, while the “core” second measure is slightly problematic, increasing at a 3.4% annualized rate.

A similar pattern appears when we break final demand down into goods vs. services. While YoY goods prices are up 9.6% and services prices up 5.9%:


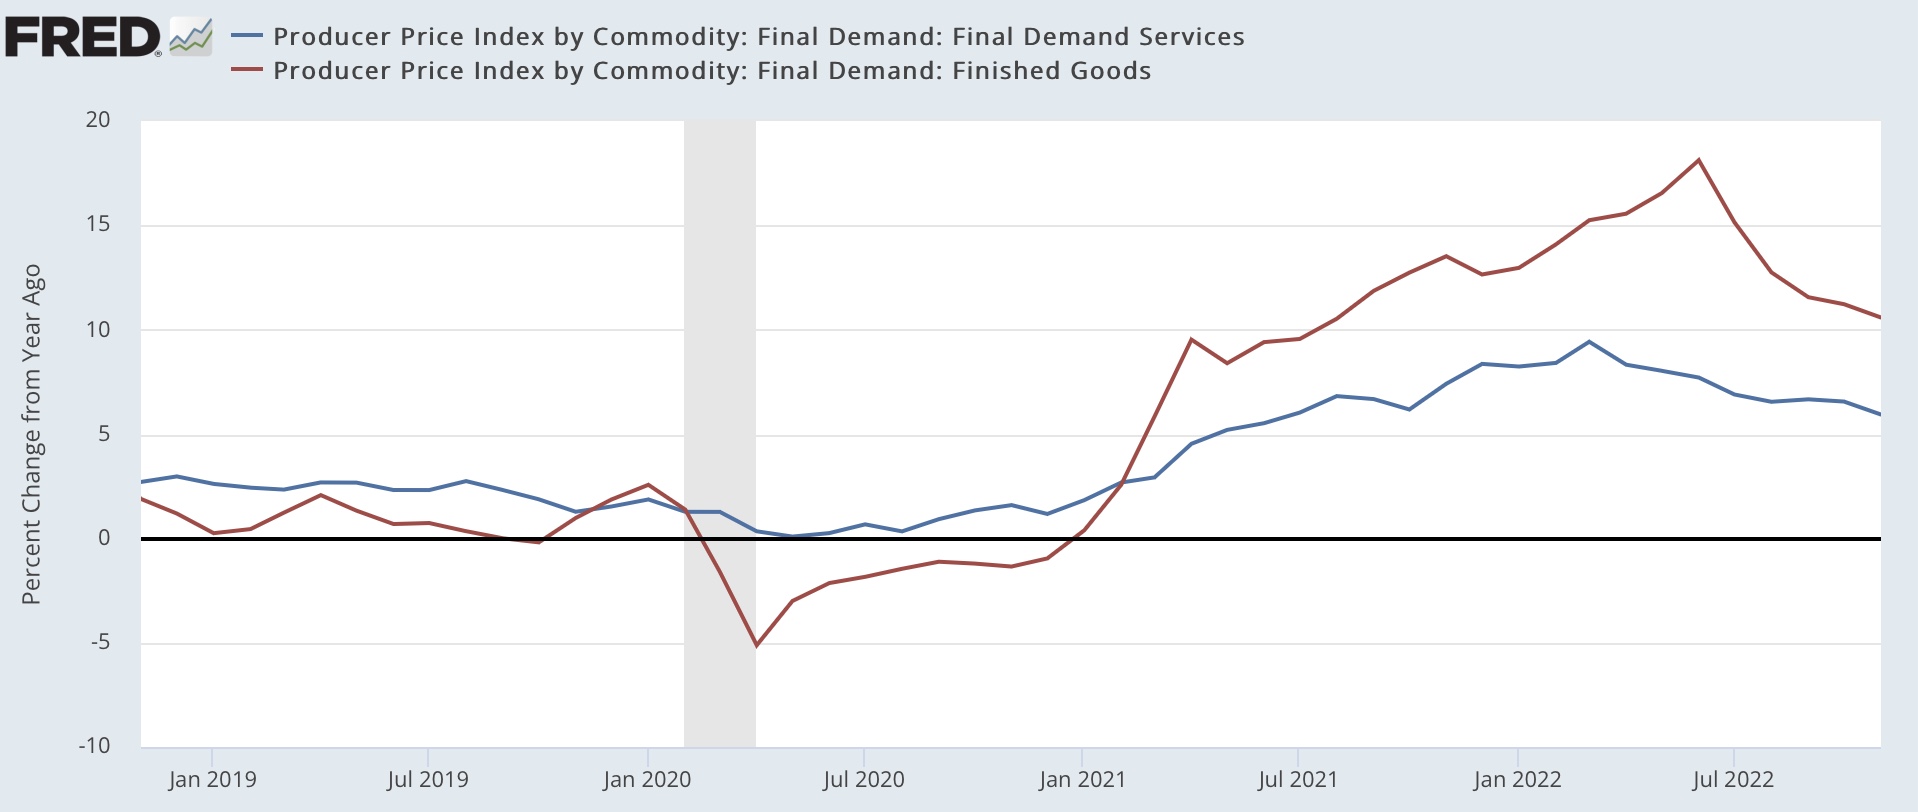
Final good services prices are up 1.5% in the past 5 months, while final demand goods prices are actually down -1.3%:


In short, most of the upstream inflation problem in producer prices has been abating rapidly. Only “core” services prices remain elevated above levels tolerated without alarm before the pandemic.

Thursday, December 8, 2022

Jobless claims: troublesome trend continues, but no yellow flag yet


 - by New Deal democrat

Initial jobless claims is one of the few remaining positive short leading indicators. But as I’ve noted for the past several weeks, the trend is troublesome.

This week initial claims rose 4,000 to 230,000, and the 4 week moving average rose 1,000, also to 230,000. Continuing claims one week previous rose 62,000 to 1.671 million:


Initial claims aren’t even as high as they were in August, but the less volatile (and less leading) continuing claims rose to the highest level since February.

If their current trend continues, all 3 could be higher YoY within two weeks.


Back in 2019, surveying the entire history of claims, I wrote that

Initial jobless claims are an important short leading indicator, typically turning up 3-9 months before a recession. A problem is the necessity of filtering out signal from noise.There are two ways I measure claims in order to do so: (1) how much has the less noisy four week average risen from its low? And (2) have initial claims, averaged monthly, turned higher YoY?

“Let’s start with the first measure. A 10% increase off of an interim low in claims is not unusual, and has happened every year or two for the entire 50+ year period that records have been kept. By the time they are up 15% from their bottom, not only is it almost always a signal of recession, but frequently the recession is imminent.
“….
“ In any given expansion, there is usually at least one month where claims are higher YoY. But if that happens for two months in a row, more often than not it has signaled that a recession is approaching.”

Last week I wrote something similar:

“In the past, if the 4 week average has been more than 5% higher YoY for any significant period of time, and less reliably, if the slightly lagging continuing claims were higher YoY, a recession was almost always close at hand.”

Here’s what the YoY% change in both the 4 week average and continuing claims look like historically:


At 230,000, the. 4 week average of initial claims is 35% higher than its low of 170,500 set in April. But they are still -5.8% lower YoY, and continuing claims are -20.4% lower YoY:


As I wrote above, if the current trend continues, that could change before the end of this month, warranting a yellow caution flag. But because the series is sufficiently noisy, even then I would want to see several months of ongoing weakness before hoisting any red flag, and even the note the false positives at least once during each decade between 1970 and 2010.

Wednesday, December 7, 2022

Coronavirus dashboard for December 7: the first winter wave of endemicity begins


 - by New Deal democrat


COVID is well on its way to becoming endemic, with a significant background level similar to what we have experienced in the last 8 months, and a surge during the winter months when people spend more time socializing together indoors.

In that vein, it is apparent that, as expected, Thanksgiving get-togethers have triggered a new wave of COVID infections.

Wastewater measures from Biobot show an apparent start to an exponential rise:


This is true not just nationally but in every Census region, especially the Northeast (yellow in the graph below) but the West (green), where the increase is slower:


The data is consistent with close to 400,000 “real” daily cases.

Confirmed cases have also increased from about 37,000 before Thanksgiving to 55,800 (although some of that is a data dump from New Jersey). Deaths still remain very low at 322:


And hospitalizations have increased from 24,000 in mid-November to 34,600, 6,000 of which is just in the past 7 days:


More holiday get-togethers will only make this incipient winter wave worse.

Unfortunately, part of this is the very poor uptake of the new bivalent booster shot. Per Dr. Eric Topol, “Only 1 in 3 American seniors have been boosted in [the past] 6 months.”

Hospitalizations for seniors, at least in some States, are higher than they have been since the original Omicron wave one year ago:


This is particularly exasperating, since the CDC just updated their data showing that being fully boosted lowers seniors’ risk of hospitalization by 80%:


Although mitigation efforts like masking have all but evaporated, my template is that this wave will likely be similar to the BA.1.12.1 and BA.5 waves earlier this year, both of which peaked at roughly 125,000 confirmed cases and 500 deaths per day. This peak will probably be in about mid-January.


Tuesday, December 6, 2022

Scenes from the November employment report: the short leading jobs indicators


 - by New Deal democrat

Every month as part of my post on the jobs report, I run through the changes in those measures which are short leading indicators for the economy.


There were some significant developments in the past several months, so let’s take a closer look here.

Here’s a historical look at temporary help services, residential construction jobs, and total construction:


The first two typically turn down months before employment as a whole, and the last one at least turns flat.

Now here’s the close-up:


Temporary help didn’t just turn down in November, but several previous months were revised down as well (h/t Bob Dieli). Residential construction jobs turned down, and have been generally flat for half a year. Only total construction jobs are still increasing.

Manufacturing jobs also typically turn down before a recession:


These have continued to increase through November (pretty surprising given the weak Fed new orders and ISM manufacturing reports).

But manufacturing *hours* are much a more sensitive indicator than manufacturing jobs (shown YoY for better comparative purposes):


And manufacturing hours YoY are down by a % typically associated with previous recessions.

In the past, a decline of -0.6 hours from the expansion peak has been the average consistent with the onset of a recession, and that is what we have now:


Finally, in a manner similar to initial jobless claims, the number of those unemployed for less than 5 weeks has typically risen before the onset of a recession (very noisy, but true even for the smoother 3 month rolling average):


Here is the close-up of that metric for the past year:


In short, most of the leading indicators of a jobs recession are either signaling an oncoming recession now (temporary jobs, manufacturing hours, short term unemployment) or at very least are close (residential construction). Only total manufacturing and construction jobs are still increasing.

I expect both manufacturing and construction jobs to turn down in the next few months as well, given the poor ISM manufacturing index, and the likelihood that housing units under construction will turn down significantly.

Monday, December 5, 2022

New factory orders remain an economic bright spot


 - by New Deal democrat

New factory orders for October were reported this morning. I normally don’t write about them, because they are very noisy, but since at the moment they are one of the few bright spots among the short leading indicators, let’s take a look.


Total new factory orders rose 1.0%. “Core” orders excluding defense and aircraft rose 0.6%:


“Core” orders have been flat for 2 months, which may or may not portend a turning, but as you can see from the below longer term view, typically factory orders turn down or at least flatten in the months before a recession - although it’s frequently only apparent in retrospect:


Consumer durable goods orders are also a short leading indicator. They were unchanged for the month:


With other measures of manufacturing from the regional Feds and ISM showing pronounced weakness, it’s a little surprising that it hasn’t shown up here.

Anyway, in the interest of balance, there are still some bright spots.