Saturday, May 1, 2021

Weekly Indicators for April 26 - 30 at Seeking Alpha


 - by New Deal democrat

My Weekly Indicators post is up at Seeking Alpha.

Right now a lot of YoY readings are not very helpful, because the comparisons are against the worst of the pandemic. So I have been adding some comparisons with 2019 as well. The sum total of the outcome is that, while a (perhaps short lived) economic Boom is underway, there are no persuasive signs of overheating at this point.

As usual, clicking over and reading will bring you up to the virtual moment, and reward me with a penny or two for my efforts in putting together the information.

Friday, April 30, 2021

Personal income and spending set new records in March + a comment about overheating and ramifications for the 2022 elections


 - by New Deal democrat

March personal income and spending were both reported this morning, completing the set of coincident indicators for the month - and both set records.


Personal income was up 21.1%, buoyed by another round of stimulus checks. Meanwhile personal spending increased 3.4%. In dating recessions, the NBER takes into account and subtracts transfer receipts (I.e., government payments). For some reason, FRED hasn’t updated personal spending yet, nor added the “real” inflation adjusted data, but here’s what all three look like unadjusted:


UPDATE: Here are the inflation-adjusted numbers:


We are probably close to the NBER dating the end of the coronavirus recession. I suspect they will wait for all of the Q2 data including industrial production and GDP to be reported in July, as well as being sure that the pandemic does not surge again, before actually making the call. In any event I suspect they will date the end of the recession as either being last April (when the lockdowns ended and the monthly data all bottomed) or last June (if they use Q2 2020 GDP as the decisive metric). Keep in mind that recessions end when the data bottoms, not when it returns to previous highs. The rebound is the period of recovery, and once new highs are set, especially in real GDP, is when recovery transitions to expansion.

All of which causes me to look forward to my next set of worries. Like everyone else, I am expecting at least a brief bout of inflation, partly due to pent-up demand, and partly due to supply bottlenecks. There are signs, especially in commodity prices and in the buyers’ panic in the housing market, that the economy is at least temporarily overheating.

Which means that the Fed might step in and raise rates soon. When? Well, as the graph below shows, in the past 30 years they have stepped in whenever consumer inflation exceeded 3% YoY:


Even if the Fed intends to be tolerant now, should inflation top 4% even for 2 or 3 months, I suspect they will start to raise rates rather aggressively.

Which adds to my worries about next year. We already have increased interest rates, signs that housing sales and construction (via new permits) - *NOT prices! -  have peaked, and possibly that corporate profits are being squeezed. A tightening yield curve would add to concerns that a recession, or at least a sharp slowdown, will be arriving just in time for the 2022 elections.

Thursday, April 29, 2021

Q1 GDP: The Boom is ON!


 - by New Deal democrat

My take on this morning’s Q1 GDP report is up at Seeking Alpha.

Since last summer I’ve been saying that, once the pandemic began to abate, the economy was primed to take off. 

Well, “Houston, we have lift off!”

As usual, though, I don’t just look at the present. The GDP report contains several nuggets that tell us about where we’re likely to be in 2022. So go take a look, and remember that in doing so, you are supporting me a little bit in my efforts.

Jobless claims: pandemic progress continues


 - by New Deal democrat

[Note: I’ll comment on the Q1 GDP report later today or tomorrow.]

New jobless claims will almost certainly continue to be the most important weekly economic data for the next 3 or 4 months, as increasing numbers of vaccinated people and outdoor activities lead to an abatement of the pandemic. Seven weeks ago I set a few objective targets for new claims: to be under 500,000 by Memorial Day, and below 400,000 by Labor Day. 

This week showed that the first target is clearly in reach.

On a unadjusted basis, new jobless claims declined 9,486 to 575,350. Seasonally adjusted claims declined by 13,000 to 553,000. The 4 week average of claims also declined by 44,000 to 611,750. All of these were new pandemic lows, after slight upward revisions to last week’s numbers. 

Here’s how the trend looks since last last August: 


The trend since February is a decline of about 75,000 per month.

To put these in perspective, last March and April we were seeing news claims on the order of 6 million to 7 million per week! On a longer term basis (shown below), current levels are equivalent to the worst levels in the “weaker” recessions of 1990 and 2001:


Continuing claims, which are reported with a one week lag, and lag the trend of intitial claims typically by a few weeks to several months, also set a new pandemic low on an unadjusted basis, with a decline of 49,902 to 3,790,527, while after seasonal adjustment there was a slight increase of 9,000 to 3,660,000:


The long term perspective again shows that these are equivalent to the worst levels of most previous recessions:


A week from tomorrow is the April jobs report, which I continue to expect to show a gain of well over 1,000,000 jobs, and possibly closer to 2,000,000. Additionally, my concern that new and more infectious variants of COVID might undercut progress with vaccinations has faded, as new infections have declined again to equal the lows of last summer already.

Wednesday, April 28, 2021

More signs of an economic Boom


 - by New Deal democrat

I have a new article discussing Monday’s durable goods new orders report up at Seeking Alpha, explaining how this data fits into the overall picture of a production-side Boom continuing in the months ahead. 

As usual, clicking over and reading will increase your knowledge of what to expect in the months ahead for the economy, and reward me with a few $$$ for the effort I put in.


While I am at it, the consumer side is Booming as well. Not only is personal spending at record levels (blue in the graph below), but personal saving is also much higher than it was before the pandemic (red), thanks to the stimulus payments:


And consumer confidence as at Boom levels as well:


The leading indicator among this data is the expectations subindex (blue), which at 109.8, is just barely visible at the right side. It has rarely been above 110 in the past 35 years. 

In other words, short leading indicators for both the producer and consumer sides of the economy suggest not only Boom conditions now, but continuing through the summer at least.

Tuesday, April 27, 2021

While house price gains continue to go nuts, housing remains much more affordable than at the peak of the bubble


 - by New Deal democrat

The boom - and maybe insanity - in house price gains continued in February, as both the Case Shiller and FHFA house price indexes increased roughly 1% just since January! The YoY increase for both was almost exactly 12%, as shown in the graph below:


While the YoY increase in house prices match those of the bubble peak, and are, to say the least, not sustainable, they aren’t quite the crisis that they appear at first glance. 

That’s because mortgage rates over the 12 month period declined, which makes the affordability of monthly mortgage payments considerably less intense. And in real terms compared with income mortgage payments are still well below their level at the peak of the housing bubble.

Since the peak of the housing bubble in roughly September 2005, house prices increased roughly 33% as of February 2020. With the 12% further increase in the past 12 months, they are now almost 50% higher than in September 2005.

But what is *very* different is mortgage rates.

Here is the average rate for a 30 year mortgage in each of the 3 months:

9/05 - 5.77%
2/20 - 3.47%
2/21 - 3.08%

That means that in nominal, not-inflation-adjusted terms, the monthly mortgage payment in February 2020 as only 2% higher than in September 2005. In February 2021 it was only about 8% higher, even taking the big appreciation of house prices into account.

Over the same period of time - since September 2005 - average hourly wages are up 55%. As of 2019 (the last available measure), median household income was up 48%.

In other words, home buyers in the aggregate have about 50% more income to pay a mortgage bill less than 10% higher than it was in 2005.

In sum, although monthly mortgage payments have increased by about 7% since December, when rates averaged 2.68%, even with the huge price increases that continued through February, housing remains much more affordable than it was in 2005 at the peak of the bubble.

Monday, April 26, 2021

Coronavirus dashboard for April 26: reasons for optimism all around


 - by New Deal democrat

Let’s start with an overview of total cases and deaths in the US:


1.7 in every 1,000 Americans has died of COVID-19. 9.7% of the entire population has had a *confirmed* infection. Probably another 5% to 10% have been infected, but were never tested.

With large-scale vaccinations, plus the onset of warmer weather (so fewer indoor gatherings), the incipient “4th wave” appears to have reversed:


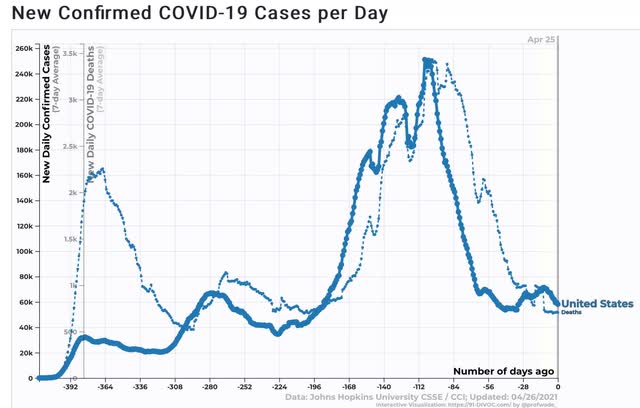
In the past 7 days, an average of 58,164 cases per day were confirmed, vs. the recent low of 53,663, and down from 71,234 12 days ago. Deaths in the past 7 days averaged 706 per day, just above the recent low average of 697 4 days ago. Note of course that this is still above last spring’s low in deaths, and about 3x the number of daily cases last spring.

That deaths have not increased almost 35 days after the recent upturn in cases means that the vaccines are working, and also that cases are becoming more concentrated among unvaccinated younger people.

In Michigan and the Northeast, new cases have also turned down:


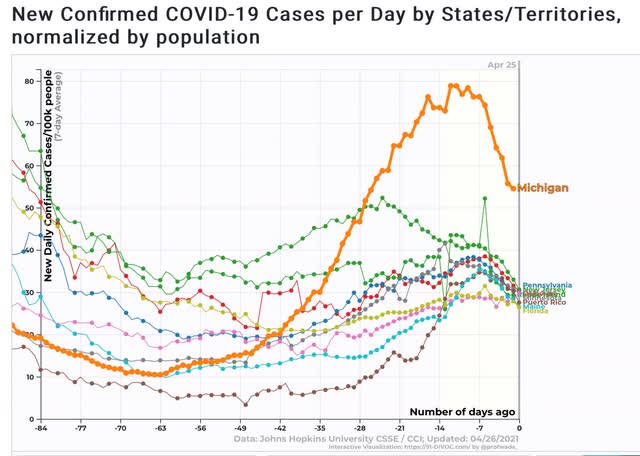
Some of that might be increased vaccinations, and some may be renewed panic and vigilance among the affected populations.

Meanwhile, the success stories continue overseas in the cases of Israel and the UK, two countries with successful vaccination regimes that were accompanied by temporary lockdowns:


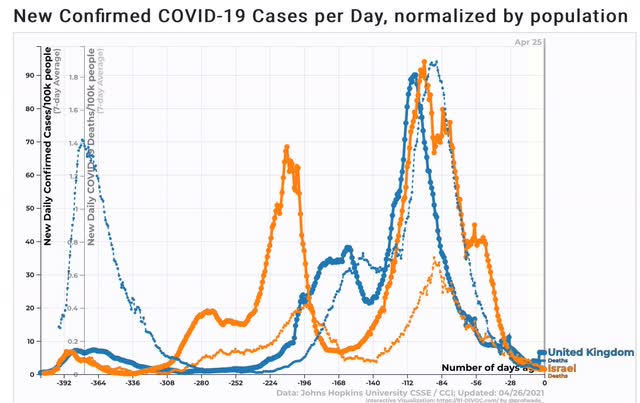
New cases and deaths are down in both by over 95%. Israel recorded *no* deaths for the last 2 days.

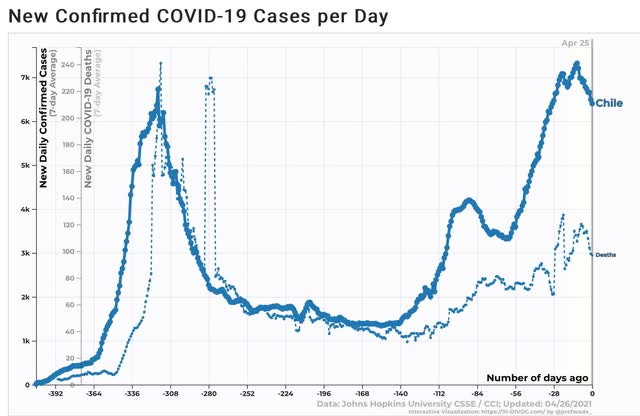
And both infections and deaths in Chile (which has been using the less effective Sinovac vaccine) have also turned down decisively in the past week:


As you have probably already read, the EU is going to open its borders to vaccinated Americans. I imagine Canada will follow suit shortly. This will put added pressure on the vaccine-hesitant and resistors to go ahead and get the shot.

I’m becoming more and more optimistic about the situation in the US by late summer.