Saturday, December 31, 2022

Weekly Indicators for December 26 - 30 at Seeking Alpha


 - by New Deal democrat

My Weekly Indicators post is up at Seeking Alpha.

The volatile coincident consumer numbers bounced higher this week, while another recession indicating system flashed red, suggesting a recession is most likely to start during the 2nd Quarter of 2023.

As usual, clicking over and reading will not only bring you up to the virtual moment as to the economy, but will bring me a little pocket change for my efforts.

Best wishes for a happy, healthy, and prosperous new year to all readers!

Friday, December 30, 2022

Coronavirus dashboard for year end 2022: becoming endemic, and still an important threat to seniors


 - by New Deal democrat

As we close out 2022, let’s look back at the overall picture for COVID.


The best historical measure of actual infections is Biobot, which samples wastewater. This is because the advent of easy home testing one year ago meant that far fewer people have had “confirmed” cases this year in comparison to “actual” infections. The solid line in the graph below is the level of particles (left scale) from which actual case levels can be inferred (right scale):


Current levels are now higher than any other wave peak except for last winter’s Omicron.

Regionally the Northeast is faring the worst, although its current outbreak is not yet at the level of its first, disastrous, wave. The South is also increasing sharply, while for now the West remains in relatively good shape:


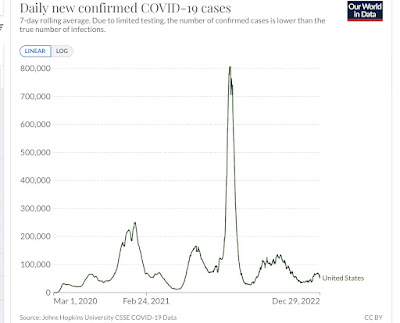
As you can see, this contrasts with “confirmed” cases, which while they have increased, are well below all previous waves:


But hospitalizations and deaths are much more reliable, since cases have always generally been confirmed. 

Hospitalizations have increased 50% from their recent lows, but are well below all prior waves of infections at this point:


The same is true of deaths, which since March have varied between 300-500/day, well below their levels at any previous times during the pandemic:


Deaths continue to be concentrated among the unvaccinated or not-fully vaccinated:


And they also skew much higher with age:


Even fully vaccinated seniors should probably remain on guard, and in particular mask up whenever indoors in public places. Altogether, non-fully vaccinated people over age 50 account for nearly 3/4’s of all COVID deaths.

Vaccinations in the US hit a wall this year, only increasing from about 65% to 70% of the population fully vaccinated, and only increasing from 75% to 80% even partially vaccinated during the entire year:


Total deaths from Covid  have increased by 100,000 in the past 9 months (i.e., at a 133,000 annual rate), to 1.1 million:


Total *confirmed* cases in the US have just topped 100,000,000, about 20,000,000 of which have been during the last 9 months:


Because *actual* cases were at least double confirmed cases before this year, and at least triple the number of confirmed cases this year after home testing became widely available, probably about 240,000,000 or more Americans (or about 75%+ of the population) have at one point or another been infected.

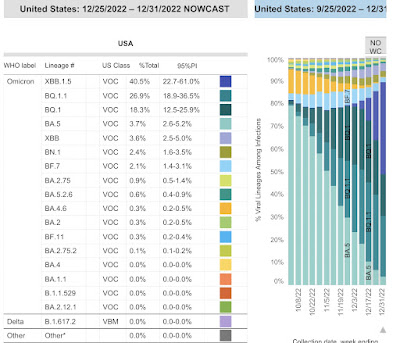
Finally, here is the what the prevalence of the Alphabet soup of newer variants looks like at the moment. XBB and its subvariant XBB.1.5 make up 44% of all cases, BQ.1&1.1 another 45%, with BA.5 down under 4% and the remaining variants in the soup 7%:


The biggest regional outbreaks showed by Biobot correspond with the highest prevalence of variant XBB:


Note that XBB%1.5. Is most prevalent, at 75%, the Northeastern regions, followed by roughly 20% in the Southern regions, and less in the Midwest and West, corresponding almost exactly to the Biobot data referenced at the beginning of this article.

Between previous infections and vaccinations, probably only 5%or less of the population is totally “naive” to the Covid virus, with no resistance whatsoever.

This, along with improved medical care, probably explains why Covid has become much less deadly on a per capita basis this year. It is well on its way to becoming endemic. 

The bottom line is, we keep seeing ever more easily transmissible variants, with low hospitalizations and even lower deaths. In the last 9 months, deaths have tranistioned from 500,000/year to 133,000/year. The lion’s share of deaths skew to the under-vaccinated and the elderly. If people over age 50 were all fully up to date in their vaccinations and always masked in indoor public spaces (yes, this means *no* indoor restaurant dining), deaths would probably be down to about 35,000/year or about 100/day, a true flu-like comparison.


Thursday, December 29, 2022

Initial claims close out the year still positive


 - by New Deal democrat

This morning we got the final economic news of the year, as initial claims for the week rose 9,000 to 225,000. The 4 week moving average declined 250 to 221,000. Continuing claims rose 41,000 to 1,710,000, a 10 month high:


The weekly number was actually 14,000 higher than one year ago, but that is not significant. The 4 week average and the continuing claims numbers both remained below their levels from the end of last year:


So this series closes out the year still positive.

At the same time, beginning next week the YoY comparisons get more challenging. To reiterate, I’ll raise a “yellow flag” caution if the 4 week moving average turns higher YoY. I won’t raise a recessionary “red flag” unless and until the average is higher by 10% or more YoY. 

I plan on posting my final “Covoravirus dashboard” for the year tomorrow, and my normal “Weekly Indicators” over the weekend, before we start the new year.

Wednesday, December 28, 2022

Three graphs which defined the economy in 2022; a look back at my forecasts


 - by New Deal democrat

In the summer of 2021, looking at the long leading indicators, I wrote:


while the long leading indicators confirm a firm, even strong expansion through the remainder of 2021, by spring of 2022 they are neutral, suggesting a much softer economy, although not a recession before the midyear limit of this forecast.”

By the beginning of this year, the long term outlook transformed into the short term outlook, which was:

The short leading indicators now confirm the positive trend through the first half of this year, with very little evidence of softening at this point.“

Meanwhile I took my first look at the longer leading outlook for the 2nd half of this year 

 If 6 months ago the long leading index forecast a weakening, but still positive, economy by roughly midyear this year, they forecast an outright stall by year end 2022.”

As we know now, we got the complete stall - perhaps even a mini-recession - in the first half of this year, and growth picked up in the second half.

So what happened? This brings us to the three graphs that defined the economy this year.

By far the most important is this first one, showing oil and gas prices:


Prices had already been gradually heading higher, outside of the 2020 lockdown period, for about 5 years. Then, with the Russian invasion of Ukraine in February, oil prices, immediately followed by gas prices, rose by over 50%, peaking in early June. As the situation there stabilized, and Europe’s dependency on Russian gas was successfully decoupled, prices fell almost as quickly. As we end the year, gas prices are at the same level as they were 18 months ago.

This was a textbook oil shock. It took an economy which was already slowing, and threw it briefly into reverse (albeit a minor one). Then, as the shock reversed, economic activity, especially by consumers, picked up again.

The second graph is one I have run many times for over a year, comparing house prices with owners’ equivalent rent in the CPI:


Just as I first forecast over a year ago, the big increase in house prices started showing up in the fictitious owners’ equivalent rent, with a one year delay, dragging core inflation higher along with it, even as house prices slowed down and then peaked during the summer. As we end the year, house prices are declining, but owners’ equivalent rent has yet to peak.

Which brings us to the third graph, which is the YoY change in the Fed funds rate:


As it chased inflationary pressures that were manifest in 2021, the Fed raised interest rates by over 4% in just 9 months, the fastest rate of increase since Volcker’s recession of 1981. These interest rate increases have created recessionary sales numbers in the housing industry, caused banks to tighten lending standards, and to some extent countered the expansionary effect of the declines in the price of gas.

As we end 2022, gas prices are likely to stop declining soon, if not already now, while the effects of even the first of the Fed rate hikes last spring has not fully made their way through the economy. Industrial production and retail sales have stalled, while real manufacturing and trade sales and personal income less transfer payments are still below their peak levels earlier this year. Only jobs and wider consumer spending have not rolled over. These will likely be the big focus in the earlier part of next year.

As to which, my short term and long term forecasts for 2023 will be posted at some point during the next month.


Tuesday, December 27, 2022

House price indexes decline, unchanged in October; further evidence of real declines since summer


 - by New Deal democrat

The Case Shiller national house price index declined another -0.3% in November, and is now up 9.2% YoY, compared with a peak of +20.8% YoY in March (note that is in line with my rule of thumb that a decline of 1/2 or more in YoY growth over the past 12 months indicates a series has peaked and rolled over).


The FHFA purchase only house price index was unchanged for the month, and is up 9.7% YoY (vs. its peak of +19.7% in February, so also is in decline per my rule of thumb):


Here’s an update of the FHFA house price index YoY (/2 for scale) vs. Owners’ Equivalent Rent in the CPI:


Because OER follows house prices with roughly a 12 month lag, I expect OER to continue to increase YoY for a few more months before declining steeply probably beginning next spring. Note also that the most recent FHFA and Case Shiller report is for Octobe,, so this month’s YoY change is probably closer to about 6%.