Saturday, September 4, 2021

Weekly Indicators for August 30 - September 3 at Seeking Alpha


 - by New Deal democrat


My Weekly Indicators post is up at Seeking Alpha.


Even the indicators which should be most sensitive to rhe raging of the Delta variant show no significant deterioration. A few indicators actually improved.


As usual, clicking over and reading should reward you with knowledge and reward me a little bit for my efforts.

Friday, September 3, 2021

August jobs report: some weak points, but the underlying very good trend continues


 - by New Deal democrat

While the NBER has declared that the recession ended in April 2020, neither the King nor Queen of Coincident Indicators, industrial production and jobs, have recovered to their pre-pandemic levels. The former is only off by -0.2%, but the latter - which is most important to ordinary Americans - as of this morning’s report is still -3.5% below its level in February 2020.

While this morning’s report came in well short of expectations, with the big positive revision to last month’s blockbuster report, which I’ll get into more detail about below, the 6 month average of monthly gains is still over 600,000.

Here’s my synopsis of the report:

HEADLINES:
  • 235,000 jobs added. Private sector jobs actually added a little more, but government (mainly education) shed -8,000 jobs, having a great deal to do with haywire seasonal adjustments this year. The alternate, and more volatile measure in the household report indicated a gain of 509,000 jobs, which factors into the unemployment and underemployment rates below.
  • The total number of employed is still -5,568,000, or -3.5% below its pre-pandemic peak.  At this rate jobs have grown this year, it will take another 9 months for employment to completely recover.
  • U3 unemployment rate declined -0.2% to 5.2%, compared with the January 2020 low of 3.5%.
  • U6 underemployment rate declined -0.4% to 8.8%, compared with the January 2020 low of 6.9%.
  • Those not in the labor force at all, but who want a job now, declined -835,000 to 5.682 million, compared with 5.010 million in February 2020.
  • Those on temporary layoff increased 13,000 to 1,252,000.
  • Permanent job losers declined -443,000 to 2,487,000.
  • June was revised upward by 24,000, while July was revised upward by 110,000, for a net gain of 134,000 jobs compared with previous reports.
Leading employment indicators of a slowdown or recession

These are leading sectors for the economy overall, and will help us gauge how strong the rebound from the pandemic will be.  These were mixed, with a preponderance negative:
  • the average manufacturing workweek declined -0.2 hours to 40.3 hours. This is one of the 10 components of the LEI.
  • Manufacturing jobs increased 37,000. Since the beginning of the pandemic, manufacturing has still lost -378,000 jobs, or -3.0% of the total.
  • Construction jobs declined -3,000. Since the beginning of the pandemic, -232,000 construction jobs have been lost, or -3.0% of the total.
  • Residential construction jobs, which are even more leading, rose by 100. Since the beginning of the pandemic, 40,900 jobs have been *gained* in this sector, or 4.9%.
  • temporary jobs declined by -5,800. Since the beginning of the pandemic, there have still been 262,200 jobs lost, or -8.9% of all temporary jobs.
  • the number of people unemployed for 5 weeks or less decreased by 174,000 to 2,083,000, which is exactly 1,000 higher than just before the pandemic hit.
  • Professional and business employment increased by 74,000, which is still -468,000, or about -2.2%, below its pre-pandemic peak.

Wages of non-managerial workers
  • Average Hourly Earnings for Production and Nonsupervisory Personnel: rose $0.14 to $25.99, which is a 4.8% YoY gain. This continues to be excellent news, considering that a huge number of low-wage workers have finally been recalled to work. 

Aggregate hours and wages:
  • the index of aggregate hours worked for non-managerial workers rose by 0.2%, which is a  loss of -3.1% since just before the pandemic.
  •  the index of aggregate payrolls for non-managerial workers rose by 0.7%, which is a gain of 4.9% since just before the pandemic.

Other significant data:
  • Leisure and hospitality jobs, which were the most hard-hit during the pandemic, was completely unchanged, and is still -1,699,000, or -10.0% below their pre-pandemic peak.
  • Within the leisure and hospitality sector, food and drink establishments declined -41,500, and is still -966,300, or -7.9% below their pre-pandemic peak.
  • Full time jobs declined -30,000 in the household report.
  • Part time jobs increased 423,000 in the household report.
  • The number of job holders who were part time for economic reasons declined by 14,000 to 4,469,000, which is an increase of 71,000 since before the pandemic began.

SUMMARY

As frequently happens, the messages of the Establishment report, which asks businesses about hiring, and the Household report, which asks individuals about being employed, were quite different. Despite the relative weakness in the former, overall this month’s jobs report was quite positive, as it continues existing good trends this year.

To begin with, July’s excellent 943,000 gain was revised higher to 1,053,000. Combined, July and August averaged 644,000/month, which is right in line with the average gains this year. In short, the strong trend in job gains is intact. Further, as was anticipated, this month’s report was distorted to the downside by losses in education. Seasonally August is when educators get rehired, but this year much of the gains were in June and July - so the seasonal adjustments paid us back to the downside in August.

The issue with labor and hospitality is murkier. The stalling out in gains, and losses in food and drink establishments, might also reflect distortions of seasonality this year, or they might reflect impacts from Delta, or some of each.

Meanwhile the 509,000 gain in jobs from the Household report, together with a slight increase in the labor force, caused all of the unemployment-related indicators to continue to decline. The unemployment rate is where it was in 2015, and the broader underemployment rate where it was in 2017, as is the even broader number of those outside of the labor force but who want a job. This is not bad at all.

Finally, wages for ordinary workers continue to increase at a strong rate. The issue is whether those gains will continue to be gobbled up by supply-bottleneck induced inflation.

Bottom line: some weak points, but the very good underlying trend continues.

Thursday, September 2, 2021

Jobless claims show continuing improvement, now well within normal expansion range


 - by New Deal democrat

Way back at the beginning of spring, I set a goal of initial claims being 400,000 or less by Labor Day as a marker for a good COVID recovery - which I was reminded of because the aforesaid holiday is this weekend. Well, we blew through that a while ago, and at this point all of the jobless claims markers are well within the range of a normal expansion.

This week initial jobless claims declined 14,000 to 340,000. The 4 week average of claims declined by 11,750 to 355,000. Both set new pandemic lows:


The same is true for continuing claims, which declined 160,000 to another new pandemic low of 2,748,000:


From the long term perspective, below is the current level of continuing claims  (blue), together with the 4 week average of initial claims* (red), and the unemployment rate from last week’s jobs report* (gold)(*adjusted for scale)(all current values = zero). All of these are consistent with well-established expansions over the past 40 years:


Surprisingly, so far the awful outbreak under the Delta variant has had no apparent effect on either initial or continued claims at all.

All of the remaining emergency pandemic programs have either already expired or are about to expire this month. I don’t expect to see an effect from that in tomorrow’s payrolls report, but next month it will be interesting to see if the number of unemployed, plus the number people not even in the labor force, jumps substantially. 

Tomorrow’s jobs report should show another substantial gain. But with such a substantial monthly variance as has been apparent this year, I won’t even hazard a guess.

Wednesday, September 1, 2021

Producer sector remains on fire, while two most important indicators of consumer sector falter


 - by New Deal democrat

As has been the pattern for the last several months, August data started out with a strong reading on manufacturing, while July ended with weak data on housing construction. As a side note, the latest read on motor vehicle sales also slid south. 


Both the overall and new orders components of the ISM manufacturing index remained very strong, with the former increasing slightly m/m from 59.5 to 59.9 and the latter by 1.8 from 64.9 to 66.7, both far above the breakeven point of 50.0:


As I have said virtually all this year, the simplest way to read this is that the manufacturing sector remains on fire.

The story remains different with this morning’s release of July construction spending. Total nominal spending increased 0.5%, and spending in the long leading residential construction sector increased 0.6%, both all time records:


But just as has been the case virtually all year, when we deflate by the cost of construction materials, that increase disappears, and in fact shows a plunge for the year, although there was a very slight increase this month:


Finally, recently I have stopped reporting on auto sales, because the manufacturers have reduced reporting to once a quarter, so most of the data is just an estimate, but the BEA does its own separate report, which was last updated on August 27 for the period through July. And the news here was that both light vehicles and heavy truck production declined further:


Since houses and cars the two most important, and the first and second most leading, indicators of the consumer sector of the economy, this is needless to say not a good trend, although neither are at levels typically associated with the onset of a recession at this time.

Tuesday, August 31, 2021

Coronavirus dashboard: the Delta wave starts to recede in the South, and migrates North


 - by New Deal democrat

Ultimately, that I have to continue to post this material is depressing. At least 80% of all US adults and most teenagers should have been fully vaccinated by now, with the threat of mass outbreaks, even from Delta, retreating into the past.


So let me begin with the best graphic representation I have seen so far of where the resistance to vaccination is coming from (via Morning Consult):


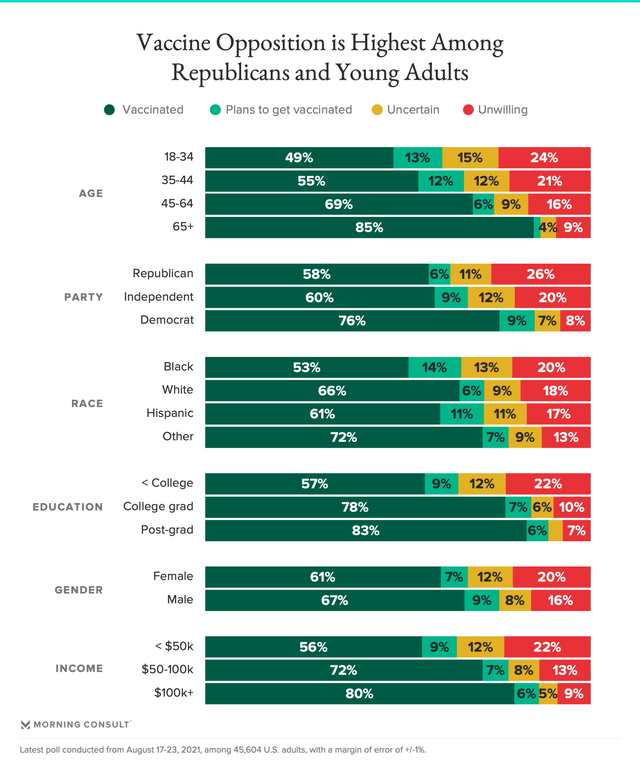
Note that for all the attention the opposition of the Trumpist GOP has received, an even *greater* share (39%) of the Young Invincibles, age 18-34, are either uncertain or unwilling, and 62% have been or have plans to get vaccinated. Additionally, right behind the GOPers, 33% of Blacks are uncertain or unwilling, and only 67% have been or have plans to get vaccinated. 

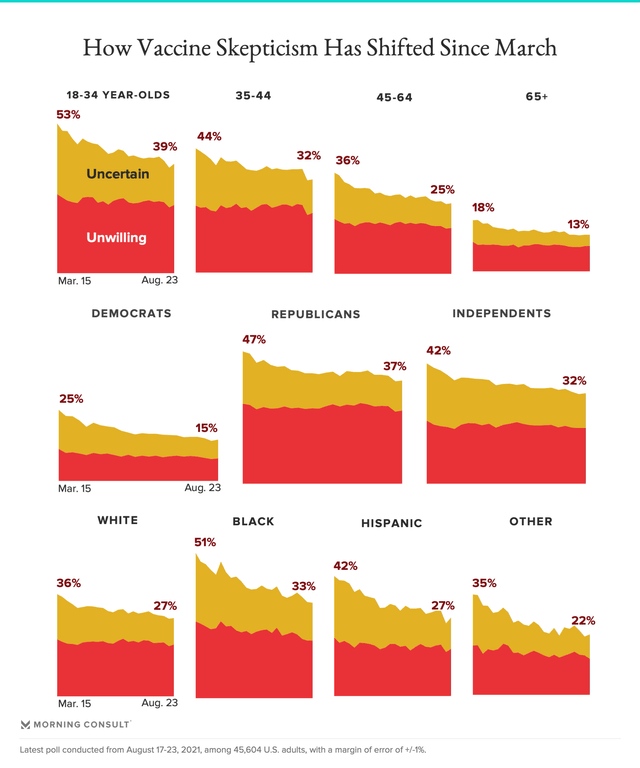
Further, when we look at the data longitudinally over time, we see that while a large percentage of “uncertain” Blacks have been persuaded to get the shot, only modest progress has been made both with regard to GOPers and the Young Invincibles:


Turning to the present situation, the “good” or at least less bad news is that the week over week increase in new cases continues to slow, now at “only” 6%. The increase in deaths, which lags by 3 to 4 weeks, may be showing its first signs of deceleration as well:


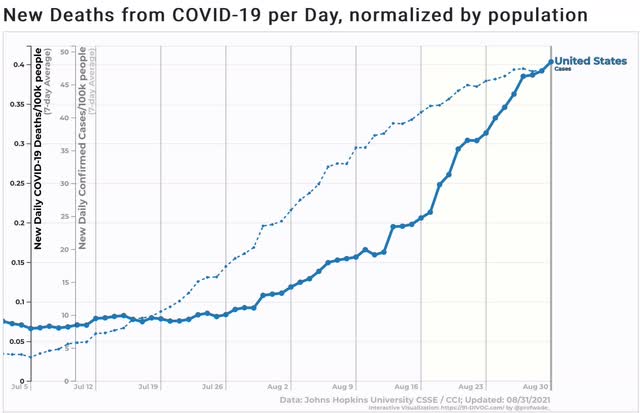
Even if so, during that time cases have risen by over 35%. A similar increase in deaths will give us over 1800 deaths per day by September 21, and possibly as high as 2500 or so by the end of September.

California’s case rate may have peaked in the last week, and indeed 17 States + DC show either a plateau in cases or an outright decline:


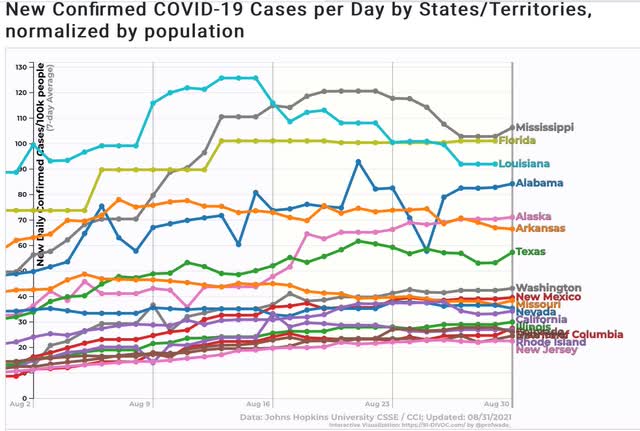
Note that all of the original hotspots in the South - MO, AR, LA, TX, MS, AL, and FL - fit into this group.

Meanwhile 16 other States, almost all in the interior West or Midwest, plus the Carolinas and Georgia, are showing a solid uptrend in cases:


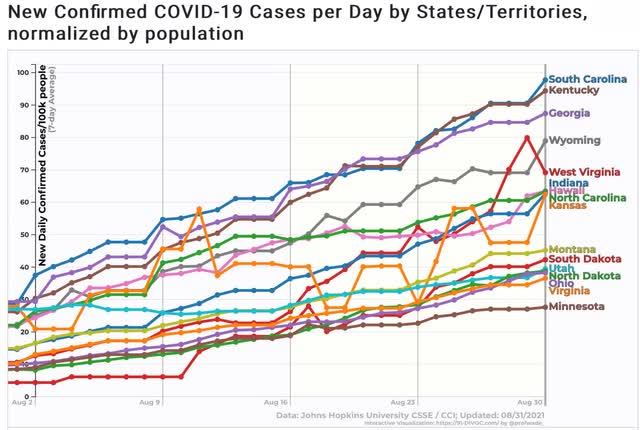
Among these, the most unvaccinated States including ND, WY, WV, and IN, and the next lowest tier, including SD, GA, SC, and OH, are included in this group.

In other words, the epicenter of the Delta outbreak, having gone through most of the dry tinder in the Deep South, is now migrating northward, especially to the least vaccinated States in that climate zone. While I continue to think that on a nationwide basis, the peak of the Delta wave is close at hand, the fact that SD in the wake of the acid test of the Sturgis rally appears *not* to have anything close to herd immunity, causes me to think that the decline in cases after Labor Day or so is likely to be short-lived, with another wave hitting as schooling resumes throughout the north, and colder weather gives rise to more indoor gatherings.

Monday, August 30, 2021

A fundamentals-based look at the consumer indicates the expansion is in good shape for now


 - by New Deal democrat

I was going to update the Coronavirus dashboard today, but since half of the States no longer bother to report over the weekend, Monday is basically useless. There may be a few interesting things happening ... but let’s wait until tomorrow.


In the meantime, I see where Bill McBride posted a graph of spending on gas as a percent of total consumer spending, which brought to mind one of my “alternative” methods for forecasting (at least on the very near term) a recession.

Start with oil shocks. As the graph below shows, all three of the non-pandemic recessions in the past 30 years were immediately preceded by a large jump in oil prices compared with income:


Certainly in the past year there has been a comparable jump, but note that, *unlike* right before those recessions, the “jump” has been from very low prices to prices in line with the average over the last 10 years. A similar thing happened in late 2009, and that did not derail the recovery from the Great Recession.

Also, typically before a recession begins, consumers are unable to cash in on appreciating assets, in particular houses and stock gains.

Here is the YoY% change in house prices divided by average hourly wages (blue) compared with single family permits (red):


As I have noted many times before, permits declined first. Prior to three of the last four recessions, house prices followed suit before the onset of the recession (prior to 2001, which was not a consumer recession, house price increases stabilized).

Similarly, stock prices have typically peaked shortly before the onset of a recession:


And debt service as a percent of personal income has increased:


In short, except for recessions that do not focus on the consumer, incomes are squeezed, debt service increases, and the ability to cash in on appreciating assets halts.

None of those conditions obtains at present. I would expect to see the cushion of savings accumulated by consumers during the recession (graph below):


decline to prior rates; and house prices to hit a wall before a consumer pullback manifests in a recession. We’re just not there.