Saturday, April 3, 2021

Weekly Indicators for March 29 - April 2 at Seeking Alpha


 - by New Deal democrat

My Weekly Indicators post is up at Seeking Alpha.

One fairly unique service I think I provide is not just forecasting the next few months, but into the next year as well. So in the second half of last year I was writing about how all of the indicators were lining up for strong growth in 2021 if the pandemic could be brought under control.

Now I am beginning to look at 2022, and what I see are increasing signs of jumps in the prices of important middle class commodities and assets, mainly houses and gasoline. Which means, we could see the old-fashioned type of end of an economic boom.

As usual, clicking over and reading will not just bring you right up to the moment in the nowcast and the forecasts, but also reward me a little for bringing that information to you.

Friday, April 2, 2021

Blockbuster March jobs report, but still a long way to go


 - by New Deal democrat

HEADLINES:
  • +916,000 million jobs added. The alternate, and more volatile measure in the household report indicated a gain of 609,000 jobs, which factors into the unemployment and underemployment rates below.
  • U3 unemployment rate declined 0.2% to 6.0%, compared with the January 2020 low of 3.5%, and the April 2020 high of 14.8%.
  • U6 underemployment rate declined 0.4 to 10.7%, compared with the January 2020 low of 6.9%, and the April 2020 high of 22.9%
  • Those on temporary layoff decreased -203,000 to 2,026,000.
  • Permanent job losers decreased -65,000 to 3,432,000.
  • January was revised upward by 67,000, and February was also revised upward by 89,000, for a net gain of 156,000 jobs compared with previous reports.
Leading employment indicators of a slowdown or recession

I have been highlighting these throughout the pandemic because of their leading nature for the economy overall.  These were positive: 
  • the average manufacturing workweek increased 0.2 hours to 40.5 hours. This is one of the 10 components of the LEI.
  • Manufacturing jobs increased by 53,000. Since February 2020 manufacturing has still lost -515,000, or 4% of the total. Over 60% of the total loss of 10.6% has been regained.
  • Construction jobs increased by 110,000 This was a big rebound from February’s Big Texas Freeze. Since February 2020 -182,000 construction jobs have been lost, 2.4% of the total. Over 80% of the worst loss of 12.5% has been regained.
  • Residential construction jobs, which are even more leading, rose by 10,200. YoY there have been actual job gains, and employment in this sector is at another new 10 year+ high.
  • temporary jobs *decreased* by -800. Since February 2020, 175,000 jobs have been lost, or 6% of all temporary help jobs.
  • the number of people unemployed for 5 weeks or less decreased by -8,000 to 2.177 million, compared with last April’s total of 14.283 million.
  • Professional and business employment rose by 66,000, which is still -685,000, or about 3.2% below its peak in February 2020.

Wages of non-managerial workers
  • Average Hourly Earnings for Production and Nonsupervisory Personnel: rose $0.2 to $25.21, which is a 4.4% YoY gain - less than the 5%+ YoY gains we saw in the last few months, which reflected that job losses during the pandemic  occurred primarily among lower wage earners.

Aggregate hours and wages:
  • the index of aggregate hours worked for non-managerial workers increased by 1.6%, still a loss since February 2020 of about 5%.
  •  the index of aggregate payrolls for non-managerial workers increased by 1.6%,  still a loss of -2.1% from February 2020. On the other hand, over 90% of the loss from last February to April has been made back up.

Other significant data:
  • Full time jobs increased 935,000 in the household report.
  • Part time jobs decreased -31,000 in the household report.
  • The number of job holders who were part time for economic reasons decreased by 262,000 to 5.826 million, which is still an increase from February 2020 of 1,428,000.
  • The Labor Force Participation Rate increased 0.1% to 61.5%, which is nevertheless down 1.8% from February 2020.
  • The Employment to Population Ratio increased 0.2% to 57.8%, which is down 3.3% from February 2020.
  • Leisure and hospitality employment increased 280,000.
  • Employment in food and drinking jobs increased 176,000. 

SUMMARY

This was a blockbuster report, but one that was anticipated by the big declines in the weekly new jobless reports during the reference weeks for March. 

There were only two negative items: the number of temporary jobs actually declined slightly in March, and average hourly wages for non-supervisory personnel increased an anemic $0.02. There are silver linings in each. Former temporary jobs may be getting converted to permanent jobs; and lower wage service workers have been called back to work in large numbers.

Everything else was up sharply, reflecting an economy that is making substantial strides towards returning to pre-pandemic levels. This is partly because of great vaccination progress (for example, over half of all seniors in the US have been fully vaccinated), and partly a result of spring weather opening up great numbers of outdoor venues. I am particularly impressed that full-time employment was up sharply, while part time employment declined; and that temporary layoffs declined sharply, and permanent job losses declined as well. These were powerful moves in the right direction. Still, even at this rate, it will take the rest of the year to get back to February 2020 levels.

Thursday, April 1, 2021

ISM manufacturing at multi-decade highs in March, while construction chilled in the February Big Texas Freeze


 - by New Deal democrat

Two months ago I wrote that both the manufacturing and housing sectors were “on fire.” Then last month I wrote that they had “turned white hot,” with both construction spending and ISM manufacturing data at levels not seen in years.


While construction backed off, manufacturing is even ... well, hotter than white hot?

The overall ISM manufacturing reading rose from 60.8 to 64.7, the highest reading since 1984! The even more leading new orders subindex also rose from 64.8 to 68.0, the highest reading since 2004:

Turning to construction, the Big Texas Freeze showed up in February spending for residential construction, which declined -0.2% for the month, while total construction spending declined -0.8%:

Taking into account inflation - deflating by the PPI for construction materials -  neither residential construction spending nor overall construction spending is anywhere near their housing bubble levels of 2005:


While I am concerned about 2022, as I described yesterday, this year is likely going to be absolutely gangbusters for residential construction spending, which means lots more money flowing through the economy as a whole.

In short, this morning’s two reports together show that manufacturing and housing, the two most important leading sectors of the real economy, remain likely to power very strong GDP gains this year.

New jobless claims rise slightly, expect a big payrolls gain tomorrow


 - by New Deal democrat

New jobless claims are likely to the most important weekly economic data for the next 3 to 6 months. They are going to tell us whether, as the number of those vaccinated continues to increase, there will be a veritable surge in renewed commercial and social activities and attendant consumer spending, leading in turn to a strong rebound in monthly employment gains.

Three weeks ago I set a few objective targets: I am looking for new claims to be under 500,000 by Memorial Day, and below 400,000 by Labor Day. 

This week initial jobless claims increased from last week’s pandemic lows. On a unadjusted basis, new jobless claims rose by 63,282 to 714,433. Seasonally adjusted claims rose by 61,000 from last week’s downwardly revised 658,000 to 719,000. The 4 week average of claims declined by 10,500 to 719,000, a new pandemic low. 

Here is the close up since the end of July (recall that these numbers were in the range of 5 to 7 million at their worst in early April): 

Because YoY comparisons would be with the worst of the pandemic, including widespread lockdowns, I have discontinued that graph as temporarily unreliable.

Continuing claims, which historically lag initial claims typically by a few weeks to several months, also made new pandemic lows yet again this week. Seasonally adjusted continuing claims declined by 46,000 to 3,794,000, while the unadjusted number declined by 90,696 to 4,142,940:


Nevertheless seasonally adjusted continued claims remain at levels last seen in March 2011.

I remain bullish that the ever-increasing pool of fully vaccinated adults - 54,500,000 as of yesterday, or 21% of the adult population - together with a seasonal shift from indoor to outdoor activities, is going to continue to result in a dramatic fall in jobless claims over the next few months.

Finally, based on the revisions of last week’s number, which results in a month over month decline in initial claims of roughly 40,000, a decline last seen in August and October of last year - both of which produced job gains over 600,000, I also expect that the March jobs report will show a gain at very least on the order of last month’s 264,000 gain, and quite possibly much better - 600,000 to 1,000,000.

Wednesday, March 31, 2021

Housing and the economy, now and in 2022 - recession caution?


 - by New Deal democrat

My long-form review and forecast of the housing market and its potential effect on the 2022 economy is up at Seeking Alpha.

If the market stays like 2014 when interest rates went up, no biggie. But if it’s more like the 1950s, we have a problem.


As usual, clicking over and reading should be informative for you, and it rewards me a little bit for my efforts.

Tuesday, March 30, 2021

This may be the most important housing chart of springtime 2021


 - by New Deal democrat

My longform housing market analysis is almost complete, and will probably get posted later today or tomorrow at Seeking Alpha. I’ll post a link here once that is done.

In the meantime, consider the following. The Case Shiller national house price index had another sharp increase in February, and is now up 11.2% YoY, the highest rate since the days of the housing bubble in 2002 (green in the graph below):

Meanwhile look at inventory (gold). In absolute terms, the seasonally adjusted inventory of new homes for sale bottomed last August and October. Last August inventory was down -12.3% YoY. As of last month, it was only down -4.6% YoY. At this rate of change, it will be *up* YoY by about May.

Multiple offers over asking prices within days if not hours are now becoming common. We are experiencing the hottest “seller’s market” in housing since the bubble. 

A sharp break in house prices and inventory levels is likely to be the biggest “surprise” in the housing market between now and Labor Day.

Monday, March 29, 2021

Coronavirus dashboard for March 28: good news ... < sigh > ... and bad news


 - by New Deal democrat

According to the CDC, there have been 30.3 Million *confirmed* cases of COVID-19 in the US, and 550,000 deaths.The true number of actual infections is probably much higher.


On the good news front, the CDC says that 36.2% of the entire US adult population has received at least one shot; a full 20%, or 1 in every 5 adults, has been fully vaccinated. Among those 65 years of age or higher, the news is even better: just shy of 3/4’s (72.4%) have received at least one dose, and just shy of 50% (48.4%) are fully vaccinated.

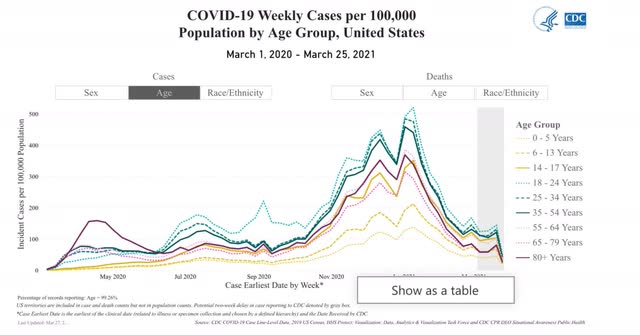
As a result, as of one week ago, both cases and deaths among senior citizens have declined by nearly 90% since their December peak. Here are cases: 


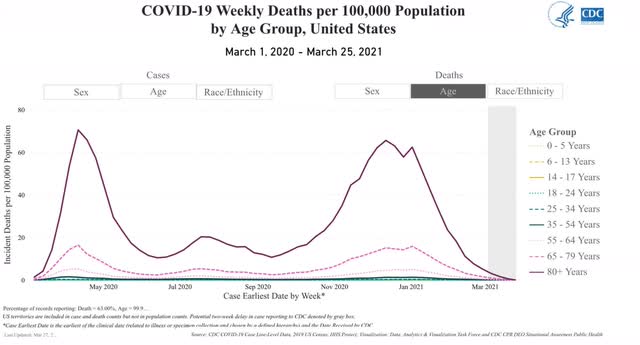
And deaths among senior citizens have all but disappeared:


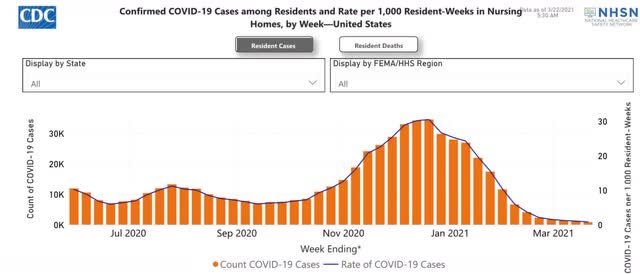
The situation among nursing home and other long term residential care facilities is even better. Cases have declined by 97% from nearly 35,000 to 828 weekly!:


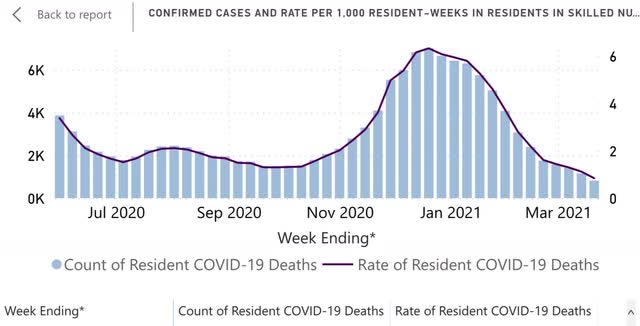
Deaths, which lag by a couple of weeks, are down 89%, from 7,000 to 825:


These can be expected to declined even further.

This is just an excellent, excellent result of the US’s vaccination program.

And now, <sigh> the bad news.

Let me start with this graphic, showing that the unvaccinated (I.e., a *much* younger demographic) are less hesitant to engage in indoor group activities, including those without masks, than those who have already been partially or completely vaccinated (skewing heavily towards seniors):


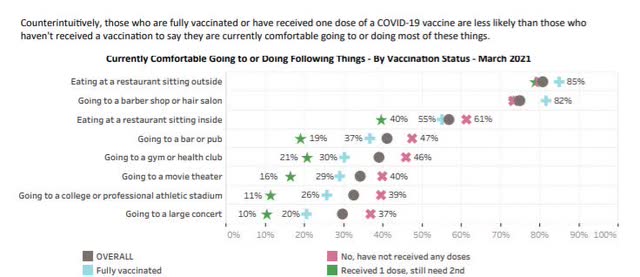
This, of course, was exemplified by the pictures we all saw of spring breakers in Florida.

And here is the result, as we see the havoc that has been wrought by the “UK variant” taking hold in Michigan, and the start of a resurgence in Florida:


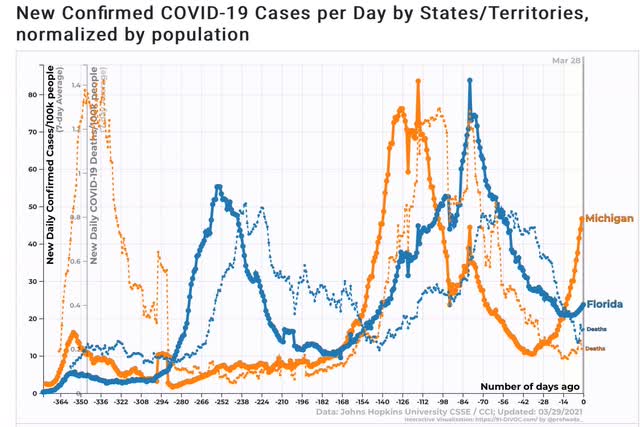
Michigan is on track to completely undo all of its progress in cases since December over the next 7 to 10 days. Deaths are about 3 weeks behind. Florida, the #1 export of which to other States is new COVID cases, is running about 4 weeks behind Michigan.

Here are cases and deaths for the US as a whole:


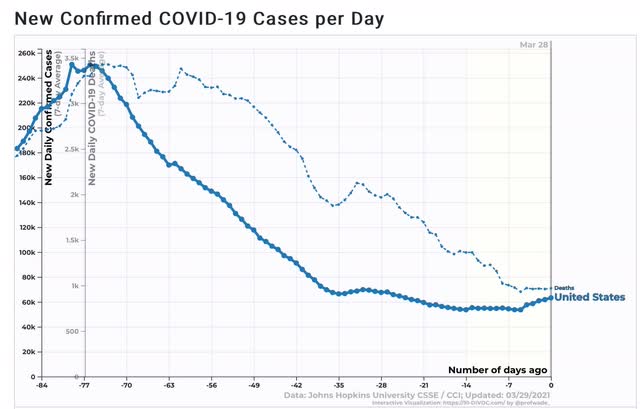
Cases have already turned back up. Deaths have just started to turn back up.

Where Michigan is now is about where I expect the US as a whole to be in 4 to 6 weeks. The only consolation is that another 25% of the US population should be partially or fully vaccinated by that time, meaning that it will be a younger demographic getting sick, and deaths will probably not approach their December peak of 3,000 a day.