Friday, February 1, 2013

Two Warnings From the Last GDP Report


The above graph shows the percentage change in exports (blue) and imports (red) from the preceding quarter.  The drop in exports is obviously related to the global slowdown.  The drop in imports (red) is probably indicative of a drop in consumer demand -- never a good thing.  Also note the drop in imports has occurred for two quarters -- again, not a good development.

Golly Gee, It's Another Mediocre Employment Report

From the BLS:

Total nonfarm payroll employment increased by 157,000 in January, and the unemployment rate was essentially unchanged at 7.9 percent, the U.S. Bureau of Labor Statistics reported today. Retail trade, construction, health care, and wholesale trade added jobs over the month.

The number of unemployed persons, at 12.3 million, was little changed in January. The unemployment rate was 7.9 percent and has been at or near that level since September 2012. (See table A-1.) (See the note and tables B and C for information about annual population adjustments to the household survey estimates.)

Just like the last few months, we've added some jobs,  but nowhere near enough to make a meaningful dent in long-term unemployment.  Here's a chart from the report:


The unemployment rate has stalled at right below 8% for the last five months.  Put another way, we're treading water.

Here is the hours worked and wage data:

In January, the average workweek for all employees on private nonfarm payrolls was unchanged at 34.4 hours. The manufacturing workweek edged down by 0.1 hour to 40.6 hours, and factory overtime was unchanged at 3.3 hours. The average workweek for production and nonsupervisory employees on private nonfarm payrolls edged down by 0.1 hour to 33.6 hours. (See tables B-2 and B-7.) 

Average hourly earnings for all employees on private nonfarm payrolls rose by 4 cents to $23.78. Over the year, average hourly earnings have risen by 2.1 percent. In January, average hourly earnings of private-sector production and nonsupervisory employees increased by 5 cents to $19.97. (See tables B-3 and B-8.) 

The change in total nonfarm payroll employment for November was revised from +161,000 to +247,000, and the change for December was revised from +155,000 to +196,000. Monthly revisions result from additional reports received from businesses since the last published estimates and the monthly recalculation of seasonal factors. The annual benchmark process also contributed to these revisions.

There's good news and bad news above.  The good news is we see some impressive revisions to November's and December's number.  There is also a decent one month bump in hourly earnings.  The bad news the average workweek for all employees was unchanged while the workweek for manufacturing edged down. 


Finally, we did get the following revisions to last year's data:


Bottom line, nothing has meaningfully changed regarding employment. 

--------------------
NDD here with my comments. My take is a little darker than Bonddad's, due to some negative numbers in the leading data in the report.

As I typically do, let's first look at the more forward-looking indicators in the report, which tell us where we are likely to go from here.  These contained several negative surprises:

  -  The manufacturing workweek declined 0.1 hour.  This is one of the 10 components of the LEI.  Overtime was flat at 3.3 hours.

  -  8100 temporary jobs were lost.  If anything, these have a positive secular bias.  We've now had two negative months in a row, so this is a cautionary sign.

  -  The number of workers unemployed for 0 - 5 weeks, a more forward looking indicator than initial jobless claims, increased by 90,000. This is the second large increase in a row, and is another cautionary sign.

On the other hand,

  -  Manufacturing added 4000 jobs.

  -  Construction added 28,000 jobs.

Important coincident data includes the index of aggregate hours, which measures the total number of working hours in the economy, which increased 0.1.

Another very important item is that average hourly earnings increased $.04 to $23.78.  They are up 2.1% YoY which is higher than the most recent inflation rate.  In other words, for the first time in 2 years, Joe Sixpack's real, inflation adjusted wages are increasing.  Too bad he just took a 2% cut in take home pay due to the increase in tax withholding.

Other data stayed at trend.  The employment to population ratio was flat at 58.6%.  The broad U-6 measure of unemployed was also flat at 14.4%.  Government shed 9000 jobs.

Finally, the revisions to the 2012 and earlier reports substantially change what was reported previously (although the BLS told us this was coming half a year ago). As of March 2012, the BLS added 422,000 jobs to previous reports. From April to December 2012, another 224,000 jobs were added, including upward revisions of 86,000 to November and 41,000 to December. This means that the total number of jobs added to the economy in 2012 actually exceeded those added in 2011. This makes the jobs recovery since the bottom of the recession in June 2009 significantly better than we thought it had been. But this is in the past.

My bottom line: the picture in the rear view mirror looks substantially better than it did before, thanks to the revisions to 2012 and earlier data.  The coincident data is ok, but not better.  The forward looking leading data for January was negative.

Morning Market Analysis


The Chinese market continues to rally.  The daily chart (top chart) shows that prices broke the support established by the strong rally that started in early December, but consolidated in a sideways move that lasted most of January.  Now prices are again moving higher, as noted by the MACD about to give a buy signal.  The weekly chart (bottom chart) shows prices have clear sailing until the 200 week EMA.


The weekly euro chart shows that prices have moved through the 200 week EMA and the 50% Fib level.  The shorter EMAs are also rising, as is the MACD.


The weekly copper chart has broken through the upper level of one triangle (red lines) pattern but is still contained by the second (blue lines).  Also note the weak MACD reading, negative CMF and jumbled EMA picture.


Thursday, January 31, 2013

Coincident indicators finish 2012 at new highs


. - by New Deal democrat

Despite the common belief that a recession is defined by two consecutive quarters of economic contraction, in fact the official arbiter of business cycles, the NBER, defines it as a pronounced and sustained downturn in production, sales, income, and employment. Measured by that yardstick, and subject to revisions as always, as of now there is no question that there was no recession in 2012. Production, sales, income and employment all finished at their highs for the year.

Here is an update of the graph I ran several weeks ago, in which the four coincident indicators of industrial production (blue), real retail sales (red), real personal income minus transfer receipts (green), and payrolls (orange), are normed to 100 at their previous highs in July:


As you can see, all four have made new highs as of December. In short and simple terms, no recession.

At least one prominent forecasting firm prefers to make use of real manufacturing and trade sales rather than real retail sales. Those were updated through November this morning, and those too made a new high (h/t Doug Short):


But what of yesterday's -0.1% GDP print? If it truly is a one-off negative due to the biggest reduction in military spending in 40 years, then it is meaningless in terms of the state of the underlying economy.

The more interesting, if depressing, question is, what if the 2% reduction in take home pay, plus policy mistakes such as the impending sequestration, cause this quarter to be another, consecutive period of contraction? Then it is at least possible that the NBER will pick December as the peak of business activity, and date any recession from that month.

But unless there are significant downward revisions, that will most certainly not be a vindication of those who said we were entering a recession "now" in September 2011, then most likely in the first quarter of 2012, then by midyear 2012, and then in July 2012.

Dollar Is At Critical Technical Support


The daily dollar chart (top chart) is approaching the 21.6/21.5 level, which is a critical technical support level.  Also note the overall bearishness of the chart: prices are below the 200 day EMA as are all the shorter EMAs, the MACD is is below 0 and declining, the CMF is negative and there was a big volume spike on yesterday's move lower.

The weekly dollar chart (bottom chart) shows more bearishness as well.  Prices are below the 200 week EMA as are the shorter EMAs.  The MACD is below 0, although the CMF just turned positive. 

Oil Creeping Higher -- At What Price Does It Start to Choke Growth?


The daily oil chart shows that oil has been in a rally since early December.  Currently, prices are above the 200 day EMA.  All three shorter EMAs have moved through the 200 day EMA, and all shorter EMAs are rising.  Volume is supportive.  While the CMF is very bullish, the MACD is weakening a bit.

A move through the 98 price level makes 100 the next logical price target.

So -- at what price does oil start to choke off recovery?

Brent just crossed the 115 level, which could slow growth in the EU.


Morning Market Analysis: Is It Time To Turn Bullish? Part IV; the Fundamentals

First, let's review the first three installments of this series.  In the first, I noted that in general the broad averages were in a bullish posture.  However, there are some concerns with market breadth that indicate the market rally is probably overbought at these levels.  In the second, I noted that the five largest ETFs were all very strong.  In the third, I noted that money was already flowing out of the corporate bond market, but that the Treasury markets were still hanging on, although the long end is right at technical support.

Stopping right here, there is plenty of information backing a bullish case.  The primary drawback to this argument are the breadth indicators, but they can either be overlooked, their importance downplayed relative to the other chart data or that a sell-off at these levels represents a buying opportunity. 

That leads to the fundamental economic argument.  And here is where I have problems.

Let's start with the US, whose economy has been stuck in a below par recovery for several years during which the year over year percentage change in GDP hasn't crossed 3%.  Unemployment is still at 7.8%.  Incomes are weak and wage growth is occurring at a snails pace.  Employment growth is occurring, but not at a strong clip.  In short, we're doing OK, but certainly not going gangbusters. And while it does appear that housing is finally coming out of its recession (which could have a decent multiplier effect for the overall economy), that re-emergence is countered by the fiscal follies in Washington, and the imminent impact of the first sequester on March 1.  The negative balance is made worse by the slight contraction in US GDP in the fourth quarter, largely as a result of government spending.

As I noted earlier this week, it appears that the UK is about to enter another recession, its third since the end of the Great Recession leading economic writers to coin the phrase triple dip.  Most importantly, there is little evidence suggesting that the UK government is willing to change its austerity loving ways, despite the fact that it doesn't work or that UK GDP has been more or less stagnant since it came out of recession.

The EU still has unemployment at 11.8% and rising with an overall economy in a recession.  There are signs that the economy has at least bottomed: deposit growth is increasing, Spanish and Portuguese bond yields are low and declining, business sentiment appears to have stabilized (although at very low levels), some money is being repatriated to the periphery, and bullish future market bets on the euro are at some of their highest levels in over 6 months.  The emerging consensus is that the worst of the crisis is over, largely thanks to the EUs July 2012 speech where they said they would to whatever it takes to save the euro alliance.  But, a recovery probably won't happen until at least the end of the second quarter if not later. 

Japan is facing extremely difficult economic headwinds.  On the good side, the yen is finally dropping.  This is extremely good news, as the Japanese experienced a balance of payments contraction during several months over the last year and half, creating a huge problem because the positive BOP was probably the only good things going for the country.  However, the country is still stuck in a deflationary economy with the new Prime Minister forcing the BOJ to publicly state the bank would (finally) accept a 2% inflation rate.  This is in combination with a fiscal package to encourage GDP growth.

The other emerging economies (Russia, Brazil and India) are now firmly in slower growth mode.  Russia is painfully hard to analyze thanks to a remarkable lack of consistent and transparent economic data, while Brazil is suffering from lower growth and higher inflation.  India recently lowered rates and reserve requirements because of growth concerns.  In short, the BRIC story has clearly lost steam and shows no signs of re-emerging as the predominate growth story.

That leaves China as the sole engine for global growth.  And here we run into intersecting issues.  First, they have clearly moved into slower growth mode, targeting GDP expansion in the range of 7%-8%.  Secondly, they are looking to slowly change their GDP model from an export  driven model to one that is consumer driven -- a process that is already taking place.  This means the Chinese growth will  not have the ancillary effect of increasing growth in raw materials exporters such as Brazil and Australia, but will instead lead to more internally led growth with Chinese company A selling goods and/or services to Chinese consumer B.  The former situation will still exist, but not to the same degree as before.

To sum up the national and international position, I just don't see strong enough overall growth in any economy to warrant a strong long position right now.  The best reading of the data is that we'll see a stronger second half, with the US housing market providing sufficient domestic stimulus combined with a more settled fiscal situation.  This would also allow the EU to continue strengthening or bottoming. The stronger second half argument leads could lead into the fact that the market is a leading indicator of anticipated future activity -- a fair point as far as it goes, but I just don't see the overall underlying strength to support the rally long term.

It could be that I'll miss the first part of the new rally while the fundamentals strengthen, meaning I miss the first leg.  That's fine.  It could also mean that we've got a different type or rally relative to the fundamentals going on -- an analysis I doubt as I'm not a strong believer in the, "this time it's different" economic argument.  However, while I'm not seeing an imminent collapse, I'm also not seeing growth to support a long and sustained meaningful rally.


Wednesday, January 30, 2013

Guess What? Austerity Doesn't Work in the US Either

From the BEA:

Real gross domestic product -- the output of goods and services produced by labor and property located in the United States -- decreased at an annual rate of 0.1 percent in the fourth quarter of 2012 (that is, from the third quarter to the fourth quarter), according to the "advance" estimate released by the Bureau of Economic Analysis. 

In the third quarter, real GDP increased 3.1 percent.The decrease in real GDP in the fourth quarter primarily reflected negative contributions from private inventory investment, federal government spending, and exports that were partly offset by positive contributions from personal consumption expenditures (PCE), nonresidential fixed investment, and residential fixed investment.  Imports, which are a subtraction in the calculation of GDP, decreased.
 

The downturn in real GDP in the fourth quarter primarily reflected downturns in private inventory investment, in federal government spending, in exports, and in state and local government spending that were partly offset by an upturn in nonresidential fixed investment, a larger decrease in imports, and an acceleration in PCE.

Let's look at a chart that shows the percentage change in GDP and the contributions to that change:


Oh look -- government spending dropped 6.6%, with a drop of 15% at the federal level and a 22% drop in defense spending.  And look what happened to overall GDP -- it contracted slightly.  Imagine that.  Where have I heard this argument before?


Morning Market Analysis: Is It Time To Turn Bullish? Part III

There's been a fair amount of press over the last few months, stating that individual investors were moving out of bonds and into stocks.  This would obviously bode well for equities, as this would provide a new source of money.  Let's start by looking at the weekly charts of the treasury market ETFs, from shortest to longest:


The entire treasury curve is consolidating in a sideways move.  The longer end of the curve (bottom three charts) are clearly more technically vulnerable to a correction.  All three charts have declining MACDs and weak (albeit slightly positive) CMF readings.  The TLTs (bottom chart) are now below the 50 week EMA and the IEI's and IEFS' (third from bottom and second from bottom) are making a move in that direction.  In addition, the longer charts also have declining shorter EMAs now.

In summation, the treasury market looks as though its ready to start selling off, especially considering the technical position of the long end.  However, we're not there yet.  In addition, treasuries are still a safe haven asset, so an international event could spook the markets into a short rally.


The corporate market is starting to show important technical break downs as well.  First, all three sections of the market (short; top chart; intermediate, middle chart and long, bottom chart) have broken long-term trend lines.  All three have declining MACDs and the long-term chart has a very negative CMF reading.

In short,  all three of these charts indicates that a sell-off is probably beginning in this area of the market.

The sum total of the above three chart is that the corporate market has broken trend and the treasury market is right on the verge.


Tuesday, January 29, 2013

Canada Hits A Speed Bump


The daily chart of the Canadian dollar (top chart) shows that last week prices dipped sharply, falling from ~101.75 to ~ 98.75, or a drop of a little over 3%.  Over the same period, prices fell through all the EMAs and are now in bear market territory.  On the weekly chart (bottom chart), notice that the upper 90s provide important technical support for the currency, with the next logical price target being the 38.2% Fib level from the mid-2012, fall 2012 rally.  Also note the declining MACD and CMF reading on this chart as well.  In short, it appears as though the Canadian dollar has suddenly switched to a bear market.  The question is, why?

Last week, the Canadian Central Bank stated it would keep interest rates at 1%.  More importantly, consider the following statements issued in conjunction with that announcement:

In Canada, the slowdown in the second half of 2012 was more pronounced than the Bank had anticipated, owing to weaker business investment and exports. Caution about high debt levels has begun to restrain household spending. The Bank expects economic growth to pick up through 2013. Business investment and exports are projected to rebound as foreign demand strengthens, uncertainty diminishes and the temporary factors that have weighed on resource sector activity are unwound. Nonetheless, exports should remain below their pre-recession peak until the second half of 2014 owing to a lower track for foreign demand and ongoing competitiveness challenges, including the persistent strength of the Canadian dollar.  Consumption is expected to grow moderately and residential investment to decline further from historically high levels. The Bank expects trend growth in household credit to moderate further, with the debt-to-income ratio stabilizing near current levels.

Relative to the October MPR, Canadian economic activity is expected to be more restrained. Following an estimated 1.9 per cent in 2012, the economy is expected to grow by 2.0 per cent in 2013 and 2.7 per cent in 2014. The Bank now expects the economy to reach full capacity in the second half of 2014, later than anticipated in the October MPR.

Core inflation has softened by more than the Bank had expected, with more muted price pressures across a wide range of goods and services, consistent with the unexpected increase in excess capacity. Total CPI inflation has also been lower than anticipated, reflecting developments in core inflation and weaker-than-projected gasoline prices. Total CPI inflation is expected to remain around 1 per cent in the near term before rising gradually, along with core inflation, to the 2 per cent target in the second half of 2014 as the economy returns to full capacity and inflation expectations remain well-anchored.

Reflecting all of these factors, the Bank has decided to maintain the target for the overnight rate at 1 per cent.  While some modest withdrawal of monetary policy stimulus will likely be required over time, consistent with achieving the 2 per cent inflation target, the more muted inflation outlook and the beginnings of a more constructive evolution of imbalances in the household sector suggest that the timing of any such withdrawal is less imminent than previously anticipated.

To translate:
  • The Canadian economy is growing slower than expected
  • High domestic debt levels are slowing growth
  • Exports will remain below pre-recession peaks until mid-2014 -- 6 quarters from now
  • Consumption is growing, although slowly
  • There has been an increase in excess capacity
  • Price pressures are muted
Put more succinctly, the Canadian economy is under pressure from both international and domestic pressures, leading to a lower growth situation.


A Quick Note on the Durable Goods Report From Yesterday

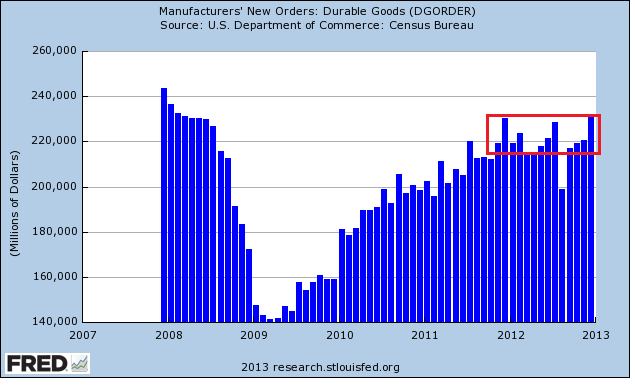
Yesterday we learned that US durable goods increased by 4.6% -- a good number.  Ex transportation and an defense expenditures, we still saw increases.  The report noted we've seen increases in seven of the last eight months.  This is technically true.  However, consider the following charts:


On the 5 year chart, we see more of a general plateau in orders over the last year.  And while yesterday's spike in orders could be the harbinger of a new upswing in orders, consider we're seen similar upswings twice in the last few 12-14 months, only to be disappointed.  Also ask yourself -- who would account for the increase in orders?  Japan, the UK and the EU are all in a recession or operating at very slow rates.  That leaves China, which is still growing but may not be large enough to sustain a continued increase.

Consider the lat year's worth of data:


Yes, there have been increases.  But you could also make an argument that orders have coalesced around the 220-224 level with the exception of the 08/12 drop.  

Also note this is occurring at a time when US manufacturing is sending mixed signals.  First note the latest Markit report (h/t Sober Look):

The U.S. manufacturing sector is showing signs of regaining momentum as the year comes to a close. Producers reported the largest monthly increase in output since April, with the rate of growth picking up for the third month in a row, suggesting output is now growing at an annualised rate of around 4% compared to the contraction seen back in October.

Such a steady run of improved growth of production is a good indication of a turning point in the economy as a whole, especially as it is feeding through to higher employment. The manufacturing sector has been acting as a drag on the official payroll numbers in recent months, but this situation looks to be changing as firms take on increasing numbers of workers in line with fuller order books.


But in contrast to the Markit report, we're still seeing weakish readings from various regional surveys.  The Empire State index is at -7.8, the Richmond Fed's index is at -12, the Philly Fed's index is at -5.8, and Texas' is at 12.9.  These are not strong numbers, nor are they very encouraging.

Put another way, we need more data to determine if this is the beginning of a new upswing in orders, or simply a strong move higher that will eventually disappoint (again).


Morning Market Analysis; Is It Time To Get Bullish?, Part II

Yesterday, I took a top down approach and focused on the broad averages and the respective market breadth.  Today, I wanted to look at the five largest sectors to get an idea for what these charts say.  According to S&P, the five largest areas of the market are technology (18.3%), financials (15.8%), health care (12.2%), consumer discretionary (11.7%) and energy (11.2%).  Together, these five sectors total almost 70% of the S&P 500.  Let's start with the largest percentage constituent down to the lowest.


The technology ETF is in bullish territory, trading about the 200 day EMA.  But prices are entangled with the shorter EMAs, largely because there has been no upward momentum since the first of the year.  The MACD has given a sell signal and the CMF is declining.  There is little in the chart to encourage bulls that the market is moving higher.


The daily chart of the financials ETF (top chart) shows that prices are in a clear uptrend.  After breaking through resistance at the beginning of the year, they have continued to move higher, using the 10 day EMA for technical support.  Although the MACD is moving sideways, the CMF indicates money is flowing into the market.  The weekly chart (bottom chart), is far more bullish.  Prices have broken through upside resistance of a consolidation triangle that has been forming for a year and a half.  Prices are using the 10 week EMA for technical support and momentum is rising.


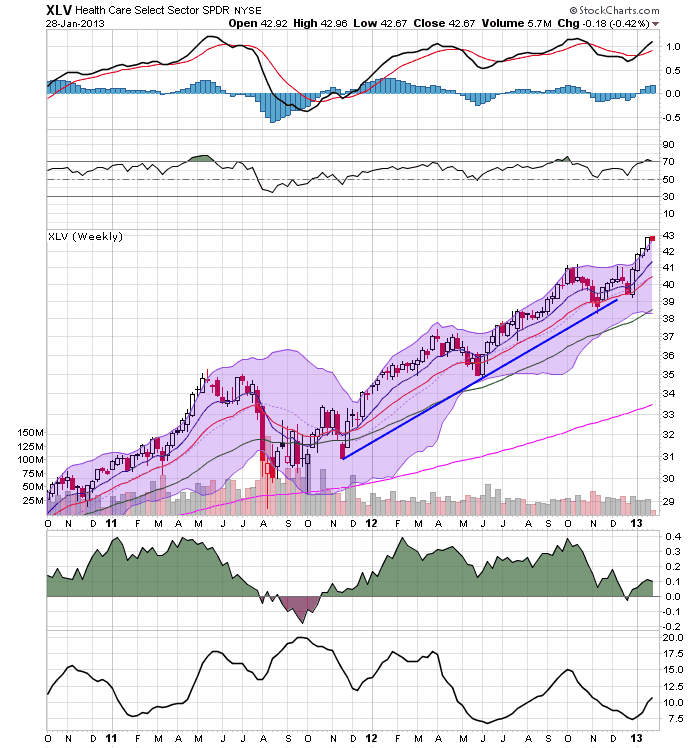
The health chart sectors daily chart (top chart) broke through resistance at the beginning of the year and has been consistently moving higher, using the 10 day EMA for technical support.  Also note the rising MACD and CMF.  However, the weekly chart (bottom chart) is far more impressive, showing that the market has been rallying for over year.  The MACD has given a buy signal (with room to run) but the CMF is declining.


The consumer discretionary daily chart (top chart) has much in common with the other sectors.  Essentially we see an early year break out with a continued rally for January.  The weekly chart (bottom chart) shows a sector that has been in an upward trend for about a year, with with a slight change in trajectory in May of last year.  However, this chart looks bullish, with all the EMAs rising, prices using the 10 week EMA for technical support and a buy signal from the MACD.


The daily chart of the energy ETF (top chart) show that prices have been rallying since mid-November.  The MACD is moving higher and the CMF is in a very strong position.  The weekly chart (lower chart) shows that prices are right at technical resistance and that they are forming a consolidating triangle.

In summation, only one sector (technology) is in bad shape.  Health care's and consumer discretionary's weekly chart shows an incredibly strong sector.   Financials weekly chart has broken through resistance and the energy's ETF is right on the cusp.  All the daily charts save the technology sector show sectors that have moved through resistance and are rallying.

 Bottom line: the sectors look really good.


Monday, January 28, 2013

UK Continues to Prove That Austerity Doesn't Work

The UK began implementing it's austerity program in 2010, under the theory that rampant budget deficits were destroying public confidence in the UK economy.  Therefore, the reasoning goes, if the UK cleaned up their fiscal act, the economy would return to full employment.

Here is a pie graph of UK spending for the years 2010-2012 which comes from the publicly available budget documents at the HM Treasury's website.


Total spending has fluctuated between 683 billion pounds in 2012 and 710 billion pounds in 2011 -- a situation which is consistent with the US experience over the same time.

Over the same period, we see the following GDP figures:


In the fourth quarter of 2010, we see a contraction.  In fact, since 4Q10, there have only been three quarters of positive economic growth.  As the Financial Times Reported:

The economy, which has essentially stagnated for 2½ years, pulled out of a shallow double-dip recession in the third quarter of 2012, but contracted again between the third and the fourth quarter by more than the expected 0.1 per cent. The economy was the same size in the fourth quarter as it was a year earlier.
“It remains too early to tell if the economy will triple-dip [which would require the economy to shrink again in the first quarter of this year], but today’s numbers have greatly increased the risk of a new recession and a downgrading of the UK’s triple A credit rating,” said Chris Williamson, an economist at Markit, a data company. “As such, the data pile ever more pressure on the chancellor to seek ways to revive the economy in the March Budget.”

As a result of this slow growth, the IMF is advising the UK to halt austerity measures:

The IMF chief economist has told the BBC that Chancellor George Osborne should consider slowing down austerity measures in his March budget.

"We think this would be a good time to take stock," said Olivier Blanchard, speaking to Radio 4's Today programme.

He also said the global economy was "not out of the woods yet".

In October, Mr Blanchard claimed in an IMF report that austerity had hurt wealthy countries such as the UK far more than most analysts had expected.

His comments come the day after the IMF cut its 2013 forecast for UK economic growth to 1% from the 1.1% predicted in October, and will put pressure on the chancellor as he prepares to deliver a speech at the World Economic Forum in Davos later on Thursday.


The IMF is making this recommendation, largely because they have now determined that the multiple associated with government spending is in fact far larger than they originally calculated.

In “Growth Forecast Errors and Fiscal Multipliers,” Messrs. Blanchard and Leigh calculate IMF and European economists underestimated the euro-for-euro effect of cutting government budgets. While economists expected that cutting a euro from the budget would cost around 50 cents in lost growth, the actual impact was more like 1.50 per euro.

Put another way, for every dollar cut ($1) the economy loses about $1.5 of growth.  This is entirely in line with the general thinking mentioned in my old (and very torn) Paul Samuelson Econ text from college.


Morning Market Analysis; Time To Become A Bull? Part 1: the Equity Markets

At the beginning of this year, I wrote the following about the market:

1.) The equity market is at a key technical area.  It has rallied to this point from its 2009 low on three rallies, each of decreasing strength.  Prices have stalled at the 140 level for the last four months.  This is occurring against a weakening momentum picture.

2.) Instead of moving into equities, investors have plowed money into bonds -- both treasury and corporate.  This has led to a lowering of the yield curve across the spectrum.

3.) The fundamental background is weak.  Although it's expanding, the economy is very sensitive to shocks.  Additionally, we now have a debt ceiling negotiation to deal with, which will be contentious, ugly and probably won't solve any problems.

4.) Internationally, we see a great deal of weakness as well.  The only bright spot is a recent rally in the Chinese market.

In short, there is little to think the equity markets can rally strongly at this point, save for a "China will save us all" rally. 


However, the SPYs have rallied since the beginning of the year.


The 60 minutes chart (top chart), shows that prices gapped higher at the beginning of the year in response to the fiscal cliff compromise.  Prices have continued to move higher as corporate earnings have come in.  The daily chart (bottom chart) shows that prices have broken through resistance around the 146 level, and have continued to move higher, using the 10 day EMA as technical support.  This has been accompanied by a rise in the MACD and CMF.

This move higher has been confirmed by two other averages:


Both the transports (top chart) and Russell 2000 (bottom chart) have followed the SPYs higher.


In contrast, we have the QQQs, which have been moving sideways since the beginning of the year.

The lack of upward movement from the QQQs is not fatal to the idea of the broader markets rallying.  However, it does raise a red flag regarding the strength of the overall rally, as one of the largest segments of the economy (technology) is not participating.  Let's look in a bit more detail at the market internals:


The NYSE breadth has been increasing for the better part of the last few years (top chart).  However, the NASDAQ breadth was in in overall rate of decline from 2012.  While it has rallied since November, it has rallied to a point of resistance that is carried over from 2012.


However, we see a different picture from the high low chart.  Both the NYSE (top chart) and NASDAQ high low charts show a clear uptrend.


On the more negative side, we have the NASDAQ and S&P 500 charts of stocks that are over the 200 week EMA.  Notice that both are at high (read overbought) levels).

In addition, we have this chart from Bespoke:


Given the above information, it appears that the bullish argument is starting to make some sense.  However, the QQQ situation (lack of movement, weak advance decline line), the number of stocks over the 200 day EMA and the chart above from Bespoke add enough negative information to give me pause.   And, there is this front page cover indicator from Barry that is also a bit halting (see also this from Sober Look).   Before we make a final call, let's look at three other areas: a sector performance breakdown of the SPYs, a look at the bond markets and an overview of the US economy's projected performance for the upcoming year.  I'll cover those on Tuesday, Wednesday and Thursday, respectively.


Saturday, January 26, 2013

Weekly Indicators: positive at mid-winter edition


- by New Deal democrat

December monthly data reported this past week featured the index of Leading Indicators, up 0.5. This was anticipated as initial claims rebounded from their Hurricane Sandy-induced increase in November. On a 6 month basis, these are now significantly positive. On the other hand, both new and existing home sales declined from November.

Let's start this look at the high frequency weekly indicators by checking out how the increase in tax withholding may be affecting consumer spending.

Consumer spending
  • ICSC -1.5% w/w +3.2% YoY

  • Johnson Redbook +1.8% YoY

  • Gallup daily consumer spending 14 day average $75 up $10 YoY
Gallup remains very positive. The ICSC varied between +1.5% and +4.5% YoY in 2012. Johnson Redbook is also in its generally YoY growth range from 2012.

Housing metrics

Housing prices
  • YoY this week. +2.8%
Housing prices bottomed at the end of November 2011 on Housing Tracker, and have averaged an increase of +2.0% to +2.5% YoY for the last year, so this is a particularly positive reading.

Real estate loans, from the FRB H8 report:
  • 0.0% w.w

  •  +2.4% YoY

  • +2.6% from its bottom
Loans turned up at the end of 2011 and averaged about 1% gains YoY through most of 2012, and have recently shown somewhat more YoY strength. This week was at the top of its recent range.

Mortgage applications
  • +9% w/w purchase applications

  • +26% YoY purchase applications

  • +8% w/w refinance applications
Purchase applications have been going sideways for 2 years. This week's reading finally moved above that range, and was the best reading since April 2011. Refinancing applications were very high for most of last year with record low mortgage rates, and after a brief retreat, are once again very strong.

Interest rates and credit spreads
  • -0.01% to 4.69% BAA corporate bonds

  • -0.03% to 1.87% 10 year treasury bonds

  • +.02% to 2.82% credit spread between corporates and treasuries
Interest rates for corporate bonds have been falling since being just above 6% two years ago in January 2011, hitting a low of 4.46% in November 2012. Treasuries have fallen from about 2% in late 2011 to a low of 1.47% in July 2012. Spreads have varied between a high over 3.4% in June 2011 to a low under 2.75% in October 2012. That weak was slightly negative, although the YoY changes remain very positive.

Money supply

M1
  • +1.4% w/w

  • +0.7% m/m

  • +9.4% YoY Real M1

M2
  • -0.2% w/w

  • +0.9% m/m

  • +6.2% YoY Real M2
Real M1 made a YoY high of about 20% in January 2012 and has generally been easing off since. This week's YoY reading bounced off last week's new low. Real M2 also made a YoY high of about 10.5% in January 2012. Its subsequent low was 4.5% in August 2012. Both are still quite positive in absolute terms.

Oil prices and usage
  •  Oil $95.88 up $0.32 w/w

  •   gas $3.32 up $.02 w/w

  • Usage 4 week average YoY +4.1%
Gas prices remain seasonally low. Unusually for the last year plus, the 4 week average turned positive YoY.

Employment metrics
Initial jobless claims
  •   330,000 down 5,000

  •   4 week average 351,750 down 7500
American Staffing Association Index
  • up 2 from 87 to 89 w/w up 3.7% YoY
Daily Treasury Statement tax withholding
  •  $162.0 B (adjusted for 2013 tax changes) vs. $161.2 B +0.5% YoY last 20 days

  •  $139.0 B (unadjusted) vs. $135.1 B up $3.9 B 1st 16 days of January monthly YoY
Employment metrics were in stark contrast this week. On the one hand, initial claims made another 5 year low this week. The increase in the ASA Index is normal in January. In the second half of 2012 the index's performance compared with 2011 declined significantly, although the absolute index was higher. This week, however, the Index equalled 2007 and only trails 2008. It is up 3.2% YoY. Tax withholding was again particularly weak for the second week in a row. Please note I am adjusting my YoY figures to reflect the increase in personal withholing tax rates since the first of the year.

Transport

Railroad transport
  •  -10,200 or -3.5% carloads YoY

  • +5700 or +3.5% carloads ex-coal

  • +29,700 or +13.5% intermodal units

  • +19,500 or +3.9% YoY total loads

  • 9 of 20 types of carloads up YoY, a decrease of 4 from last week
Shipping transport
  • Harpex up 3 to 359

  • Baltic Dry Index down 39 to 798
Rail transport has been whipsawing between very positive and very negative readings over the last month. This may well be the aftermath of the dock strikes. This week returned the data to its pre-strike pattern, although intermodal traffic was very stong. The Harpex index is still near its 3 year low of 352, but the Baltic Dry Index is well above its 52 week low, although still far off its 52 week high of 1100.

Bank lending rates
  • 0.230 TED spread down -0.002 w/w

  • 0.2037 LIBOR down .001 w/w
The TED spread is near its 52 week low. LIBOR is again at a new 52 week low and is close to a 3 year low.

JoC ECRI Commodity prices
  • up 1.40 to 129.53 w/w

  • +2.06 YoY
The most important negative this week was the Daily Treasury Statement, which, after accounting for the withholding tax increase, was for the second week in row, just barely positive YoY. Bond spreads were slightly negative for the week.

Almost everything else was slightly to very positive. Consumer spending remains quite positive, despite the increased tax withholding in their paychecks, although ever slightly less so than in the past month. Initial jobless claims were once again very positive. Bank lending rates and interest rate spreads also stayed very positive. Gas prices remain accomodative. House prices, loans, and especially mortgage applications are all positive, suggesting that the positive housing trend reflected in starts and permits will continue. Railroad and shipping data were up slightly.

The most important issue at the moment is when or whether the 2% increase in withholding tax rates will have an effect on consumers, although there's no significant evidence that it has shown up yet. Once again, this week the high frequency indicators show continued economic expansion.

Have a nice weekend.