Since early May when the Reserve Bank issued its Monetary Policy Statement for 2013-14, global growth has been uneven and slower than initially expected. The tail risks to global recovery had eased in the early part of the year, but that improvement was overtaken by the turmoil in financial markets because of the ‘announcement effect’ of the likely tapering of quantitative easing (QE) by the US Fed. In advanced economies (AEs), activity has weakened. Emerging and developing economies (EDEs) are slowing, and are also experiencing sell-offs in their financial markets, largely due to the safe haven flight of capital. Market expectations of QE taper and the consequent increase in real interest rates in the US have translated into a rapid appreciation of the US dollar and consequent depreciation of EDE currencies. Commodity prices have generally softened, but the price of crude remains elevated. Although the inflation outlook in AEs is still benign, upside risks remain in several EDEs.
Sober Look at the Markets has this chart to spotlight the issue:

We can break the world down into to distinct groups:
1.) the south south trade -- countries that benefited from a rapidly growth Chinese economy by selling raw materials to them T
2.) The non-S/S trade: countries that were largely purchasers of Chinese goods, namely the US and the EU.
Put differently, for the last 10-20 years, China has acted as the economic go between, effectively linking the developing world with the developed world.
Let's turn to some charts to highlight the above:

The BRIC ETF has moved through support at the 32.5 level in June falling to ~29. Over July it rallied to the 32.5 level bit hit resistance. Also note the potential double top at this price level. While the MACD has been rising, it's just advanced into positive territory and is about to give a sell signal. And while the CMF is positive, it is just barely so.

Taking a broader look at the developing world, we see the emerging market ETF is trading at two sets of fib levels -- those established in the sell-off from 2011 and those from the rally from mid-2012 to early 2013. Price also broke support established by the rally latest rally (red line) earlier this year and have been moving lower since.
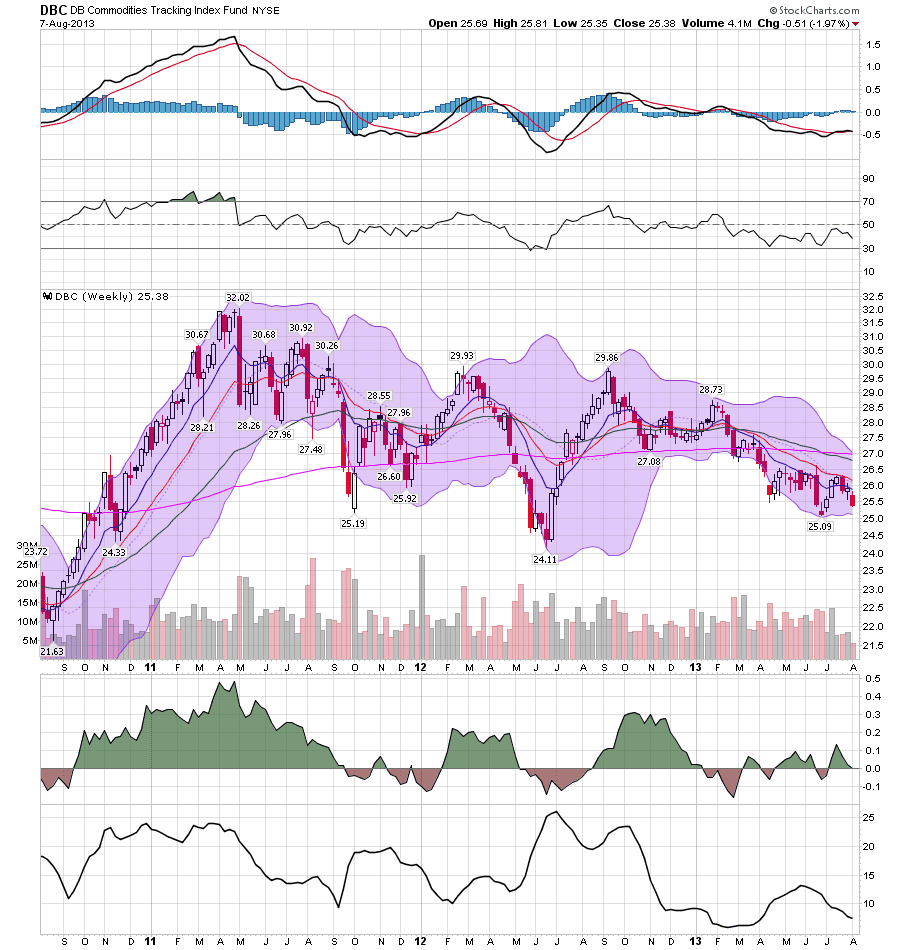
Overall, commodities are still very moderately priced, largely because of overall depressed world demand. The EU is coming out of a recession and the US has low demand. This has led to a decline in Chinese output, lowering commodity demand. And while the DBC is a bit too heavily weighted to oil, that overweight is actually keeping the ETF at higher levels as agricultural commodities are trading at low levels.

Ag prices have been dropping since early 2011, with a quick rise in the summer of 2012 that quickly petered out.
In contrast, we have Europe:

The Europe 350 ETF has been rallying since the beginning of the year, and recently broke through resistance a little over 42. The market is bullishly oriented with price above the shorter EMAs, and a rising MACD/CMF position.

The weekly SPY chart shows a market that has been rallying since mid-2011. We see tree periods of consolidation -- the spring of 2012, the fall of 2012 and the spring of 2013. Pay particular attention to the MACD as it may by signaling the really is getting a bit long in the tooth and in need of further consolidation or at least a rest.
Going forward, we have the following questions.
1.) Is the EU really getting ready to grow again?
2.) Will we see continued growth in the US?
3.) What of China -- what will happen there?
4.) The status of the EDEs
5.) The other BRICs.
I'll touch base on all of those next week.