The Good
Consumer credit increased 4.4%: the entire increase is the result of non-revolving credit. While some of this is most likely for items such as cars and houses, also expect yet another increase in student loan debt to be at least partially responsible. See this story from Reuters for the implications.
Producer Prices increased .3%. The reports details were very non-inflationary: core rates didn't increase, while the year over year number came in at 1.4%.
Import prices were tame as well: Import prices have recorded little change the past 2 months, after decreasing 1.8 percent over
the prior 4 months. The recent decline contributed to a 0.4 percent drop in import prices for the year ended
in August. The decrease from August 2012 to August 2013 was led by lower nonfuel prices, which more
than offset higher fuel prices.
Retail sales increased .2% month over month and 4.7% year over year. Probably the best news in this report was from the auto sales sector, which continue to show consumers buying cars at solid rates.
Let's look at two charts on the data:
First, the month over month rates of change are not setting any records, but they have been consistently positive, printing between 0% and 1% over the last year-year and a half.
Second, retail sales are now at higher levels than before the expansion.
But for me, this is the best chart from teh real retail sales data:
The year over year percentage change in real retail sales has printed between 1.6% and 3.7% over the last 12 months, with most of the readings printing about 2.5%.
The Neutral
NFIB report on small business was more or less unchanged. However, this report has on an overall basis been very weak for the duration of this expansion. Here's a chart of the macro level reading:
Conclusion: there wasn't enough data this week to draw a major conclusion on the economy. The good news was prices are clearly contained. This will allow the Fed to taper their asset purchases as needed or viewed appropriate. While the NFIB news was disappointing, this is the same result the survey has printed for this expansion. The best news was retail sales, which continue to show purchasing by consumers at a consistent rate.
Let's turn to the markets:
The daily chart still points to an overall consolidation. Price printed at the 170.97 level in early August, which is the year high. Last week, prices gapped higher, but their advance stalled in the 169/169.5 area. Momentum is weakening and volume in flow is neutral at best.
The 30 minute chart puts last week's price action in a bit more detail. Prices rallied on Monday and gapped higher on Tuesday morning. But they remained near unchanged for the remainder of the week, stuck in the 169/169.5 area.
The treasury market is still trying to find a low. The belly of the curve (the IEFs, top chart) fell through support at the 100 level in mid-August, while the TLTs moved through the 105 level at the same time. Both markets are now trying to consolidate losses. The chart indicators are all very negative; all the shorter EMAs are moving lower and prices are using them as resistance. Both chart have negative momentum and weak volume readings.
Monday, September 16, 2013
Sunday, September 15, 2013
Breaking bad thoughts
- by New Deal democrat
Fans all know that we are down to the final three episodes of "Breaking Bad."
I'm not the biggest fan in the world, but here's my two cents on things to watch for, and one whiny but substantial criticism.
1. Marie is in great danger. I've watched to see if anyone has picked up on this in the past week, but I haen't seen anything. Assuming Hank is killed or gravely wounded in the firefight, one of the natural things for the gang to do is check his cellphone to find out if anybody else knew where he was, and of their involvement in his death. Such a check would show exactly one phone call, made moments before the firefight. That person is the only one who may be able to place Hank, and them, at the scene. That leads directly to Marie.
2. Walt Jr. almost has to die. This show believes in Karma, and there is an innocent dead boy in the desert who must be atoned for. The innocence of Walt Jr. has been scrupulously maintained during the series. Exactly what purpose has that character served in the series if not ultimately to be sacrificed as a holocaust?
The innocent dead boy in the desert leads me to my criticism. In real life such a disappearance would be a top priority for law enforcement, and if there was any sense of them slacking off, the parents would be all over the local media to make sure the story stayed in the limelight. That investigation, which would pull out all the stops, would inevitably lead to the realization that crew members on the train that passes by the area might have information. And when contacted, they would almost certainly remember the odd occurrence of the pick-up truck stopped on the railroad tracks in the exact area where the boy went missing. Law enforcement might go very public with trying to locate that driver. If they operated on the idea that the two unusual occurences didn't just happen by chance, they might also check to see if there were any issues with anything shipped on that train.
In this drama, aside from Jesse's guilty conscience, there's been barely a peep. Even after Jesse's confession, there's no indication that the boy's grieving parents were contacted. Just once I'd like to see the death of a tangential innocent character develop into a major plot line in a drama.
3. The final episode is supposedly titled "Granite State." Given the established pun of "Face Off," this might be a reference to Walt's ultimate fate: not dead, not just in a prison, but like Hector Salamanca, doomed to spend the rest of his life atoning for his sins in helpless and hopeless immobility, in a "granite state."
We'll see soon enough.
A thought for Sunday: Millenials and the emerging Democratic majority
- by New Deal democrat
[You know the drill. It's Sunday, and I get to mouth off on whatever I feel like. Regular nerdy economic blogging will resume tomorrow.]
Going on 10 years ago, Thomas F. Schaller wrote of an emerging Democratic majority in "Whistling Past Dixie." The last two presidential elections have shown the accuracy of that strategy, as Barack Obama put together electoral coalitions that did not require the Confederacy to win, although he got a few of those states anyway. This has literally been the first time since 1928 that the South has been relegated the losing side of national coalition politics.
But just as it took several decades for the GOP's "Southern Strategy" to achieve real dominance, so the shift towards the left in US politics is taking a long time to play out. Peter Beinart wrote an excellent piece on that shift, The New New Left," last week.
I argued this point with DHinMI back in my Daily Kos days, contending that Howard Dean was the progressive equivalent of Barry Goldwater, the trailblazer who lost badly but showed the way (including the solicitation of a multitude of small individual contributions, a strategy Obama also embraced in 2008 and 2012). I further contended that Barack Obama was a transitional rather than a transformational president, just as Richard Nixon embraced Keynesianism and established OSHA and the EPA even as he also started the rightward shift that came to fruition with Ronald Reagan. Beinart shows how this is happening in the traditional way -- that is, one funeral at a time.
Generations are not monolithic, but a 55/45 shift in political thinking in an age group can have a profound effect over time. The Silent Generation has traditionally skewed conservative, early Boomers liberal, and late Boomers and Gen X conservative. Now the Millenials are skewing liberal, and it is likely to have a profound effect on the center of gravity in US politics.
Beinart's analysis starts with the premise that:
[Political] generations [are] born from historical disruption.... [P]eople are disproportionately influenced by events that occur between their late teens and mid-twenties.... After that, lifestyles and attitudes calcify. For Mannheim, what defined a generation was the particular slice of history people experienced during those plastic years.Indeed, this fossil has passed on the hopefully sage wisdom to many young people that "probably 90% of the most important decisions you will ever make will be made between ages 18 and 25. You just won't know it until much later."
And Obama's autobiography shows that his political viewpoint is classic late Boomer:
Obama, in describing his own political evolution, does that again and again: “as disturbed as I might have been by Ronald Reagan’s election … I understood his appeal” (page 31). “Reagan’s central insight … contained a good deal of truth” (page 157). “In arguments with some of my friends on the left, I would find myself in the curious position of defending aspects of Reagan’s worldview” (page 289).This alliance of aging "Reagan democrats" late Boomers and Gen X is now the status quo ante:
For the past two decades, American politics has been largely a contest between Reaganism and Clintonism. In 1981, Ronald Reagan shattered decades of New Deal consensus by seeking to radically scale back government’s role in the economy. In 1993, Bill Clinton brought the Democrats back to power by accepting that they must live in the world Reagan had made. Located somewhere between Reagan’s anti-government conservatism and the pro-government liberalism that preceded it, Clinton articulated an ideological “third way”: Inclined toward market solutions, not government bureaucracy, focused on economic growth, not economic redistribution ....But the broad economic stagnation that started when the tech boom crashed at the turn of the Millenium, and intensified into the worst Hard Times since the 1930's in 2008, has created a wholly different worldview among a majority of the Millenial generation:
[This has been] a genuine historical disruption. Compared to their Reagan-Clinton generation elders, Millennials are entering adulthood in an America where government provides much less economic security. And their economic experience in this newly deregulated America has been horrendous....Millenials have experienced the full fruition of the old-fashioned trickle-down conservative economic philosophy. The majority of them have decided that it has been a disaster for them, and are beyond convincing otherwise. An additional number of open-minded older voters have arrived at the same conclusion (and I have had detailed discussions with both types).
By 2012, data showed how economically bleak the Millennials’ first decade of adulthood had been .... But it was worse than that. If Millennials were victims of a 21st-century downward slide in wages, they were also victims of a longer-term downward slide in benefits....
[I]n addition to coming of age in a terrible economy, Millennials have come of age at a time when the government safety net is far more threadbare for the young than for the middle-aged and old.
As the nomination of Cory Booker, a thorough Wall Street corporatist whose liberalism is that it is OK with him if your son is gay or your daughter has an abortion, shows, the progressive argument has a long, long way to go. But Beinart has made a potent argument that it is happening -- as I said above, one funeral at a time.
Saturday, September 14, 2013
Weekly Indicators: Manufacturing and transport break out to the upside edition
- by New Deal democrat
Month over month August data included a rise in real retail sales (and July revised positively), a decline in consumer sentiment, an increase in the PPI, a decrease in import and export prices, and falling business and wholesale inventories.
Let's start this edition of the high frequency weekly indicators by looking at the real economic version of the Dow signal, i.e., comparing manufacturing with transport:
Steel production from the American Iron and Steel Institute
- +0.9% w/w
- +6.9% YoY
Steel production over the last several years has been, and appears to still be, in a decelerating uptrend. It had been negative YoY for last 3 weeks, but turned positive this week.
Transport
Railroad transport from the AAR
- +6000 carloads up +2.2% YoY
- +7200 carloads or +4.7% ex-coal
- +14,400 or +6.7% intermodal units
- +20,500 or +4.2% YoY total loads
- Harpex up +1 to 406
- Baltic Dry Index up +284 to 1636
Employment metrics
Initial jobless claims
- 292,000 down -21,000
- 4 week average 321,250 down -7250
The American Staffing Association Index was steady at 97. It is up +5.5% YoY
Tax Withholding
- $67.3 B for the first 8 days of September vs. $60.4 B last year, up +6.9 B or +11.5%
- $146.3 B for the last 20 reporting days vs. $129.4 B last year, up +16.9 B or +13.1%
Initial claims made a new 6 year low this past week, due to state reporting glitches. Next week's numbers will average out to the real story. In any event, they remain firmly in a normal expansionary mode. Like each of the last three years that this same, a good, downside breakout has occurred.
Temporary staffing had been flat to negative YoY in spring, but has broken out positively in the last two months. Tax withholding, after a relatively poor August, is again posting better comparisons.
Consumer spending
- ICSC +1.5% w/w +2.3% YoY
- Johnson Redbook +4.6% YoY
- Gallup daily consumer spending 14 day average at $87 up $17 YoY
Oil prices and usage
- Oil down -2.32 to $108.21 w/w
- Gas down -$0.02 at $3.59 w/w
- Usage 4 week average YoY down -0.1%
Interest rates and credit spreads
- 5.49% BAA corporate bonds up +0.09%
- 2.92% 10 year treasury bonds up +0.16%
- 2.57% credit spread between corporates and treasuries down -0.07%
Housing metrics
Mortgage applications from the Mortgage Bankers Association:
- -3% w/w purchase applications
- +7% YoY purchase applications
- -20% w/w refinance applications!
Housing prices
- YoY this week +10.6%
Real estate loans, from the FRB H8 report:
- -2 or -0.1% w/w
- -0.1% YoY
- +1.2% from its bottom
Money supply
M1
- +0.5% w/w
- -0.1% m/m
- +8.7% YoY Real M1
M2
- +0.1% w/w
- +0.1% m/m
- +4.6% YoY Real M2
Bank lending rates
- 0.244 TED spread up +0.004% w/w
- 0.182 LIBOR down -0.002 w/w
JoC ECRI Commodity prices
- down -0.23 to 123.27 w/w
- -1.10 YoY
This week was generally positive, with the same concerns about the long leading indicators as I've had for the past several months. Interest rates are negative, mortgage applications and real estate loans have turned negative (although purchase mortgage applications are still steadily positive YoY), and money supply is decelerating although still positive.
The shorter leading indicators of initial jobless claims and interest rate spreads are positive, although we need to see how jobless claims are revised next week. Temporary employment has turned strongly positive in the last two months. The oil choke collar is engaged but has eased off a bit, although commodities have turned negative.
The coincident indicators look like they have broken out positively. Rail traffic, which had been a real concern, has broken to the upside strongly for several weeks in a row, as has shipping. Steel production broke out to the upside this week as well. Consumer spending is holding up reasonably well. Bank lending rates are at or near their lows. Tax withholding has also improved moderately in the last couple of weeks. House prices remain strongly positive.
Barring Debt Ceiling Debacle part Deux in Washington, or a further oil price shock, the economy appears ready to pick up steam again for the rest of the year. I remain much more cautious about 2014.
Have a nice weekend.
Friday, September 13, 2013
Why America Is Not the Greatest Country Anymore
Here's something a little bit different. It's from the first episode of the Newsroom and it's a great monologue. And I get exactly how Jeff Daniels feels.
Retail sales un-stagnate
- by New Deal democrat
Last weekend I re-read the 2013 outlook I posted in two parts back in January. That boiled down to (1) almost complete stagnation in the first half (2) followed by a rebound in the second. An astute commenter asked me last weekend if the rebound in some of the Weekly Indicators heralded that rebound. I think it does, and this morning's retail sales report for August (and especially the upward revision to July) adds some incremental evidence to that hypothesis.
Since consumer inflation was +0.2% in July, the revision means that real retail sales increased +0.2% in that month. August inflation was probably +0.1% +/-0.1%, so most likely real retail sales ticked up in August as well. Here's an updated graph of real retail sales through July:
At the moment it looks like Washington will manage to avoid Debt Ceiling Debacle part Deux, and if that happens I see no reason why we won't have continued expansion through the rest of this year.
Wherein I nit-pick Profs. Paul Krugman and Mark Thoma: respect the Oil choke collar!
-by New Deal democrat
Yesterday Bonddad linked to an excellent article by Prof. Mark Thoma on why the recovery has been so sluggish. If you haven't read Thoma's piece yet, by all means do so. This morning Prof. Paul Krugman amplified on a post from earlier this week about how this recovery, like the last two, has been distinctly un-V-ish, citing the zero lower interest rate bound and nominal wage rigidity.
One picks fights with such luminaries at one's peril, but this is more nit-picking. You see, actually, if you measure by real GDP, the recovery actually was rather V -ish:
There were 6 quarters from peak to trough, and 8 quarters till we surpassed the prior peak.
Additionally, there are a host of other measures that started off looking V -ish, but then faltered at about midyear 2010. Here's one of them, industrial production:
What could have caused the downshifting of so many indicators into second gear at around that time? Oh, yeah:
That's when Oil ramped up back over $3 a gallon and stayed there. Give me $1.60 a gallon gas, or even $2.60 a gallon gas, instead of $3.60 a gallon gas, and I'll show you one heckuva V-shaped trajectory.
From Bonddad:
Earlier this week I noted that oil's price charts are very bullish. In addition, the political situation in the Middle East is such that it will provide upward pressure on oil. Here's an updated daily chart:
Prices are still elevated. While momentum and volume inflow are weakening, they are still positive and fairly strong.
Chinese Economy and Market Rebounding
The news coming out of China has been very positive over the last few months:
Chinese industrial output, investment and retail sales all strengthened in August, the latest evidence of an upswing in growth in the world’s second-biggest economy.
Coming on the heels of robust export figures and
muted inflation, the recent data leave little doubt that the Chinese
economy has rebounded after a shaky half-year. Although analysts still
question the durability of the recovery, China’s strong run of form
should help the government hit its target of 7.5 per cent growth this year.
This has been positive for the Chinese market:
Starting in January we see the first leg down, moving from the 2450 to 2200 area, or a loss of about 2%. Prices rebounded until the beginning of June when they dropped sharply, moving from 2300 to 1950, or a move of about 15%. But since then, prices have been rebounding. Several days ago they moved through the 200 day EMA on a strong candle print.
The chart about shows this is an important development for the Pacific region, ex-Japan. Remember that most of SE Asia -- Hong Kong, South Korea, Taiwan, Singapore, Malaysia and others feed into the Chinese market in some manner.
Thursday, September 12, 2013
Five Years After The Collapse ....
Barry over at the Big Picture blog and Mark Thoma have been doing some great work over the last week, looking back at the financial collapse to get an idea for what happened and what we've learned (or not learned).
Here's a video with Barry:
And here is a link to a piece written by Mark Thoma on why the recovery has been so slow.
Both piece offer some great analysis and perspective and are well worth the reading or viewing.
Here's a video with Barry:
And here is a link to a piece written by Mark Thoma on why the recovery has been so slow.
Both piece offer some great analysis and perspective and are well worth the reading or viewing.
hy
has the recovery from the recession been so slow? Part of the answer is
that recessions caused by a collapse of the financial sector are among
the hardest to recover from. But that is not the only reason for the
slow recovery. - See more at:
http://www.thefiscaltimes.com/Articles/2013/09/10/10-Real-and-Bogus-Reasons-Slow-Recovery#sthash.UzWFMNl2.dpuf
hy
has the recovery from the recession been so slow? Part of the answer is
that recessions caused by a collapse of the financial sector are among
the hardest to recover from. But that is not the only reason for the
slow recovery. Many additional factors are often cited for the
agonizingly slow recovery, some real and some bogus. Let’s begin with
the real reasons for the slower than necessary recovery, and then turn
to bogus reasons that have been used to support ideological goals: - See
more at:
http://www.thefiscaltimes.com/Articles/2013/09/10/10-Real-and-Bogus-Reasons-Slow-Recovery#sthash.UzWFMNl2.dpuf
hy
has the recovery from the recession been so slow? Part of the answer is
that recessions caused by a collapse of the financial sector are among
the hardest to recover from. But that is not the only reason for the
slow recovery. - See more at:
http://www.thefiscaltimes.com/Articles/2013/09/10/10-Real-and-Bogus-Reasons-Slow-Recovery#sthash.UzWFMNl2.dpuf
hy
has the recovery from the recession been so slow? Part of the answer is
that recessions caused by a collapse of the financial sector are among
the hardest to recover from. But that is not the only reason for the
slow recovery. Many additional factors are often cited for the
agonizingly slow recovery, some real and some bogus. Let’s begin with
the real reasons for the slower than necessary recovery, and then turn
to bogus reasons that have been used to support ideological goals: - See
more at:
http://www.thefiscaltimes.com/Articles/2013/09/10/10-Real-and-Bogus-Reasons-Slow-Recovery#sthash.UzWFMNl2.dpuf
hy
has the recovery from the recession been so slow? Part of the answer is
that recessions caused by a collapse of the financial sector are among
the hardest to recover from. But that is not the only reason for the
slow recovery. Many additional factors are often cited for the
agonizingly slow recovery, some real and some bogus. Let’s begin with
the real reasons for the slower than necessary recovery, and then turn
to bogus reasons that have been used to support ideological goals: - See
more at:
http://www.thefiscaltimes.com/Articles/2013/09/10/10-Real-and-Bogus-Reasons-Slow-Recovery#sthash.UzWFMNl2.dpuf
hy
has the recovery from the recession been so slow? Part of the answer is
that recessions caused by a collapse of the financial sector are among
the hardest to recover from. But that is not the only reason for the
slow recovery. Many additional factors are often cited for the
agonizingly slow recovery, some real and some bogus. Let’s begin with
the real reasons for the slower than necessary recovery, and then turn
to bogus reasons that have been used to support ideological goals: - See
more at:
http://www.thefiscaltimes.com/Articles/2013/09/10/10-Real-and-Bogus-Reasons-Slow-Recovery#sthash.UzWFMNl2.dpuf
Actually, it's Republican Leadership That Is Causing "Uncertainty"
One of the more common arguments from the political right about why the recovery is so slow is that government is creating "uncertainty." Barry explained why this is an incredibly stupid argument in a Washington Post Column. Mike Konczal over at the Next New Deal pretty much destroyed the "uncertainty index" created to show "uncertainty." I would simply put it like this: there is always uncertainty because time is linear and we can't see into the future.
But if you really want to blame someone for creating uncertainty, look at the Republican House. Starting with the debt negotiations two years ago that resulted in a Standard and Poor's credit downgrade, to last years budget fiasco to the current situation where the House leadership literally can't get anything done, the reality is this: Republican House leadership is creating a ton of political uncertainty through their utter ineptness.
There are times when it looks like Speaker John Boehner and Majority Leader Eric Cantor have no idea how to run the House Republican Conference.
In just two frantic days, rank-and-file House Republicans sidelined leadership’s plan to fund the government and take another nonbinding, quixotic vote on defunding President Barack Obama’s signature health care law. These Republicans said the leadership plan is too weak, lacks a long-term strategy and is akin to waving a white flag on Obamacare.
.....
But if you really want to blame someone for creating uncertainty, look at the Republican House. Starting with the debt negotiations two years ago that resulted in a Standard and Poor's credit downgrade, to last years budget fiasco to the current situation where the House leadership literally can't get anything done, the reality is this: Republican House leadership is creating a ton of political uncertainty through their utter ineptness.
There are times when it looks like Speaker John Boehner and Majority Leader Eric Cantor have no idea how to run the House Republican Conference.
In just two frantic days, rank-and-file House Republicans sidelined leadership’s plan to fund the government and take another nonbinding, quixotic vote on defunding President Barack Obama’s signature health care law. These Republicans said the leadership plan is too weak, lacks a long-term strategy and is akin to waving a white flag on Obamacare.
.....
It’s a pattern that’s played out over the course of this Congress.
Boehner and Cantor propose a plan, announce a vote and conservatives
bail.
Boehner and Cantor have spoken about the need for immigration reform, yet there’s not a shred of urgency among House Republicans to pass it. The two GOP leaders endorsed Obama’s proposal to launch military attacks on Syria, yet just a few dozen Republicans — at most — agreed with them. The farm bill that Cantor oversaw remains unfinished. The appropriations process has been a debacle, as House Republicans have violated their own budget guidelines. And in private discussions, GOP leadership aides acknowledge they have absolutely no idea how they’ll lift the $16.7 trillion debt ceiling. That deadline hits in mid-October.
Canada Continues Its Economic Doldroms
From the latest interest rate decision by the Canadian Central Bank:
The global economy continues to expand broadly as expected, but its dynamic has moderated. In the United States, the process of normalization of long-term interest rates has begun in the context of stronger private domestic demand. Recent data, however, point to slightly less momentum overall than anticipated. In Europe, there are early signs of a recovery, and Japan’s situation remains promising. In a number of emerging market economies, financial volatility has increased, adding uncertainty to growth prospects, although China continues to grow at a solid pace. Commodity prices have been relatively stable, with geopolitical stresses putting some upward pressure on global oil prices.
Uncertain global economic conditions appear to be delaying the anticipated rotation of demand in Canada towards exports and investment. While the housing sector has been slightly stronger than anticipated, household credit growth has continued to slow and mortgage interest rates are higher, pointing to a continued constructive evolution of household imbalances. Looking through the choppiness of the recent data, the level of Canada’s GDP is largely consistent with the Bank’s July forecast. The output gap is expected to begin to narrow in 2014.
Inflation in Canada remains subdued. With inflation expectations well-anchored, both core and total CPI inflation are expected to return slowly to 2 per cent as the output gap closes.
Against this backdrop, the Bank has decided to maintain the target for the overnight rate at 1 per cent. As long as there is significant slack in the Canadian economy, the inflation outlook remains muted, and imbalances in the household sector continue to evolve constructively, the considerable monetary policy stimulus currently in place will remain appropriate. Over time, as the normalization of these conditions unfolds, a gradual normalization of policy interest rates can also be expected, consistent with achieving the 2 per cent inflation target.
Overall, Canada is in in a situation much like the US.
While the country is growing, it is doing so at a slower rate.
Unemployment is still at stubbornly high levels.
But inflation is clearly under control.
But the interest rate is still low, indicating that low rates are not having the stimulative effect most would want.
Canada appears to be in the same situation as the US: growth at a rate just fast enough to keep us out of recession, but not enough to hit escape velocity.
The global economy continues to expand broadly as expected, but its dynamic has moderated. In the United States, the process of normalization of long-term interest rates has begun in the context of stronger private domestic demand. Recent data, however, point to slightly less momentum overall than anticipated. In Europe, there are early signs of a recovery, and Japan’s situation remains promising. In a number of emerging market economies, financial volatility has increased, adding uncertainty to growth prospects, although China continues to grow at a solid pace. Commodity prices have been relatively stable, with geopolitical stresses putting some upward pressure on global oil prices.
Uncertain global economic conditions appear to be delaying the anticipated rotation of demand in Canada towards exports and investment. While the housing sector has been slightly stronger than anticipated, household credit growth has continued to slow and mortgage interest rates are higher, pointing to a continued constructive evolution of household imbalances. Looking through the choppiness of the recent data, the level of Canada’s GDP is largely consistent with the Bank’s July forecast. The output gap is expected to begin to narrow in 2014.
Inflation in Canada remains subdued. With inflation expectations well-anchored, both core and total CPI inflation are expected to return slowly to 2 per cent as the output gap closes.
Against this backdrop, the Bank has decided to maintain the target for the overnight rate at 1 per cent. As long as there is significant slack in the Canadian economy, the inflation outlook remains muted, and imbalances in the household sector continue to evolve constructively, the considerable monetary policy stimulus currently in place will remain appropriate. Over time, as the normalization of these conditions unfolds, a gradual normalization of policy interest rates can also be expected, consistent with achieving the 2 per cent inflation target.
Overall, Canada is in in a situation much like the US.
While the country is growing, it is doing so at a slower rate.
Unemployment is still at stubbornly high levels.
But inflation is clearly under control.
But the interest rate is still low, indicating that low rates are not having the stimulative effect most would want.
Canada appears to be in the same situation as the US: growth at a rate just fast enough to keep us out of recession, but not enough to hit escape velocity.
Wednesday, September 11, 2013
The UK Is Printing Strong Economic Numbers
The numbers coming out of the UK over the last few months have been very impressive. First, consider the Markit Services index:
August’s survey of UK service providers signalled continued strong growth of activity and new business. Activity rose at the sharpest pace since December 2006, while growth in new work was the best seen since May 1997.
Capacity continued to be tested, with backlogs of work rising at the sharpest pace for over 13 years. However, employment broadly stagnated, in part due to an inability of service providers to replace leavers.
The headline seasonally adjusted Business Activity Index registered 60.5 in August. Improving on July’s 60.2, the latest reading was the highest in over six-and-a-half years. Over a quarter of the survey panel registered an increase in activity.
Here is the accompanying chart:
The latest print is above all readings from the recovery.
Construction is also in very good shape:
August data indicated another strong improvement in the overall performance of the UK construction sector, as highlighted by steep and accelerated expansions of both output and new business volumes. Construction companies also remain confident about the year-ahead outlook for business activity at their units, with around 46% of survey respondents expecting a rise and only 10% a reduction.
Adjusted for seasonal influences, the headline Markit/CIPS UK Construction Purchasing Managers’ Index® (PMI®) registered 59.1 in August up from 57.0 in July and above the neutral 50.0 value for the fourth consecutive month. The latest reading indicated a sharp rise in total business activity and the fastest pace of output expansion in the construction sector since September 2007.
Here's the accompanying data:
Again, this is the strongest print of the recovery.
And manufacturing is also printing at strong levels:
Latest data indicated that the UK manufacturing sector maintained its robust start to the third quarter of 2013. After the solid increases in output and new orders registered in July, August saw the momentum continue to build, with growth rates for both variables at their highest since 1994. However, cost inflationary pressures surged higher on the back of rising raw material prices.
The seasonally adjusted Markit/CIPS Purchasing Manager’s Index® (PMI®) hit a two-and-a-half year high of 57.2 in August, up from a revised reading of 54.8
in July (previously reported as 54.6). The PMI has signalled expansion for five successive months.
Here's a chart of the manufacturing data:
The manufacturing number is rising strongly.
While all the usual caveats apply, these numbers all point to higher growth in the next few quarters.
Let's take a look at the UK ETF:
The UK ETF is a buy right now. Not only are the economic fundamentals positive, the the ETF is in a bullish posture. Prices broke through the lower 19 level on a strong volume spike. This was accompanied by risking volume. All the EMAs are rising -- including the long-term trend (the 200 day EMA). In addition, the MACD and CMF show increasing upward momentum and rising volume inflow.
August’s survey of UK service providers signalled continued strong growth of activity and new business. Activity rose at the sharpest pace since December 2006, while growth in new work was the best seen since May 1997.
Capacity continued to be tested, with backlogs of work rising at the sharpest pace for over 13 years. However, employment broadly stagnated, in part due to an inability of service providers to replace leavers.
The headline seasonally adjusted Business Activity Index registered 60.5 in August. Improving on July’s 60.2, the latest reading was the highest in over six-and-a-half years. Over a quarter of the survey panel registered an increase in activity.
Here is the accompanying chart:
The latest print is above all readings from the recovery.
Construction is also in very good shape:
August data indicated another strong improvement in the overall performance of the UK construction sector, as highlighted by steep and accelerated expansions of both output and new business volumes. Construction companies also remain confident about the year-ahead outlook for business activity at their units, with around 46% of survey respondents expecting a rise and only 10% a reduction.
Adjusted for seasonal influences, the headline Markit/CIPS UK Construction Purchasing Managers’ Index® (PMI®) registered 59.1 in August up from 57.0 in July and above the neutral 50.0 value for the fourth consecutive month. The latest reading indicated a sharp rise in total business activity and the fastest pace of output expansion in the construction sector since September 2007.
Here's the accompanying data:
Again, this is the strongest print of the recovery.
And manufacturing is also printing at strong levels:
Latest data indicated that the UK manufacturing sector maintained its robust start to the third quarter of 2013. After the solid increases in output and new orders registered in July, August saw the momentum continue to build, with growth rates for both variables at their highest since 1994. However, cost inflationary pressures surged higher on the back of rising raw material prices.
The seasonally adjusted Markit/CIPS Purchasing Manager’s Index® (PMI®) hit a two-and-a-half year high of 57.2 in August, up from a revised reading of 54.8
in July (previously reported as 54.6). The PMI has signalled expansion for five successive months.
Here's a chart of the manufacturing data:
The manufacturing number is rising strongly.
While all the usual caveats apply, these numbers all point to higher growth in the next few quarters.
Let's take a look at the UK ETF:
The UK ETF is a buy right now. Not only are the economic fundamentals positive, the the ETF is in a bullish posture. Prices broke through the lower 19 level on a strong volume spike. This was accompanied by risking volume. All the EMAs are rising -- including the long-term trend (the 200 day EMA). In addition, the MACD and CMF show increasing upward momentum and rising volume inflow.
Median family income continued stagnation in 2012
- by New Deal democrat
Berkeley Professors Saez and Piketty have updated their work on family income in the US through 2012, making use of data from IRS returns. As covered by, for example, Prof. Mark Thoma, they found that the top 10% captured 95% of all of the increase in aggregate incomes since the recovery began. Here's the essential graph, showing the shares of total income over the last 100 years going to the 90th to 95th percentile (red), 95th to 99th percentile (blue), and the top 1 percent (black):
That lopsided accumulation of income flows naturally from the fact that, in addition to skyrocketing CEO compensation, the lion's share of capital gains accrue to those in the top income percentiles, and while wages of nonsupervisory workers have stagnated as many are still unemployed (red), the stock market has nearly doubled since the beginning of 2009 (blue):
This study also updates their data on "real median family income", which I reported on a month ago: The Truth about the decline in real median household income.
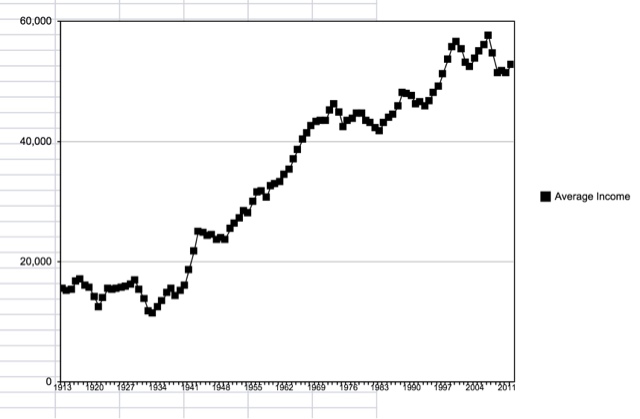
Saez and Piketty report on the inflation adjusted median income of the bottom 90% at column (7) in Tables A4, A5, and A6. They found income exactly unchanged at $30,997 in 2012 compared with 2011. Excluding capital gains, measured one way they found a very slight increase from $31,426 to $31,522. Measured another way they found a very slight decrease from $30,458 to $30,439. These are all roughly a 10% decrease from 2008. While they provided no graphic representations for this, they did provide one of average income, showing an increase but still below its recession peak:
As I indicated a month ago, it is important to note that these are not median wages or salaries. Rather, median incomes reflect the significant and persistent decrease in the employment to population ratio, partly due to the long term unemployed, and partly due to Boomer retirements.
That stimulus was primarily aimed at the financial sector of the economy, and less so at the average American family, leading to the natural result that the capital-owning class has recovered spectacularly, while the well-being of wage-earners has not materially increased, strikes me as the essence of the spectacular failure of policy that Prof. Krugman was railing against last week.
The Moderate Expansion Continues; ISM Adds Bullish Fuel
Last week the Federal Reserve Released the Beige Book, which shows (surprise) a continued moderate expansion.
Reports from the twelve Federal Reserve Districts suggest that national economic activity continued to expand at a modest to moderate pace during the reporting period of early July through late August. Eight Districts characterized growth as moderate; of the remaining four, Boston, Atlanta, and San Francisco reported modest growth, and Chicago indicated activity had improved. Consumer spending rose in most Districts, reflecting, in part, strong demand for automobiles and housing-related goods. Activity in the travel and tourism sector expanded in most areas. Demand for nonfinancial services, including professional and transportation services, increased slightly on net. Manufacturing activity expanded modestly. Residential real estate activity increased moderately in most Districts, and demand for nonresidential real estate gained overall. Lending activity was mixed. Lending standards were largely unchanged, while credit quality improved. Demand for agricultural products was strong during the reporting period, but growing conditions and production in some areas were somewhat weak as a consequence of extreme weather. Demand for natural resource products was stable or up slightly, and extraction increased in anticipation of further demand growth.
But two releases last week added bullish fuel to the economic argument in the guise of the ISM manufacturing and service numbers (we've already covered the ISM numbers in two posts see here and here).
The ISM manufacturing number was strong:
The PMI™ registered 55.7 percent, an increase of 0.3 percentage point from July's reading of 55.4 percent. August's PMI™ reading, the highest of the year, indicates expansion in the manufacturing sector for the third consecutive month. The New Orders Index increased in August by 4.9 percentage points to 63.2 percent, and the Production Index decreased by 2.6 percentage points to 62.4 percent. The Employment Index registered 53.3 percent, a decrease of 1.1 percentage points compared to July's reading of 54.4 percent. The Prices Index registered 54 percent, increasing 5 percentage points from July, indicating that overall raw materials prices increased when compared to last month. Comments from the panel range from slow to improving business conditions depending upon the industry."
Here's a chart of the number:
The two most recent readings show strong upward movement, rising higher than all levels seen before the 1Q11. 15 of the 18 industries reported growth. Last week, NDD noted the new orders index is very bullish for the next few months.
The anecdotal quotes are a bit less bullish, however:
Let's turn to the services number:
"The NMI™ registered 58.6 percent in August, 2.6 percentage points higher than the 56 percent registered in July. This indicates continued growth at a faster rate in the non-manufacturing sector. This month's NMI™ is the highest reading for the index since its inception in January 2008. The Non-Manufacturing Business Activity Index increased to 62.2 percent, which is 1.8 percentage points higher than the 60.4 percent reported in July, reflecting growth for the 49th consecutive month. The New Orders Index increased by 2.8 percentage points to 60.5 percent, and the Employment Index increased 3.8 percentage points to 57 percent, indicating growth in employment for the 13th consecutive month. The Prices Index decreased 6.7 percentage points to 53.4 percent, indicating prices increased at a significantly slower rate in August when compared to July. According to the NMI™, 16 non-manufacturing industries reported growth in August. The majority of respondents' comments continue to be mostly positive about business conditions and the direction of the overall economy."
The chart shows the recent strength of the number:
The anecdotal stories are more bullish than the manufacturing sector:
Reports from the twelve Federal Reserve Districts suggest that national economic activity continued to expand at a modest to moderate pace during the reporting period of early July through late August. Eight Districts characterized growth as moderate; of the remaining four, Boston, Atlanta, and San Francisco reported modest growth, and Chicago indicated activity had improved. Consumer spending rose in most Districts, reflecting, in part, strong demand for automobiles and housing-related goods. Activity in the travel and tourism sector expanded in most areas. Demand for nonfinancial services, including professional and transportation services, increased slightly on net. Manufacturing activity expanded modestly. Residential real estate activity increased moderately in most Districts, and demand for nonresidential real estate gained overall. Lending activity was mixed. Lending standards were largely unchanged, while credit quality improved. Demand for agricultural products was strong during the reporting period, but growing conditions and production in some areas were somewhat weak as a consequence of extreme weather. Demand for natural resource products was stable or up slightly, and extraction increased in anticipation of further demand growth.
But two releases last week added bullish fuel to the economic argument in the guise of the ISM manufacturing and service numbers (we've already covered the ISM numbers in two posts see here and here).
The ISM manufacturing number was strong:
The PMI™ registered 55.7 percent, an increase of 0.3 percentage point from July's reading of 55.4 percent. August's PMI™ reading, the highest of the year, indicates expansion in the manufacturing sector for the third consecutive month. The New Orders Index increased in August by 4.9 percentage points to 63.2 percent, and the Production Index decreased by 2.6 percentage points to 62.4 percent. The Employment Index registered 53.3 percent, a decrease of 1.1 percentage points compared to July's reading of 54.4 percent. The Prices Index registered 54 percent, increasing 5 percentage points from July, indicating that overall raw materials prices increased when compared to last month. Comments from the panel range from slow to improving business conditions depending upon the industry."
Here's a chart of the number:
The two most recent readings show strong upward movement, rising higher than all levels seen before the 1Q11. 15 of the 18 industries reported growth. Last week, NDD noted the new orders index is very bullish for the next few months.
The anecdotal quotes are a bit less bullish, however:
- "Slight improvements in both domestic and international sales." (Fabricated Metal Products)
- "Business is slowing down, not sure why — but we may end up below last year's sales levels, whereas we had forecast 6.5 percent growth." (Miscellaneous Manufacturing)
- "Material prices continue to be favorable; business is steady." (Paper Products)
- "Slowing down slightly, but still stronger than last year by 20 percent." (Furniture & Related Products)
- "Military slowdown affecting business." (Computer & Electronic Products)
- "Summer seasonal businesses are doing well after a late start." (Printing & Related Support Activities)
- "Still not seeing the year we had expected. Cautious about the balance of 2013." (Machinery)
- "Tight government spending still affecting business." (Transportation Equipment)
- "With improved weather outlook in the central states, agricultural prices are relaxing year over year." (Food, Beverage & Tobacco Products)
- "We have benefitted from the Yen; seeing a 20 percent decrease in material costs from 2012 to 2013." (Chemical Products)
Let's turn to the services number:
"The NMI™ registered 58.6 percent in August, 2.6 percentage points higher than the 56 percent registered in July. This indicates continued growth at a faster rate in the non-manufacturing sector. This month's NMI™ is the highest reading for the index since its inception in January 2008. The Non-Manufacturing Business Activity Index increased to 62.2 percent, which is 1.8 percentage points higher than the 60.4 percent reported in July, reflecting growth for the 49th consecutive month. The New Orders Index increased by 2.8 percentage points to 60.5 percent, and the Employment Index increased 3.8 percentage points to 57 percent, indicating growth in employment for the 13th consecutive month. The Prices Index decreased 6.7 percentage points to 53.4 percent, indicating prices increased at a significantly slower rate in August when compared to July. According to the NMI™, 16 non-manufacturing industries reported growth in August. The majority of respondents' comments continue to be mostly positive about business conditions and the direction of the overall economy."
The chart shows the recent strength of the number:
The anecdotal stories are more bullish than the manufacturing sector:
- "High demand for products is driving expansion." (Management of Companies & Support Services)
- "We continue to see growth in the retail and wholesale sectors of our business, and expect to see new orders for our products continue to grow as well." (Information)
- "We seem to have a flurry of activity in our pipeline." (Construction)
- "Business orders are up and improving. Still concerned about sustainability through Q4." (Professional, Scientific & Technical Services)
- "Experiencing a strong housing rebound and continued solid performance by the tourism sector." (Public Administration)
- "Conditions continue to show improvement." (Retail Trade)
- "Generally slow, increasing economy." (Transportation & Warehousing)
Tuesday, September 10, 2013
The Latin America Sell-Off Is Consolidating Losses
For reasons unknown, Latin America is not an important region for the US. This despite the fact that Mexico is one of our largest trading partners and the regions close geographic relationship to the US. However, over the last 13 years the Latin American countries have made great economic strides. Unfortunately, the region's indexes have sold off since the Fed's tapering announcement last spring. But the sell-off appears to be consolidating.
Let's start by looking an an ETF for the region.
The daily chart shows three important technical events. The first is the rally that lasted from May 2012 to May/June 2013. Prices broke support in the late Spring/early summer and dropped sharply, with a total loss of about 26%. However, prices have since been consolidating their losses between the 56/58 area and 63.
We can break the respective markets down into three categories, with the first being those that are sill consolidating losses.


The Chilean ETF (upper left), Peruvian ETF (upper right) and Brazilian ETF (center, above) have all dropped, although at different rates. But all three appear to have at least stopped their respective descents. The Chilean ETF's rate of decline decreased substantially, and it now appears to be using the upper 40s as support. The Peruvian ETF rallied to the 35 area in early August where it is now consolidating gains, the the Brazian ETF is clearly basing in the 42.5-45 area.
The region's sell-off is largely due to the Fed's tapering announcement, which led to a large outflow of funds. However, there is nothing wrong with the economic fundamentals at this time.
Let's start by looking an an ETF for the region.
The daily chart shows three important technical events. The first is the rally that lasted from May 2012 to May/June 2013. Prices broke support in the late Spring/early summer and dropped sharply, with a total loss of about 26%. However, prices have since been consolidating their losses between the 56/58 area and 63.
We can break the respective markets down into three categories, with the first being those that are sill consolidating losses.


The Chilean ETF (upper left), Peruvian ETF (upper right) and Brazilian ETF (center, above) have all dropped, although at different rates. But all three appear to have at least stopped their respective descents. The Chilean ETF's rate of decline decreased substantially, and it now appears to be using the upper 40s as support. The Peruvian ETF rallied to the 35 area in early August where it is now consolidating gains, the the Brazian ETF is clearly basing in the 42.5-45 area.
Both the Mexican ETF (left) and the Colombian ETF (right) attempted a rally in June/ July, only to see a sell-off. But the price drop that ended the rally did not take prices to previous lows.
And finally there is Argentina which is actually rallying.
All this despite an overall decent economic environment.
Overall growth, with the exception of Brazil, is still progressing at decent annual rates.
Inflation is a potential problem for all save Argentina. But while CPI is running hotter than the US, it appears to be at least contained for now.
The region's sell-off is largely due to the Fed's tapering announcement, which led to a large outflow of funds. However, there is nothing wrong with the economic fundamentals at this time.
Oil Becoming Potential Major Economic Threat
Oil is quickly becoming a potential major threat to the economy.
Oil hit resistance at the 98 level five times during the first half of 2013, finally breaking through in July. Prices consolidated gains between the 102/104 and 108 levels over the summer. During this time, the MACD declined which means there is now ample upside room for an increase in momentum. Prices broke through resistance over the last few weeks, with a big upward candle print on Friday. The MACD also printed a buy signal last week. Finally, notice the very bullish orientation of the EMAs: all three shorter EMAs (10, 20 and 50) are moving higher, with prices using them as support rather than resistance.
The weekly chart simply increases the upward bullish case. The EMA picture is very bullish. Momentum is increasing, and an increasing amount of money is flowing into the market. Also, there is very little recent upside resistance to slow the advance.
Finally, there is the political side. With the President putting off Syrian action until Congressional approval is given, he's made sure the Middle East will remain an object of tension for at least another weak. This adds political uncertainty to the fire, which is also bullish for Oil's price future.
It's rare when the multiple technical time frames line up with fundamental developments to create a bullish scenario. When they do, it's hard to not argue to go long.
Oil hit resistance at the 98 level five times during the first half of 2013, finally breaking through in July. Prices consolidated gains between the 102/104 and 108 levels over the summer. During this time, the MACD declined which means there is now ample upside room for an increase in momentum. Prices broke through resistance over the last few weeks, with a big upward candle print on Friday. The MACD also printed a buy signal last week. Finally, notice the very bullish orientation of the EMAs: all three shorter EMAs (10, 20 and 50) are moving higher, with prices using them as support rather than resistance.
The weekly chart simply increases the upward bullish case. The EMA picture is very bullish. Momentum is increasing, and an increasing amount of money is flowing into the market. Also, there is very little recent upside resistance to slow the advance.
Finally, there is the political side. With the President putting off Syrian action until Congressional approval is given, he's made sure the Middle East will remain an object of tension for at least another weak. This adds political uncertainty to the fire, which is also bullish for Oil's price future.
It's rare when the multiple technical time frames line up with fundamental developments to create a bullish scenario. When they do, it's hard to not argue to go long.
Monday, September 9, 2013
The gaping hole in the jobs recovery is manufacturing
- by New Deal democrat
There simply is no question that there has been a jobs recovery since the end of 2009. While it hasn't been fast enough, the 6 million plus people who have jobs now who didn't at that time would probably disagree strongly with those few who continue to insist on using scare quotes.
The rejoinder has been that jobs haven't grown nearly fast enough to close the gap with where they need to be taking into account population growth. In the aggregate, adjusted for population, job growth has been slow. But as we will see, the poor growth is concentrated in just a few areas, and in particular in manufacturing.
To make the point, every single graph I am running in this post describes one or more category of jobs, as a percent of the population.
Jobs are broadly divided into service and goods-producing sectors. Let's start with the service sector.
The first graph below shows the entirety of service sector jobs (blue) and all private sector service jobs (i.e., not including governement jobs (red)) for the last half century:
As you can see, the service sector grew almost relentlessly until about 1999, and broadly speaking, has held steady since.
This next graph focuses in on the last 15 years. To show the trend clearly, I've added 0.075% to the private-sector only line (red), which does not affect its slope at all:
This graph tells us two things:
- (1) private sector service jobs have almost completely recovered from their recession losses. As a share of the population, there are as many private sector service jobs as there were in the boom year of 1999 and from 2003 into 2005. In fact it is very questionable that we would want as many services jobs as we had as a percent of the workforce immediately before the 2008-09 severe recession. To have as many as we did in the peak year of the tech boom would only take about another 0.25% or so, or about 800,000. At the clip of 150,000 a month, if present trends continue we'll hit that sometime between the end of this year and next spring.
- (2) It would take about another 0.5% of the population getting federal, state, and local jobs to bring those back up to where they were, on average, in the 10 years between the tech boom and the onset of the great recession. That's about 1,500,000 jobs. In other words, not only do we have to rehire all the police and fire personnel and teachers who have been let go, but to keep even with population growth we need to hire more.
Now let's turn to the goods-producing sector of the economy.
The first graph shows all goods-producing jobs (blue), and just manufacturing plus construction jobs (red). The primary difference, which isn't much, is employment in resource extraction such as mining:
Note that goods producing jobs held fairly steady through the 1970's, but have been decreasing, and decreasing at an accelerating rate, since that time.
But the decline is not proportionate between manufacturing and construction. This is clearly shown when we isolate construction:
Before the late 1980's, construction had rarely exceeded 2% of the entire workforce. And only with the housing boom and bubble that began in the late 1990's did it exceed 2.2%. It is questionable to say the least that we would want to recreate all of the construction jobs that existed at the height of the bubble. Less than 0.4% of additional construction jobs would put us above the level of the late 1980's housing boom. And 0.5% puts us where we were in 2003. This is somewhere between 1.2 million and 1.6 million jobs.
Finally, let's contrast constuction jobs (blue) with manufacturing jobs (red) since the tech boom:
As we saw before, construction jobs have declined only 0.4% since then. But manufacturing jobs have declined 1% since October 2004 (the closest they ever came to being YoY positive during that expansion), and a full 2.5% since 1998. The stark contrast is better shown when I add 0.0425% to the construction sum, so that both rates are equal in 1998 (note, it does not affect the slope of the difference at all):
Measuring since 1999, we have lost a whopping 7,500,000 manufacturing jobs as a share of the population! Even measuring since their last downward inflection point we are down 3,500,000 manufacturing jobs.
Here's one final graph, comparing total payrolls as a percentage of the population (blue), and all payrolls exclusive of manufacturing (red), plus 0.6% for direct comparisons with 1999:
In short, even measuring conservatively, the manufacturing jobs lost since their last downward inflection point before the last recession account for half of the entire remaining shortfall in jobs during the recovery (3.5 million of 6.8 million). If we measure from the time of the last legitimate jobs boom, they account for two-thirds of all losses (7.5 million of 11.3 million).
Market/Economic Analysis: US
Let's start by looking at last week's major US economic releases
The Good
Construction spending increased .6%. While this was an overall good number it's important to remember that overall this number has been weak for the last four years, especially in the public area as shown on the charts kept by CR.
The ISM manufacturing number printed at 55.7 with strong internal increases.
The ISM non-manufacturing number printed at 58.6%.
While I'll be discussing both the ISM numbers later this week, consider these charts from the releases.
Overall manufacturing production spiked two months ago to levels not seen since right after the end of the recession.
The ISM services employment index is rising to higher levels which may bode well for service employment figures over the next few months.
The trade gap came in at 39 billion. On that topic, consider this chart from Calculated Risk:
Notice how both imports and exports started to stall at the beginning of 2012. The import stall is the sign of decreased domestic demand for goods while the export stall is a sign of the slowing world economy.
The US created 168,000 jobs last month. NDD noted this is a second report with a net decrease in the previous month's revisions, which is a yellow flag going forward.
The Neutral
None, although it could be argued the employment report's downward revisions to previous months would count as a neutral development.
The Bad
Non
Conclusion: last week's news was a mixed bag. While the ISM numbers indicated both areas of the economy (service and manufacturing) were doing well, the downward revision to June and July's establishment jobs numbers were a yellow flag that is a bit concerning right now. Add that to the other potential weaker numbers (the recent weak durable goods print, the downward revision in new home sales, oil's price spike, weak government contribution to GDP) and you have yet another week where economic numbers are raising some potential concern.
That being said, let's turn to the markets.
The 60 minute chart for the SPYs is a bit messy, so let's explain the three major technical developments.
The daily chart puts the latest movement in better perspective, showing the sell-off and relief rally. The underlying technicals show a weakening picture: the MACD's trend is one of decline, the shorter EMAs are moving lower and the CMF is negative. This tells us that a rally is most likely a relief rally to a sell-off with another sell-off potentially down the line.
The treasury market continues its sell-off. The belly of the curve (IEFs, top chart) have broken two key levels of support: 104 and 100. The EMA picture is negative (all moving lower with the shorter below the longer), momentum is negative as is the CMF. The long end of the curve (TLTs, bottom chart) has been declining at a sharper rate since the beginning of May. Also note the bearish position of the EMAs and negative momentum.
Conclusion: the market are still in a transition. The treasury sell-off -- which has occurred in reaction to the Fed's tapering announcement -- indicates the markets are potentially also anticipating higher inflation (caused by higher growth). It could also be a sell-off which is trying to find a bottom after the announcement of the withdrawal of market support from the Fed. Equities are at minimum consolidating recent gains. They're waiting for some signal to move higher. But as NDD has noted, corporate earnings are weakening which is not supportive of further advances.
The Good
Construction spending increased .6%. While this was an overall good number it's important to remember that overall this number has been weak for the last four years, especially in the public area as shown on the charts kept by CR.
The ISM manufacturing number printed at 55.7 with strong internal increases.
The ISM non-manufacturing number printed at 58.6%.
While I'll be discussing both the ISM numbers later this week, consider these charts from the releases.
Overall manufacturing production spiked two months ago to levels not seen since right after the end of the recession.
The ISM services employment index is rising to higher levels which may bode well for service employment figures over the next few months.
The trade gap came in at 39 billion. On that topic, consider this chart from Calculated Risk:
Notice how both imports and exports started to stall at the beginning of 2012. The import stall is the sign of decreased domestic demand for goods while the export stall is a sign of the slowing world economy.
The US created 168,000 jobs last month. NDD noted this is a second report with a net decrease in the previous month's revisions, which is a yellow flag going forward.
The Neutral
None, although it could be argued the employment report's downward revisions to previous months would count as a neutral development.
The Bad
Non
Conclusion: last week's news was a mixed bag. While the ISM numbers indicated both areas of the economy (service and manufacturing) were doing well, the downward revision to June and July's establishment jobs numbers were a yellow flag that is a bit concerning right now. Add that to the other potential weaker numbers (the recent weak durable goods print, the downward revision in new home sales, oil's price spike, weak government contribution to GDP) and you have yet another week where economic numbers are raising some potential concern.
That being said, let's turn to the markets.
The 60 minute chart for the SPYs is a bit messy, so let's explain the three major technical developments.
- The blue Fibonacci lines are for the rally from the week of June 24 to the week of August 5
- The yellow Fibonacci lines (which also overlap some of the blue Fib lines) are for the sell off from the week of August 5 to August 26).
- The red boxes show price consolidation that occurred the week of August 12-19 and August 26.
The daily chart puts the latest movement in better perspective, showing the sell-off and relief rally. The underlying technicals show a weakening picture: the MACD's trend is one of decline, the shorter EMAs are moving lower and the CMF is negative. This tells us that a rally is most likely a relief rally to a sell-off with another sell-off potentially down the line.
The treasury market continues its sell-off. The belly of the curve (IEFs, top chart) have broken two key levels of support: 104 and 100. The EMA picture is negative (all moving lower with the shorter below the longer), momentum is negative as is the CMF. The long end of the curve (TLTs, bottom chart) has been declining at a sharper rate since the beginning of May. Also note the bearish position of the EMAs and negative momentum.
Conclusion: the market are still in a transition. The treasury sell-off -- which has occurred in reaction to the Fed's tapering announcement -- indicates the markets are potentially also anticipating higher inflation (caused by higher growth). It could also be a sell-off which is trying to find a bottom after the announcement of the withdrawal of market support from the Fed. Equities are at minimum consolidating recent gains. They're waiting for some signal to move higher. But as NDD has noted, corporate earnings are weakening which is not supportive of further advances.
Subscribe to:
Posts (Atom)