Wednesday, July 13, 2011

Fed Minutes Show A Slowing Economy

The latest Fed minutes show an economy that is slowing on a variety of fronts:

The expansion of private nonfarm payroll employment in May was markedly below the average pace of job gains in the previous months of this year. Initial claims for unemployment insurance rose, on net, between the first half of April and the first half of June. The unemployment rate moved up in April and then rose further to 9.1 percent in May, while the labor force participation rate remained unchanged. Both long-duration unemployment and the share of workers employed part time for economic reasons continued to be elevated.

Total industrial production expanded only a bit during April and May after rising at a solid pace in the first quarter. Shortages of specialized components imported from Japan contributed to a decline in the output of motor vehicles and parts. Manufacturing production outside of the motor vehicles sector increased moderately, on balance, during the past two months. The manufacturing capacity utilization rate remained close to its first-quarter level, but it was still well below its longer-run average. Forward-looking indicators of industrial activity, such as the new orders diffusion indexes in the national and regional manufacturing surveys, weakened noticeably during the intermeeting period to levels consistent with only tepid gains in factory output in coming months. However, motor vehicle assemblies were scheduled to rise notably in the third quarter from their levels in recent months, as bottlenecks in parts supplies were anticipated to ease.

Growth in consumer spending declined in recent months from the already modest pace in the first quarter. Total real personal consumption expenditures only edged up in April. Nominal retail sales, excluding purchases at motor vehicles and parts outlets, increased somewhat in May, but sales of new light motor vehicles declined markedly. Labor income rose moderately, as aggregate hours worked trended up, but total real disposable income remained flat in March and April, as increases in consumer prices offset gains in nominal income. In addition, consumer sentiment stayed relatively low through early June.

Activity in the housing market remained depressed, as both weak demand and the sizable inventory of foreclosed or distressed properties continued to hold back new construction. Starts and permits of new single-family homes were essentially unchanged in April and May, and they stayed near the very low levels seen since the middle of last year. Sales of new and existing homes remained at subdued levels in recent months, while measures of home prices fell further.

The available indicators suggested that real business investment in equipment and software was rising a bit more slowly in the second quarter than the solid pace seen in the first quarter. Nominal orders and shipments of nondefense capital goods declined in April. Business purchases of light motor vehicles edged up in April but dropped in May, while spending for medium and heavy trucks continued to increase in recent months. Survey measures of business conditions and sentiment weakened during the intermeeting period. Business expenditures for office and commercial buildings remained depressed by elevated vacancy rates, low prices for commercial real estate, and tight credit conditions for construction loans. In contrast, outlays for drilling and mining structures continued to be lifted by high energy prices.

Real nonfarm inventory investment rose moderately in the first quarter, but data for April suggested that the pace of inventory accumulation had slowed. Book-value inventory-to-sales ratios in April were similar to their pre-recession norms, and survey data also suggested that inventory positions generally remained in a comfortable range.

The available data on government spending indicated that real federal purchases increased in recent months, led by a rebound in outlays for defense in April and May from unusually low levels in the first quarter. In contrast, real expenditures by state and local governments appeared to have declined further, as outlays for construction projects fell in March and April, and state and local employment continued to contract in April and May.

The U.S. international trade deficit widened slightly in March and then narrowed in April to a level below its average in the first quarter. Exports rose strongly in both months, with increases widespread across major categories in March, while the gains in April were concentrated in industrial supplies and capital goods. Imports grew robustly in March, but they fell slightly in April, as the drop in automotive imports from Japan together with the decline in imports of petroleum products more than offset increases in other imported products.

Headline consumer price inflation, which had risen in the first quarter, edged down a bit in April and May, as the prices of consumer food and energy decelerated from the pace seen in previous months. More recently, survey data through the middle of June pointed to declines in retail gasoline prices, and prices of food commodities appeared to have decreased somewhat. Excluding food and energy, core consumer price inflation picked up in April and May, pushing the 12-month change in the core consumer price index through May above its level of a year earlier. Upward pressures on core consumer prices appeared to reflect the elevated prices of commodities and other imports, along with notable increases in motor vehicle prices likely arising from the effects of recent supply chain disruptions and the resulting extremely low level of automobile inventories. However, near-term inflation expectations from the Thomson Reuters/University of Michigan Surveys of Consumers moved down a little in May and early June from the high level seen in April, and longer-term inflation expectations remained within the range that has generally prevailed over the preceding few years.

Available measures of labor compensation showed that labor cost pressures were still subdued, as wage increases continued to be restrained by the large amount of slack in the labor market. In the first quarter, unit labor costs only edged up, as the modest rise in hourly compensation in the nonfarm business sector was mostly offset by further gains in productivity. More recently, average hourly earnings for all employees rose in April and May, but the average rate of increase over the preceding 12 months remained quite low.

Global economic activity appeared to have increased more slowly in the second quarter than in the first quarter. The rate of growth in the emerging market economies stepped down from its rapid pace in the first quarter, although it remained generally solid. The Japanese economy contracted sharply following the earthquake in March, and the associated supply chain disruptions weighed on the economies of many of Japan's trading partners. The pace of economic growth in the euro area remained uneven, with Germany and France posting moderate gains in economic activity, while the peripheral European economies continued to struggle. Recent declines in the prices of oil and other commodities contributed to some easing of inflationary pressures abroad.

The following sectors are slowing: job growth, personal consumption expenditures, industrial production, business spending and international markets.

Housing has yet to recover in any meaningful way.

In short -- there is little to cheer about right now.

A Closer Look at Employment, Pt. III (Or, The Drop in Government Jobs is a Big Problem)

Given the miserable jobs report from Friday, let's delve into the data to see what exactly is happening with employment.


The chart above shows a close up of total non-farm job growth. Eyeballing this chart, we see growth, but growth that is hardly linear. Notice that at the beginning of 2010 we see strong job growth (remember this is around the peak census hiring time), which then dropped until near the end of 2010. Since the beginning of the year, we've had decent job growth which has leveled out the last three months.

Consider the following chart of government employees:


Notice the continued drop in government employees, which has acted as a drag on overall job growth for the last few years.

Dealing with the government jobs number is a bit tricky, because we have to account for two spikes with the first being census workers. So, I'm going to do a simple, back of the envelope calculation which should get us in the ballpark. In February, 2010 there were 24,474,000 government employees, which increased to 22,980,000 in May, for an increase of 506,000. For the sake of argument (and simplicity) I'm going to assume this increase was composed entirely of temporary census employees. In addition, there was a spike in government employees to 22,681,000 in April 2009 that quickly moved lower, indicating the spike was temporary. I'm going to take these bumps out of the equation as well.

All that being said, the maximum number of government employees in the last 7 years occured in January 2009 where there were 22,582,000 employees. Currently, there are 22,064,000 for a decrease of 518,000. In other words, as the the number of non-farm payroll jobs has been increasing for the last 6-7 quarters, the drop in government employment has been a net overall drag on the employment figures and probably provides a partial explanation for initial unemployment claims remaining over 400,000 this far into the recovery.

Tuesday, July 12, 2011

Wednesday Commodity Round-Up

In uncertain times, gold benefits -- which is exactly what has happened the last week.


The five minute charts shows prices moving up strongly, gapping higher at the open several times and maintaining upward momentum throughout the last week.


Prices have advanced through key resistance areas and are now ready to move too record highs.


We've had a short term bullish crossover as the 10 day EMA has moved over the 20. The A/D line shows new money has been flowing into the market, although the CMF shows the move has been a bit weak. Momentum declined as prices consolidated, but the MACD has now given a buy signal.


Prices have spent the last few months consolidating in a sideways pattern. Now they stand to move higher.

Two events move gold higher: inflation and uncertainty. Inflationary pressures are diminishing as commodities move lower in price. That leaves uncertainty as the primary driver of the gold trade.

Repatriation Tax Holiday Could Fund Infrastructure Bank

From the WSJ:

Using a repatriation tax holiday — a tax break for companies bringing back overseas profits to the U.S. — to help fund an ‘infrastructure bank,’ would be a good idea, GE Chief Executive Jeffrey Immelt said at the U.S. Chamber of Commerce on Monday. Lawmakers have proposed starting a national infrastructure bank to provide low-interest loans and loan guarantees to build highways, energy projects and water infrastructure.

“We favor repatriation of our foreign cash back into the U.S., where it can do some good,” Immelt said. “I believe Senator Schumer has a good idea: taxes from repatriation could go toward creating the infrastructure bank that in turn creates jobs.”

Sen. Charles Schumer (D., N.Y.) has said that his party would be willing to consider a tax repatriation holiday, provided the companies that benefit from the lower tax rate use the funds to help create jobs.

Under a repatriation tax holiday, U.S. companies would be enticed to bring foreign profits back to the U.S. by taxing them at a roughly 5% tax rate, rather than the current top corporate rate of 35%.

mmelt told reporters after his speech that he wasn’t sure how much support there was for a repatriation tax holiday. Academic analysis of a previous repatriation tax holiday in 2004 showed that companies then used the profits more for share buybacks and dividends than for creating new jobs. But Immelt said the current economic backdrop made the situation different now.

The last time this was tried was in the last expansion which had some of the weakest job growth on record, so we know the "this will create jobs"argument doesn't work. However, using the money to fund infrastructure makes perfect sense and should be done ASAP.

The Dollar and Euro Have Broken Out of Consolidation


Technically, the next stop is the 200 day EMA. But that assumes the US won't default on its debt, the deadline of which is just a few weeks away.


At the same time the dollar has broken out of its consolidation at low levels, the euro is falling from consolidation at high levels, as traders fell the EU region because of he debt crisis issue.

A Closer Look At Employment, Pt II; Educational Achievement and Unemployment


The above chart to me is still the most important chart of the unemployment series. It tells us that the higher the educational achievement, the lower the unemployment rate. In addition, it also tells us that in the current US economy, the specialization that comes with higher education is valued and important and frankly, a requirement.

Consider this in contrast with yesterday's post on goods producing jobs -- which are typically associated with lower educational attainment. In this recession, the less educated have taken a tremendous hit.

Monday, July 11, 2011

Treasury Tuesdays

Last week, I wrote the following about the Treasury market:
Given the low trading volume and the price action around the 200 day EMA, I'm thinking the TLTs will pause here or rebound into the EMAs. However, I think the IEFs are targeting the 200 day EMA. Given the Fed's departure, I believe the Treasury market is moving lower for the time being.

What I didn't count on was EU problems leading to purchases of US Treasury bonds as a safe have play.

Let's take a look at the charts:


The 10 day, 5 minute chart shows the strong advance in reaction to the EU situation over the last few days. On Friday, the market was concerned about the EU changing the conditions of the Greek plan in a manner that would indicate default, while yesterday, the market was concerned about Italy. As a result of both, the US Treasury market caught a safe haven bid despite the ongoing debt negotiation situation.


The IEF prices have moved through key Fib levels. Also note the 10 and 20 day EMA have both turned higher and the 10 day EMA is about to move through the 20. However, the volume is less than convincing and the bars are incredibly weak.

Overall, the last two days' price action is more a fundamental reaction to the EU situation, which is interesting, as this has occurred at exactly the same time as the Fed backing away from the market lowering demand. And then there is the possible impact of the debt negotiation deal. It's my opinion this is a temporary bounce, caused by the EU situation.

A Closer Look At Employment Part I; How Did We Get Here and Where Are We?

In light of Friday's breathtakingly bad employment report, this week I'm going to take an in-depth look at the employment situation. So let's start with an explanation of how we got here.


The above chart shows total non-farm jobs for the US economy. The series hit its peak in January 2008 when there were 137,998,000 jobs. The trough was in February 2010 when there were 129,246 jobs, for a total loss of 8.7 million jobs. Currently there are 131,017,000 jobs for a total loss of 6.9 million. In other words, the economy has been creating jobs (about 1.8 million since the trough), but at a frustratingly slow pace.


The above chart shows the same series, but goes back to 2001. The point of the above chart is to illustrate that the job losses during the great recession completely wiped out all job gains of the last 10 years. In other words, this was akin to a natural disaster that wipes out an entire city, meaning rebuilding takes a tremendous amount of time and effort.

Now, let's look various sub-parts of the data.


The above chart shows total goods producing jobs. In January of 2007, there were, 22,432,000 goods production jobs while in the latest jobs report there were 18,006,000 for a total job loss of 4.426 million. In other words, a little less than half of the total jobs lost were in goods producing industries. Also note that while the bleeding has stopped in this area of employment, the pace of job growth has been very small. Let's examine why the pace of goods producing jobs growth has been slow.


For the last 10 years, we've seen large drops in US manufacturing employment. Part of the reason is the increased use of automation -- which is a natural by-product of technological development. As for offshoring, most offshoring is not bad. Remember that other markets have been developing for the last 20+ years and are now to the point (and have been for at least 10 years) where locating facilities in those countries makes practical sense. For example -- Brazil, India, China and Russia are all emerging economies with growing manufacturing and consumer markets. Locating manufacturing facilities in these countries (at the expense of US production) cuts down on transportation costs and creates new profit centers and local goodwill for parent companies. In short, loss of US manufacturing jobs represents as much an overall realignment of global manufacturing, consumption and economic patterns as it does an "evil plot by those nasty capitalists." Most importantly, this also means the manufacturing jobs lost will not be coming back.

As for construction, the housing boom created a massive oversupply of houses which was great for construction employment during the last expansion, but terrible for this expansion. The height of construction employment occurred in April 2006 when there were 7,726,000 construction jobs. That total is now 5,513,000 which means there have been a total of 2,213,000 construction jobs lost. Given the dismal state of US housing, construction employment will continue to be to in poor shape for some time. Because of the housing bust, these construction jobs will not coming back either.

As for service sector jobs lost (about 4 million), let's assume that 20% were real estate related. This really isn't so hard to imagine when you consider real estate agents, mortgage brokers, building inspectors, financial jobs etc.. related to the industry. That means an additional 800,000 jobs were real estate based -- which means they're not coming back anytime soon either.

So, goods producing industry losses (about 4.417 million jobs) have the extreme misfortune of being the victim of the housing bust -- which means there will not be a quick rebound from the massive losses in construction employment -- while a fundamental change in technology (increased automation) and a fundamental realignment of global consumption and economic centers of influence has led to a drop in manufacturing employment -- which means most of the job losses in that area won't come back either. As for service sector employment, a back of the envelope calculation about the effects of the housing bubble and bust indicates that about 800,000 jobs were lost from over reliance on a single sector of the economy for growth.

In other words, the slow pace of job creation in the current environment is as much the result of macro-economic issues -- such as the long-term effects of the bursting housing bubble and the lower importance of the US market relative to international markets -- as anything else.

Yes, these Hard Times will end

- by New Deal democrat

After a brutal week like last week, and a brutal report like Friday's June jobs report, it helps to step back and take a few deep breaths.

Yes the report was awful, and in almost every respect. Even the leading parts of the report, especially manufacturing hours, declined. Substantially.

Further, it's hard not to be discouraged by the nonsense coming out of Washington. In the face of the worst continuing economic conditions in over 70 years, austerity reigns triumphant. Austerity will not work. It will make matters worse. That Social Security and Medicare are being served up allegedly as part of a "Grand Bargain" but really just for the first course, is even more discouraging.

All of this is bad. But at the same time, please remember that we had Panics and Depressions all through the 19th and early 20th centuries, some worse than others, and all of them eventually resolved even though there was no New Deal or stimulus program to assuage the most needy.

Let's start by remembering that what got us into this mess was too much debt, and specifically a housing bubble that burst, eventually dragging down everything including a highly leveraged financial sector with it. But eventually these factors - the housing bust and the household debt issues - are going to be worked out, and turn into positives. A time horizon of the next two or three years is not unreasonable.

The first factor is the housing market. Here's a graph of housing permits and starts for the last 10 years:


The bad news is that the housing market has been flat on its back for the last 2 1/2 years. That housing hasn't participated is a very big reason why the recovery from the trough of the "great recession" hasn't been enough to translate into real improvement in people's lives. As Prof. Edward Leamer has compellingly shown, typically housing leads both in recessions and in recoveries, creating jobs not only for construction workers, but also having huge multiplier effects over a year or two, as new homeowners buy furnishings, appliances, landscaping, and other improvements both interior and exterior.

The good news is that it's hard to generate a significant economic contraction without housing participating in that, either. In other words, if there's been no upturn, there also hasn't been any significant downturn in housing sales in the last 2 1/2 years. So, we might face stagnation, or in the worst case, a relatively shallow double-dip. That would make a bad situation even worse, but on the other hand, not Armageddon.

And as I pointed out last year, the Millennials or Echo Boomers are arriving at home-buying age. Demand is beginning to get pent-up for these first time home-buyers. Meanwhile prices and mortgage rates have continued to decline, so that housing affordability (meaning how big of a monthly payment is necessary to own a house via a mortgage) is at multi-decade lows. So once housing does begin to improve, the expansion it creates may very well resemble an economic opening of the floodgates.

The second factor is the accumulation of personal savings. Here is a graph of inflation-adjusted, "real" personal savings for the last 50 years:


As you can see, for the last 2+ years, more savings have been accumulated than at any point in the last 25 years. There are $100s of Billions of dollars more than before the recession that can be spent, once the confidence and opportunity arrive to do so. Inevitably this is skewed towards top earners, but this has always been the case, even if moreso now than at any point in over half a century.

The third factor is the deleveraging of households. Here is the latest graph of the percentage of disposable income needed to service household debt:


This data is already over 3 months old. If deleveraging continues for the next 8 months like it has since the middle of 2008, households will probably be in their best position to service debt in the last 30 years.

Unless there is some major new event, within about two or three years we are going to have households much more able to pick up spending, and a housing market ready to take on some of that pent-up demand. It's also worth noting that with new discoveries coming online, and more energy-efficient vehicles being sold over the next 3 years, Oil's choke collar is also likely to loosen.

On the other hand, I do have one big concern, and that is the issue of wage deflation. We just had our second (tiny) outright monthly decline in hourly earnings in the last seven months. We have had this before, most particularly in the mid-1980's, so it isn't necessarily fatal. Indeed, as the below bar graph of the last 30 years shows, hourly earnings tend to hit their cycle lows several years into a recovery, so the present is consistent with those past expansions:


But here is a graph showing the quarterly trend in hourly earnings in the last 10 years:


We need to see renewed strength in wages soon. If the current trend continues, then within about 2 years or so we are going to tip over into outright wage deflation. We very much need to see the three positive factors I've outlined above kick in before a debt-deflation is triggered. As I wrote last January, we are in a race between deleveraging and deflation. I do consider it likely that deleveraging will win.

Once housing begins to improve again, household deleveraging has been accomplished, and Oil's choke collar loosens on a more sustainable basis, these Hard Times will end. How much of an improvement we will see at that point will depend on how much actual wages grow.

Economic Week in Review

Let's take a look at the various economic reports that came out last week, organizing them into the categories used in the Beige Book survey.
Link
Consumer: the big news here was the employment report, which was terrible (my friends at the Liscio Report called in "unspinningly bad). A gain of 18,000 jobs that will probably be lowered in the coming months to a gain of 0 or slight loss. There was nothing good in this report: wages dropped, the unemployment rate increased and we had a deeply concerning spike in the number of short-term unemployed. At a time when the consumer is already slowing his spending, this is the worst possible report, plain and simple. Interestingly enough, consumer credit increased last month, propelled higher by a 5.1% increase in revolving credit (credit card debt).

Manufacturing: factory orders increased .8% in May, which is a rebound from the drop of .9% in April. While the news stories touted the increase as a sign that fallout from Japan was lessening, I'd wait a few months before we make that call. We've seen a drop across a variety of countries in manufacturing, leading me to have concerns about the overall economic direction.

Services: The ISM services index printed at 53,3, which is down from 54.6 the previous month. Both the production and new orders components dropped, indicating the overall pace is slowing. Although 15 industry areas were increasing, the anecdotal quips were mixed. Overall, this area of the economy is still growing, but there is some erosion around the edges.

The employment report was a terrible report, and dominated the news. It indicates the recovery is in serious danger.

Equity Week in Review and Preview of the Upcoming Week/Month

Last week, I wrote the following about the stock market:
At this point, we should acknowledge that the stock market is a leading indicator. The question now becomes, was this week's advance a sign that equity traders think the worst is over, and therefore it's time to get into the action? The weakness in the Treasury market last week would bear this out, as would the rise in the oil market and copper's recent advance through key resistance areas. However, I'm personally not sold on a third or fourth quarter rebound yet. Consumer spending is weakening, global manufacturing is softening, emerging economies are increasing interest rates (US exports have been strong during the recovery) and Washington is full of idiots doing everything they can to screw up the economy. I would need to see an advance through previous highs on multiple indexes (with the Russell 2000 being one) before I'm sold on the veracity of this rally.
In short, the issue for the market was, "is this a technical bounce for an oversold market, or is it the beginning of new advance in the market?" Last week added evidence that the former is the case. First, consider this chart of the 10 day, 5 minute chart:


In the preceding week, prices advanced strongly whereas last week, prices moved sideways.


Prices have clearly advanced beyond key resistance levels and the shorter EMAs have advanced through the longer EMAs -- all of which are also rising. However, last week's candles were weaker and appeared to be stalling in their upward advance.


All of the technical indicators are showing a rally -- the A/D and CMF indicate money is flowing into the market at an increased pace, and the MACD shows increased momentum. However, consider the following two additional charts:


Neither the QQQs nor the IYTs -- which were both at important technical levels -- advanced beyond those levels.

Part of last week's action could simply be a consolidation of gains after a strong advance. This is standard market behavior. However, Friday's employment report should put the kabash on any strong upside rally in anticipation of economic acceleration in the third and fourth quarter. The pace of job growth is slowing, not advancing, and indicates there are problems underneath the economic surface. Any advance beyond resistance levels should be viewed suspiciously at this point until the fundamental picture improves.

Saturday, July 9, 2011

Weekly Indicators: Stall vs. double-dip edition

- by New Deal democrat

The monthly data reported this week included both factory orders and ISM services positive, but slightly weaker than expected.

Of course, the 800 pound gorilla in the room was the awful June payrolls report that matched an equally awful downwardly revised May report, that I told you to expect. Manufacturing hours, one of the 10 LEI, declined .3. It is at least possible that the LEI could be negative for the second time in 3 months, depending on housing permits. Perhaps even worse, for the second time in 7 months, there was actual wage deflation, albeit tiny. I don't suppose I need to pull out the history books to tell you that wage deflation in the presence of huge debt is lethal.

Back in January I foresaw this midyear stall, due to Oil and contractionary fiscal policy. The weekly indicators started to show the deterioration as early as March. Because of this, I haven't been caught up in any mood swing from complacency to dread, so I see no need to change my opinion going in to the end of the year now. For that, let's make the first high frequency weekly indicator this week, money supply:

M1 was up 0.5% w/w, up 0.5% m/m (comparing the entire month), and up 12.8% YoY, so Real M1 was up 9.4%.
M2 was up 8.4% w/w, up 0.8% m/m (comparing the entire month), and up 5.5% YoY, so Real M2 was up 2.1%.
Real M1 remains very bullish, while Real M2 remains stuck in the caution zone under 2.5%. At the same time, it is worth noting that Real M2 is not deteriorating.

Going back over 90 years, beginning with the 1920-21 recession and including the Great Depression, there has NEVER been a recession in the face of both a positive yield curve and positive real M1. Never. In fact, if we don't believe we are tipping into actual deflation, then the positive yield curve alone has a perfect record.

So let's turn to the other high-frequency weekly indicators. Do they show a stall, or actual contraction:

The BLS reported that Initial jobless claims last week were 418,000. The four week average decreased slightly to 424,750. We appear to have stabilized in a range between 410,000 - 430,000.

The American Association of Railroads reported that total carloads were up 7000 to 523,000 YoY, or a mere 1.3% YoY for the week ending July 2. Intermodal traffic (a proxy for imports and exports) was up 6000 carloads, or 2.5% YoY. The remaining baseline plus cyclical traffic was up less than 1000 carloads, or 0.3%. This series is very close to turning negative on a carload basis. (Note: The AAR has terminated Railfax's license. Railfax broke out cyclical vs. baseline traffic - and had great 13 week and 104 week graphs - whereas the weekly AAR report does not. I will try to recreate and continue to report on that breakout).

The Mortgage Bankers' Association reported that seasonally adjusted mortgage applications increased 4.8% last week. It was 11.7% higher than this week last year. This is the sixth week in a row that YoY comparisons in purchase mortgages were positive. Except for the rush at the two deadlines for the $8000 mortgage credit, these are the first YoY increases since 2007. Refinancing decreased 9.2% w/w.

The American Staffing Association Index rose 1 point to 88. This trend of this series is still rising, but since the beginning of this year is just barely better than a stall.

The ICSC reported that same store sales for the week of July 2 increased 3.5% YoY, and increased 1.5% week over week. This is the best YoY comparison in over a month. Shoppertrak reported a 1.6% YoY increase for the week ending July 2 and a WoW increase of 3.5%. YoY weekly retail sales numbers had been slowly weakening for a month or so, but this week is the second week of a rebound.

Weekly BAA commercial bond rates spiked .16% to 5.88%. Yields on 10 year treasury bonds spiked a nearly identical .15% to 3.11%. This was probably due to the ending of QE2. This does not show any relative increase in distress in the corporate market.

Adjusting +1.07% due to the 2011 tax compromise, the Daily Treasury Statement showed that for the first 4 days of July 2011, $39.1 B was collected vs. $33.0 B a year ago. For the last 20 days, $133.5 B was collected vs. $128.4 B a year ago, for an increase of $5.1 B, or 4.0%. Use this series with extra caution because the adjustment for the withholding tax compromise is only a best guess, and may be significantly incorrect.

YoY weekly median asking house prices from 54 metropolitan areas at Housing Tracker showed that the asking prices declined -4.5% YoY. The areas with double-digit YoY% declines increased by one to 8. The areas with YoY% increases in price remained at 7. This remains consistent with the hypothesis that in nominal if not real terms housing prices may bottom as early as this winter.

None of the above series are showing outright contraction. Only one weekly indicator - and it is a significant one - is sounding a true alarm bell:

Oil finished over $95 a barrel on Thursday, back slightly above the level of 4% of GDP which according to Oil analyst Steve Kopits is the point at which a recession has been triggered in the past. Gas at the pump rose $.01 to $3.58 a gallon. Gasoline usage at 9309 M gallons was -1.5% lower than last year's 9449. This is the second week in a row that gasoline usage has been significantly less than last year. This is especially disconcerting with the price of gas being near its 4 month lows.

As of now, both the LEI and the weekly indicators show only a slowdown or stall. It will probably take true idiocy from Washington to push us into a significant contraction. Which means, unfortunately, it remains a significant possibility.

A Closer Look At Employment, Pt II; Educational Achievement and Unemployment


The above chart to me is still the most important chart of the unemployment series. It tells us that the higher the educational achievement, the lower the unemployment rate. In addition, it also tells us that in the current US economy, the specialization that comes with higher education is valued and important and frankly, a requirement.

Consider this in contrast with yesterday's post on goods producing jobs -- which are typically associated with lower educational attainment. In this recession, the less educated have taken a tremendous hit.

Friday, July 8, 2011

Weekend Pitbull

Yes -- it's been awhile since I've posted any pictures. Life has been really busy over the last few months. In addition, we have a new, sad dog story to tell.

About a month ago, my wife and I found a stray pit bull in our back alley way. She was starving -- you could see her ribs. So, we started to feed and water her in the AM and PM. She stayed in the alley (it was overgrown with lots of vegetation, so there were plenty of cool places for her to lie down) mostly resting. Our vet gave us antibiotics and flea medication. After about a week and a half, she came up to us and let us pet her. She had no hair, infected eyes and was generally suffering from issues related to malnutrition. We named her Lita and Lita Ford (one of the original members of the band the Runaways, because, she's a runaway).

About two weeks ago, we gave her a small tranquilizer to calm her and got her to our vets where she's been ever since. In general, she's in pretty good shape. She has mites which in conjunction with overall stress caused her hair loss. Her eye infection is clearing up and she's feeling better -- she's far more curious about people and responds well to other dogs and the people at the clinic.

The only problem is my wife and I can't keep her. We already have three dogs and that's about the extent of what we can do. So -- if you'd like to take in a pit and know the breed, please leave your name in the comments. And now -- without further adieu -- here is Lita:


Where Will Growth Come From in the Second Half?

Yesterday, I noted that I see "muddling" growth of around 2% in the second half of the year, due to a variety of factors. Here I will outline various benchmarks that I need to see in order to reverse that prediction.

1.) Employment growth is a must. Initial claims have to move below 400,000 for a sustained period, and private sector job growth must begin to print in the 150,000/175,000 range. One of the primary reasons for low levels of consumer confidence is the unemployment situation. If the buying public sees consistent improvement in these numbers, we can expect some improvement in sentiment, which will lead to an increase in consumption.

2.) Emerging economies have to move to a growth oriented footing -- or at least move onto a neutral footing. Starting about six months ago, China started hitting the breaks on their economy. Brazil and India followed suit in short order. As I pointed out yesterday, Brazil now has an inverted yield curve and India's is flattening. As these economies are the prime drivers of growth, they have to return to a more growth oriented mode. Unfortunately, the reason for the rate increases is respective domestic inflationary pressures, which means we probably won't see rate decreases in the near future.

3.) Washington has to move away from its austerity obsession and look at creating jobs. We've been over the infrastructure argument half a million times, but it bears repeating. Half of those currently unemployed are construction and manufacturing employees. An infrastructure program would get those people employed. If you don't want to float government debt for it, repatriate overseas corporate profit and use some of the funds to open an infrastructure bank. An no -- austerity does not lead to growth.

Employment Report: Sucks Wind

From the BLS:

Nonfarm payroll employment was essentially unchanged in June (+18,000), and the unemployment rate was little changed at 9.2 percent, the U.S. Bureau of Labor Statistics reported today. Employment in most major private-sector industries changed little over the month. Government employment continued to trend down.

.....

Total nonfarm payroll employment was essentially unchanged in June (+18,000). Following gains averaging 215,000 per month from February through April, employment has been essentially flat for the past 2 months. Employment in most major private-sector industries changed little in June, while government employment continued to trend down.

In June, average hourly earnings for all employees on private nonfarm payrolls decreased by 1 cent to $22.99. Over the past 12 months, average hourly earnings have increased by 1.9 percent. In June, average hourly earnings of private-sector production and nonsupervisory employees declined by 1 cent to $19.41. (See tables B-3 and B-8.)

The change in total nonfarm payroll employment for April was revised from +232,000 to +217,000, and the change for May was revised from +54,000 to +25,000.


On a scale of 1 to 10, this is a 1. We added jobs. But not really any.

Thursday, July 7, 2011

Friday Dollar Analysis

Last week, I wrote the following about the dollar:
I'm still thinking the dollar is forming some type of bottom at this time. The EU situation appears to be at a head, giving the market "closure."
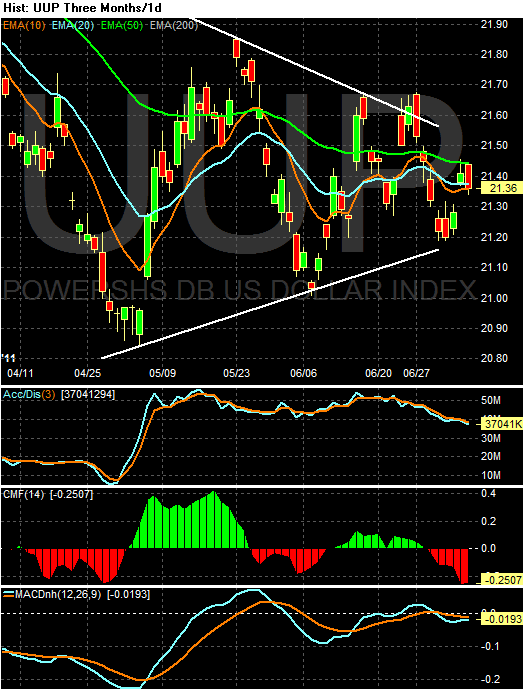
This week, the dollar continued its consolidation


The dollar is forming a classic triangle consolidation pattern right now, complete with decreasing volume. Note the EMAs are all tightly bundled and moving near horizontally.


Notice the A/D line indicates fresh money has not entered the market, which is confirmed by the low reading of the CMF. Also note the MACD is vacillating around a "0" reading right now.

This is a classic consolidation pattern in action.

The facts about Social Security and chain weighted CPI

- by New Deal democrat

There is a small furor in the political blogosphere today about Obama offering to index Social Security benefits to the "chain-weighted" CPI vs. the CPI for all urban workers, or CPI-W (the traditional measure). There is a lot of misinformation or poor information out there, including an article at the Great Orange Satan claiming that the resulting cut would only be 14 cents a month for the average recipient. Here are the facts.

Data for the chain weighted CPI has only been collected since December 1999. During the first 10 years, while the CPI-W rose 30%, the chain-weighted version rose 26.6%. On an annualized basis, that is 2.45% vs. 2.20%. In other words, so far chain-weighted CPI has averaged 0.25% less a year.

The diary on G.O.S. appears to take the 10-year average and then divide by 10, with an example that under the current system, a $1044 monthly benefit would rise to $1075.32 (a 3% increase). The diary claims that under the chain-weighted system, the payment would only go down 10 cents a month, to $1075.22. This is nonsense, it posits a change of .001%, not the .25% based on the evidence of the last 10 years.

In fact, under a chain weighted system, as opposed to the hypothetical 3% increase, the chain-weighted increase would be to $1071.77.

That's still only $3.55 a month.

The problem is, the changes are cumulative. Each year the chain-weighted index falls back further and further.
By the end of 10 years, the .25% loss of the chain-weighted increase would result in a net loss of 3.4%.
After 20 years, the loss is 5.4%.
After 30 years, the loss is 8.3%.
After 40 years, the loss is 11.1%.
After 50 years, the loss is 14%. And so on.

Hence David Dayen calculated the cumulative loss to a person retiring in 2012 would sustain a $500 loss in the year they turned 75, and a $1000 loss in the year they turned 85 under the chain-weighted system.

A tail-end boomer retiring in 2022 would face the $1000 cut by the time they turned 75.
A Gen-Xer retiring in 2032 would start out with the $1000 cut and it would get worse from there.
An early Millenial retiring in 2042 would start out with a $1500 cut a year compared with present benefits.

Those are the facts. I will leave you to your own opinion. BTW, feel free to educate the DKers, since I won't be cross-posting this.

Expect *another* poor nonfarm payrolls report tomorrow

- by New Deal democrat

Last month, when the consensus was for a payrolls gain of about +150,000, I said to expect a report more like +50,000. I based this on the difference between how payrolls behave in the face of rising initial jobless claims vs. falling claims. For your reference, here is the scatter graph I ran last month comparing initial jobless claims vs. nonfarm payrolls, which includes the deterioration in jobs leading up to and into the recession in red vs. the improvement during the recovery in blue:


It simply makes a world of difference whether you are deteriorating into recession, or in recovery coming out of recession, leading to very different scatterplots as above (the same pattern is true for every other postwar recession).

As I have previously noted, we only have one true example of a double-dip, and that is the failed 1980 recovery turning into the 1981-82 recession. Here is the scatter graph for that double dip, showing the abortive recovery (blue) and the double-dip (red):


Given the continuing initial claims in the 410,000 - 430,000 range, the poorer (red) trend on the scatterplot graphs is the one we should be referencing. More accurately, while we don't know what a new "red line" might be developing, it is almost certain to be to the left of the recent recovery "blue" line. Even with the "summer stall" last year, where GDP only fell to +1.7%, nonfarm payrolls fell into and remained in 5-digit territory.

Predicting the nonfarm payrolls number is admittedly a mug's game - there is variability of something like +/-125,000 around any estimate. This month the consensus is still for +110,000 private payrolls, and +80,000 total (meaning 30,000 lost government jobs). Unlike last month, both of these estimates look to be "in the ballpark." At the same time, a number similar to last month's looks more likely to me, and a larger loss of government jobs (which has happened in both June 2009 and June 2010). Let me put it this way: the range of reason includes a negative overall number for the first time in over a year.

Don't Expect a Second Half Rebound

The general thought process of most analysts argues for a stronger second half of the year. I am not so optimistic for the following reasons:

1.) Gas prices will not stay low. As I mentioned in today's oil market analysis, there is little hope for a continued period of low oil prices; the fundamentals of the market are simply far too bullish. Barron's article on the oil market last week summed up the basic situation:

Despite the recent 20% decline from April highs, new highs on crude, heating oil, diesel fuel, jet fuel and gasoline seem likely over the next 12 months. Following some further easing over the summer, the second leg of the long-term bull market in petroleum–the first occurred in 2007-08–probably will begin this fall.

As oil producers' spare capacity gradually declines to worrisome levels, the average monthly price could reach a record $150 per barrel by next spring, with spikes to $165 or $170. With this, $4.50-a-gallon gasoline will become the norm. That will put a huge dent in consumer wallets, while ramping up the desirability of fuel-efficient cars.

The continued short-term easing of oil prices should benefit the economy over the summer, only to exact a much larger payback later. The projected oil shock of spring 2012 will hurt the economic expansion, but not kill it, pruning about 1.5 percentage points from quarterly growth in real gross domestic product.

As such, I believe the choke hold of high oil prices will continue to exact growth concessions from the economy.

2.) The EU situation is continuing to lower overall confidence. Earlier this week, Portugal's debt was cut to junk status and there is already talk of problems with the Greek bail-out package. At this point, there is little reason to see this situation getting noticeably better -- that is, better to the point where it is no longer hurting overall confidence. Add to that the ECB is now hawkish on interest rates, and you have an added economic braking mechanism to contend with.

3.) The jobs market in the US continues to fluctuate around 9% unemployment, and initial new claims remain above 400,000. Washington is acting like its 1938 all over again, which will do nothing but hurt economic growth in the short-run as well as negatively impact confidence in the economy. Simply put, Washington is doing literally everything wrong right now, and the net result will be diminished growth.

4.) As I pointed out yesterday, Brazil now has an inverted yield curve, India's is flattening and China is raising rates and reserve requirements to lower overall inflation. In short, the central banks of the economies that drove world wide growth are raising rates to slow their respective economies. This will add to lower growth in the US, which has relied on exports to drive the last two years of expansion. We've already seen a wave of PMI slowdowns across Europe as a result.

5.) With the end of QEII, the largest buyer of treasury securities has left the market. The end result has been rising interest rates.

I seriously hope my analysis is wrong on this -- and if you see bright spots, please let me know. I just don't see any right now. At best, I see a muddling growth fluctuating around 2%.



Thursday Oil Market Analysis

Last week, I wrote the following about the oil market:
My long-term prediction for oil is for prices to again move higher and stay there because of the macro level supply/demand situation (see the link above for the charts). However, right now the chart has to move through a fair amount of technical resistance. Prices have to advance through the EMAs and several resistance levels. I would give prices through July or mid-August to accomplish that feat before moving into higher territory.
At the heart of my analysis is this basic situation:
The oil market is caught between two different issues. In the short-term, there is concern about the pace of expansion. Lower growth = lower oil demand = lower prices. However, as I pointed out above, there has been a strong, fundamental, long-term shift in the world's oil demand as countries like India and China have grown with their demand supplementing US/EU demand, providing a long-term floor under prices. But currently, these countries are also tying to slow growth due to increased inflationary pressures within their respective countries. In other words, there is currently a great deal of negative sentiment weighing down oil prices.


With 2 billion more people now demanding oil -- and supplies incredibly tight -- there is little hope for continued downward pressure on oil prices.

Simply put, there is tremendous amount of pressure on oil prices to move higher, with little to no reason for them to move lower. As such, arguing for higher oil prices is a no brainer.

Let's take a look at the chart:


Prices have sold-off for several reasons. First, the IEA coordinated a massive release of oil to offset lost production due to the Libya situation. In addition, for the last month there has been concern about the pace of economic recovery, leading traders to sell net long positions. However, we are now right in the middle of the summer driving season which will add upward pressure to prices. Additionally, nothing has changed in the supply and demand situation to warrant a change in the overall outlook.

On the chart, prices are now moving through several layers of technical resistance after their sell-off. However, they have already moved through the 10 and 20 day EMA as the MACD has printed a buy signal. The 10 day EMA is moving higher and the 20 day EMA is moving sideways. The next layers of resistance are the 50 day EMA and the 97.5/98 price level.

As I wrote last week, moving through this many layers of technical resistance takes time. I gave it about a month, which I still think seems like an adequate amount of time make this move. As such, I still see prices moving higher for the summer and for prices to be back over $100 within a month.

Wednesday, July 6, 2011

Brazil's Yield Curve is Inverted

From Bloomberg:


This is not what you want to see in an economy that is driving world growth.

China Raises Rates Again

From Bloomberg:

China raised benchmark interest rates for the third time this year after inflation accelerated to the fastest pace since July 2008.

The one-year deposit rate rises to 3.5 percent from 3.25 percent, effective tomorrow, the People’s Bank of China said on its website today. The one-year lending rate will increase to 6.56 percent from 6.31 percent.

Today’s move may fuel concern that monetary tightening will trigger a slowdown in the world’s second-biggest economy. A manufacturing index fell in June to the lowest level in 28 months on weaker growth in orders and output.

Inflation “is the Chinese authorities’ top policy priority for the near future,” Peng Wensheng, a Hong Kong-based economist with China International Capital Corp., said before the announcement.

I highlighted the increase in BRIC countries' interest rates yesterday. This is obviously more of the same. These economies are driving world growth. As they raise their rates, their economies will slow, hurting US growth.

The yield curve and pre-WW2 recessions

- by New Deal democrat

This continues my look at leading indicators as they may apply to pre-WW2 deflationary recessions. I have already looked at BAA bonds, housing starts, commodity prices, and the stock market. Today I will look at the yield curve.

Since 1960, the yield curve, in conjunction with "real M1," accurately foretold 8 of 8 recessions with no false positives. This is the "Kasriel Recession Warning Indicator" (named for Paul Kasriel of the Northern Trust Company). This indicator has also worked in reverse. If both the yield curve and real M1 were positive, the economy was expanding.

Two and a half years ago, I wrote a 5 part series, Economic Indicators during the Roaring Twenties and Great Depression, to see how well the Kasriel indicator worked before 1960. This series was sparked in large part by the most unnerving economic graph I've ever seen, from Ned Davis Research, the most relevant part of which is reproduced below:


In this graph, Fed Funds rates (pre-1935 rates are from the NY Fed) are in green, and long term government bond rates are in red (you can ignore the other two). As you can see, for virtually the entire period beginning in late 1929 and continuing right through the Great Depression and into the 1950s, the yield curve was resolutely positive. And yet that period coincided with the two worst downturns in the last 100 years, as well as three other recessions.

With help from a paper by a fellow named Ben Bernanke, I was able to reproduce graphs of long term interest rates (green), the fed funds rate (blue), and the CPI (red). Here they are for the 1920's:


And here they are for the early 1930's:


The result is, the yield curve inverted and accurately signaled the inflationary recession of 1920-21, the 1926 recession, and the onset of the 1929 "great contraction," but utterly failed to forecast its continuation, or the 1938 recession, or the two immediate post-WW2 recessions.

Of particular note, from early 1928 until late 1929, the yield curve was inverted. In fact, during 1929, with fed interest rates 6% over the CPI, the inverted yield curve (with long term bonds ~1.5%-2.5% under short term rates), was the most serious inversion until 1981 when Paul Volker killed inflation by raising interest rates some 9% over the inflation rate.

To sum up: in deflationary recessions, a positive yield curve is useless. An inverted yield curve in the face of deflation, however, does accurately signal the onset of a deflationary recession.

A Noted Increase in the Calls for Infrastructure Spending

From Hedge Fund Manager Barton Biggs:
Instead, Mr. Biggs, former chief global strategist for U.S. investment banking powerhouse Morgan Stanley, demanded the U.S. government temporarily return to ideas used in the Great Depression as a way to get the country back to higher growth.

"What the U.S. really needs is a massive infrastructure program … similar to the WPA back in the 1930s," he says.

The plan would be to employ some of the many unemployed people, jump start the economy, as well as help catch up with Asia, which is building state-of-the-art infrastructure from new mechanized port facilities to high-speed trains.

He suggested financing such building through the sale of U.S. Treasuries.

From Bill Gross of PIMCO:

Additionally and immediately, however, government must take a leading role in job creation. Conservative or even liberal agendas that cede responsibility for job creation to the private sector over the next few years are simply dazed or perhaps crazed. The private sector is the source of long-term job creation but in the short term, no rational observer can believe that global or even small businesses will invest here when the labor over there is so much cheaper. That is why trillions of dollars of corporate cash rest impotently on balance sheets awaiting global – non-U.S. – investment opportunities. Our labor force is too expensive and poorly educated for today’s marketplace.

In the near term, then, we should not rely solely on job or corporate-directed payroll tax credits because corporations may not take enough of that bait, and they’re sitting pretty as it is. Government must step up to the plate, as it should have in early 2009. An infrastructure bank to fund badly needed reconstruction projects is a commonly accepted idea, despite the limitations of the original “shovel-ready” stimulus program in 2009. Disparate experts such as GE’s Jeff Immelt, Fareed Zakaria, Jeffrey Sachs and Paul Krugman believe an infrastructure bank to be an excellent use of deficit funds: a true investment in our future. While the current administration admits that the $25 billion in Recovery Act spending on infrastructure only created 150,000 jobs, it also stabilized and improved this nation’s productivity for years to come. Clean/green energy investments also come to mind, most of which require government funding and a government thrust in order to create millions of jobs.

From Larry Summers:

Larry Summers, the outgoing director of the White House National Economic Council, said the US must ramp up spending on domestic infrastructure to drive the economic recovery.

Speaking at the Financial Times’s View from the Top conference in New York, Mr Summers called it a “short-term imperative and a long-term macroeconomic imperative” that the US government increase infrastructure investment. He said that a combination of low borrowing costs, cheap building costs and high levels of unemployment in the construction sector made this the ideal time to rebuild roads, bridges and airports.

What's interesting is the financial people don't seem to be concerned with fixing the deficit; they view the overall threat to growth as the primary problem facing the economy right now.

Treasury Tuesdays

Last week, I wrote the following about the Treasury market:
The fact that the long end of the curve didn't follow the belly higher is interesting. That and the continued deterioration in the TLT's technicals tells me the long end of the curve is selling off -- or at least holding even for awhile. I'm not convinced the IEFs are going to maintain a strong rally here, largely because the long-end of the curve is not following through. As such, I don't see the IEFs current move higher continuing. That would analysis would change if the TLTs break higher to new levels.
The Treasury market sold-ff last week. Yesterday, the WSJ today reported on the sell-off thusly:
The three-month run-up in Treasurys prices may be running out of steam—if the market isn't poised for an outright reversal. The longest selling streak in months has persuaded some analysts that yields have reached the bottom.

U.S. Treasury debt has sold off after a set of weak government debt auctions in the past five sessions—and has done so on notable trading volume. Until that point, prices had rallied since early April, fueled by a drumbeat of soft U.S. economic data and alarming headlines out of Europe.

On June 27, the benchmark yield touched a 2011 low of 2.842%. It has since catapulted above 3.20%. The 0.342 percentage-point jump in the past five sessions is the largest weekly advance since August 2009, prompting some analysts to suspect the bull run may be fizzling out. Bond yields move inversely to prices.

Goldman Sachs Group chief interest-rate strategist Francesco Garzarelli, on Thursday said he believed the Treasurys rally is over, as U.S. economic activity is expected to pick up in the second half of the year. He isn't the only one.

Barring any bad news from Europe, "we suspect the bottom is in," said Eric Green, chief U.S. rates strategist at TD Securities. He specifically pointed to the past months of weak data giving way to stronger economic growth and more attention to inflation.

Chris Ahrens, interest-rate strategist at UBS, says he sees yields pushing higher. "After a steady downward path since early April, it marks an important moment for the bond markets," he said. "The pressure is going to be on data to prove the more constructive [economic] scenario."

I'm not sold on the second half recovery story yet; although the recent action in the equity, copper and bond markets indicate traders are certainly buying into the argument. I do think the end of QEII is having a pronounced effect as the largest buyer of debt is effectively leaving the market. Let's take a look at the charts:

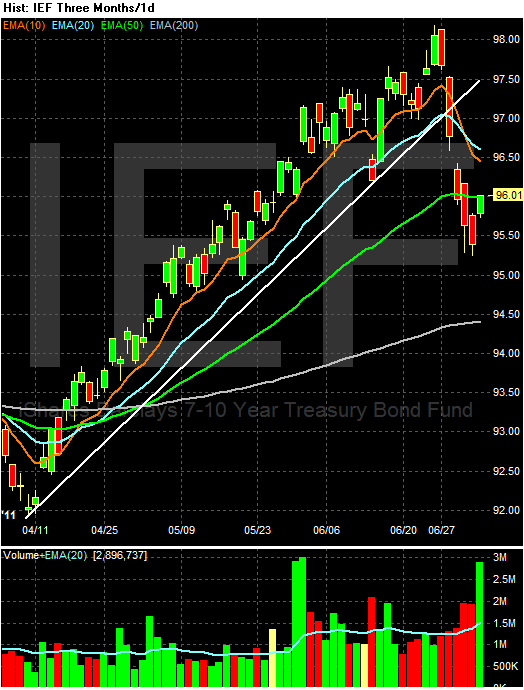
The 5-minute IEF chart shows the strength of the downtrend over the last 10 days. I've included Fibonacci retracement levels, as I would expect some type of rebound trade this week.


Prices have clearly moved below the 10, 20 and 50 day EMAs on an increase in volume. The 10, and 20 day EMA are both moving lower, and the 10 day EMA has crossed below the 20 day EMA. Prices have broken the upward sloping trend line. I would expect prices to rebound into the 10 or 20 day EMA before continuing their move lower with a price target of the 200 day EMA.


The TLT chart is slightly more bearish, as the 50 day EMA is also moving lower and prices are right below the 200 day EMA. However, notice the drop-off in volume as prices have moved lower these last two days, indicating the market may be using the 200 day EMA as a place to "pause" and catch its breath.

Given the low trading volume and the price action around the 200 day EMA, I'm thinking the TLTs will pause here or rebound into the EMAs. However, I think the IEFs are targeting the 200 day EMA. Given the Fed's departure, I believe the Treasury market is moving lower for the time being.

Tuesday, July 5, 2011

BRIC Economies Are Raising Short-Term Interest Rates

Consider the follow charts of short-term rates in China, Brazil and India:


Three of the four BRIC countries are hiking interest rates to combat inflation. Higher rates = lower growth.

Economic Week in Review

On Monday's I'm going to start looking at the previous week's major economic releases, analyzing the numbers along the same lines as used in the Fed's Beige Book. The reason is simple: this will help us all digest the news in a way that helps us understand the macro-level direction of the economy. Unlike NDD's higher frequency analysis, this will focus on the largely coincidental economic numbers that are released monthly and in some cases quarterly.

Consumer spending: Real personal consumption expenditures dropped .1%. The primary reason for the decrease is a drop in both non-durable and durable goods expenditures, which was caused by a drop in auto purchases. Real PCEs have now dropped the last two months, after a strong rise starting in early 2009. Consumer sentiment is still weak, as evidenced by both a drop in the Conference Board's number and the University of Michigan consumer sentiment number.
Link
Manufacturing: The ISM number surprised on the upside, but the new orders number was weak, as was the overall production number. In addition, the Chicago PMI also surprised on the upside. However, as I'll show later today, emerging economies are raising short-term interest rates, thereby slowing their respective economies. We've also seen signs of a slowdown at the global level in manufacturing, leading me to conclude this months numbers were abberations in an otherwise slowing manufacturing environment.

Real Estate: The good news here is the Case Shiller number increased, indicating the housing market may be bottoming. As I noted last week (see also here and here) -- and as NDD has also pointed out (see this post as well)-- it appears the housing market is closer to a bottom than conventional wisdom implies.

While the good news last week was Greece avoiding a default, the overall tenor of most reports was negative. Consumer sentiment is slipping, causing a drop in spending. Since this is 70% of US GDP, this is hardly a good development. Globally, manufacturing is in a slowdown, largely caused by emerging economies raising interest rates to control inflation.

Equity Week in Review and Preview of the Upcoming Week/Month

Last week, I wrote the following about the markets:
Right now, the 200 day EMAs are providing enough technical support to allow the markets to "catch their breath" from the recent sell-off. Traders have understandable concerns about the pace of recovery and the Greek debt situation. However, the disciplined pace of the sell-off and the stalling of the descent at the 200 day EMA indicate there is enough bullish sentiment to give the market pause -- at least for now.

However, a strong, multiple market break (involving 2 of the 3 major averages) below the 200 day EMA would be a watershed moment for this market. Should that happen, I would wait for a rebound into an EMA and then short.
I obviously did not see the strength of last weeks advance. Take a look at this five minute chart:


That is an incredibly strong rally that lasted for the entire week. All the EMAs are moving higher, prices are using the EMAs for technical support and there is a strong uptrend in place. The chart is printing a series of higher highs and higher lows -- a classic rally chart.


Prices have clearly bounced off the 200 day EMA and moved through all the EMAs. All the EMAs are moving higher, and the 10 day EMA has crossed over the 20 day EMA. Also note the strength of the bars, especially Friday's. Four of the five bars last week have very long bodies, indicating prices advanced throughout the day. There was also a nice bump up in volume for the last three trading days of the week. The fact the market did not sell-off on Friday is incredibly encouraging.


The A/D and CMF all indicate that money is flowing into the market, and the MACD indicates momentum is increasing.


The above chart shows possible support levels in case of a market pullback, which would be expected after a strong rally like that which occurred last week.

This week's rally was caused by three factors: first, we had end of the quarter fund manager window dressing, which forced managers with extra cash to put it to work. Second, the Greek vote agreeing to new austerity measures means the problems caused by the EU periphery have abated at least for now. Third, the market was oversold.

At this point, we should acknowledge that the stock market is a leading indicator. The question now becomes, was this week's advance a sign that equity traders think the worst is over, and therefore it's time to get into the action? The weakness in the Treasury market last week would bear this out, as would the rise in the oil market and copper's recent advance through key resistance areas. However, I'm personally not sold on a third or fourth quarter rebound yet. Consumer spending is weakening, global manufacturing is softening, emerging economies are increasing interest rates (US exports have been strong during the recovery) and Washington is full of idiots doing everything they can to screw up the economy. I would need to see an advance through previous highs on multiple indexes (with the Russell 2000 being one) before I'm sold on the veracity of this rally.

Monday, July 4, 2011

Happy Fourth of July

We'll be back tomorrow morning when the markets open