Yesterday provided some perfect examples of the conventional wisdom about the housing market - namely, that recent new declines in the Case-Shiller Index show that we are spiraling down into the double-dip of Doom.
Jeff Cox of CNBC wrote:
It's official: The housing crisis that began in 2006 and has recently entered a double dip is now worse than the Great Depression.Writing at the Huffington Post, David Paul of the Fiscal Strategies Group was even more pessimistic, writing that Those Waiting for a Housing Market Rebound May Have a Long Wait Ahead:
Prices have fallen some 33 percent since the market began its collapse, greater than the 31 percent fall that began in the late 1920s and culminated in the early 1930s, according to Case-Shiller data.
Even with the sharp contraction in prices that we have realized since the unraveling of the mortgage bond market almost three years ago, housing prices remain high by historical standards ....
[W]ith the expiration of the first-time homebuyer tax credit and looming end to the quantitative easing ..., the housing market is only now being left to face the brunt of post-crisis market forces without those two forms of federal support. As that support falls away, it is hard to be optimistic about the direction of the housing market ....
... S&P projects that when all is said and done, home prices will fall 35% from their pre-crisis peak, meaning that we have another 15% downside to go. Yet by historical standards, this will not produce "cheap" prices as S&P suggests, but rather return prices to within historical norms. But whatever bottom is ultimately reached in housing prices, a resurgent housing market will also require an environment that provides reasonable expectations for asset price stability, if not appreciation. And this appears unlikely to happen any time soon.
(my emphasis)
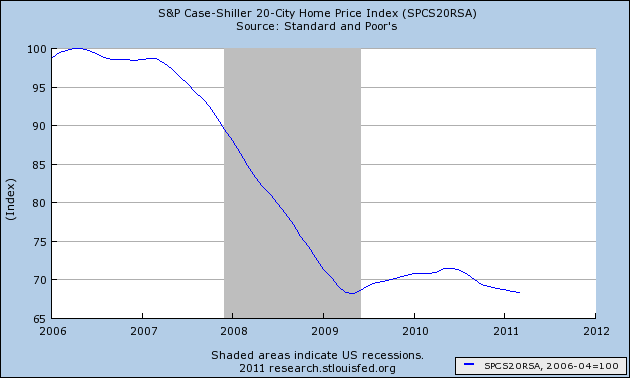
To the contrary, I submit that the above graph shows that there is no descent into the abyss discernable in house prices over the last 2 years.
Furthermore, certainly as to the Case Shiller 20 city index (red in the graph below vs. the 10 city index in blue), real inflation-adjusted prices have fallen to year 2000 levels and are certainly in their pre-bubble normal range for the last 24 years since either series was begun:
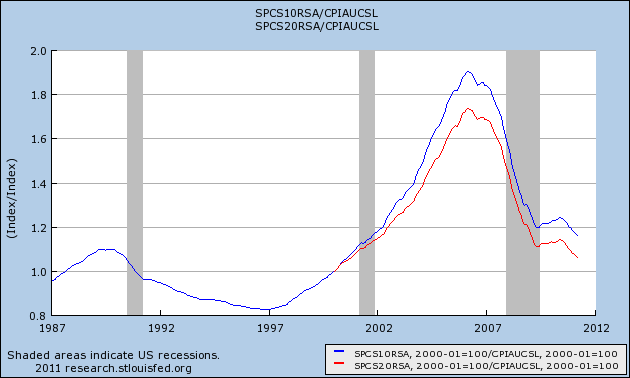
This doesn't mean that real prices can't fall further. But what it does mean is that most if not all of the remaining decline might not be in nominal prices. Nominal prices could easily stabilize while inflation means that the "real" value of housing continues to decline, just as it did in the earlier 1990's.
And that brings me back to the 1,000,000+ asking price database from Housing Tracker, which accurately showed the turn in the market in 2006 - a fact I know because I documented it at the time. On Monday, using an unweighted average from the 54 metro areas tracked in the database, I showed that the YoY% decline in asking prices was rapidly abating, and that if the trend continued at the same velocity, a bottom in prices could be reached as early as next winter.
As chance would have it, over the weekend for the first time the site added aggregate information for the entire US from April 2006 to the present. This means that I can easily calculate the YoY% changes in asking prices nationwide since the peak of the market, right up until last week (marked with an asterisk in the chart below):
The weighted average shows a similar abatement in YoY% declines this year as did the unweighted average I calculated on Monday. Generally we can see that the declines got worse and worse until the $8000 credit was enacted. The declines rapidly abated, and then increased again as soon as the credit expired. (Also, Calfiornia had a temporary, additional $10,000 credit which enhanced the effect there). But the declines have swiftly abated again this year as "real" prices approach their historical norms and inventories continue to decline to lows not seen since 2006. In fact, the 4.5% YoY decline reported for last week is equal to the smallest decline in 4 years.
Here is the same information from the chart above shown graphically (h/t Silver Oz):
This is a series that, even without artificial government support, wants to continue to trend towards the zero threshold.
In comparison, here is the YoY% change for the same period of time in the Case-Shiller 20 city index:
This doesn't mean that real prices can't fall further. But what it does mean is that most if not all of the remaining decline might not be in nominal prices. Nominal prices could easily stabilize while inflation means that the "real" value of housing continues to decline, just as it did in the earlier 1990's.
And that brings me back to the 1,000,000+ asking price database from Housing Tracker, which accurately showed the turn in the market in 2006 - a fact I know because I documented it at the time. On Monday, using an unweighted average from the 54 metro areas tracked in the database, I showed that the YoY% decline in asking prices was rapidly abating, and that if the trend continued at the same velocity, a bottom in prices could be reached as early as next winter.
As chance would have it, over the weekend for the first time the site added aggregate information for the entire US from April 2006 to the present. This means that I can easily calculate the YoY% changes in asking prices nationwide since the peak of the market, right up until last week (marked with an asterisk in the chart below):
| Month | 2007 | 2008 | 2009 | 2010 | 2011 |
|---|---|---|---|---|---|
| January | --- | -7.5% | -11.5% | -5.8% | -8.7% |
| February | --- | -7.8% | -12.0% | -5.2% | -8.4% |
| March | --- | -8.3% | -10.9% | -5.0% | -7.3% |
| April | -2.7% | -8.6% | -9.6% | -5.0% | -6.8% |
| May | -3.5% | -9.1% | -8.1% | -5.0% | -5.6% |
| June | -5.0% | -9.8% | -7.0% | -5.0% | -4.5%* |
| July | -5.4% | -10.4% | -6.1% | -5.1% | --- |
| August | -6.0% | -10.6% | -5.5% | -6.1% | --- |
| September | -6.2% | -11.1% | -5.1% | -6.6% | --- |
| October | -6.7% | -11.4% | -4.5% | -7.0% | --- |
| November | -6.6% | -11.7% | -4.5% | -6.7% | --- |
| December | -7.2% | -11.4% | -5.6% | -7.8% | --- |
The weighted average shows a similar abatement in YoY% declines this year as did the unweighted average I calculated on Monday. Generally we can see that the declines got worse and worse until the $8000 credit was enacted. The declines rapidly abated, and then increased again as soon as the credit expired. (Also, Calfiornia had a temporary, additional $10,000 credit which enhanced the effect there). But the declines have swiftly abated again this year as "real" prices approach their historical norms and inventories continue to decline to lows not seen since 2006. In fact, the 4.5% YoY decline reported for last week is equal to the smallest decline in 4 years.
Here is the same information from the chart above shown graphically (h/t Silver Oz):
This is a series that, even without artificial government support, wants to continue to trend towards the zero threshold.
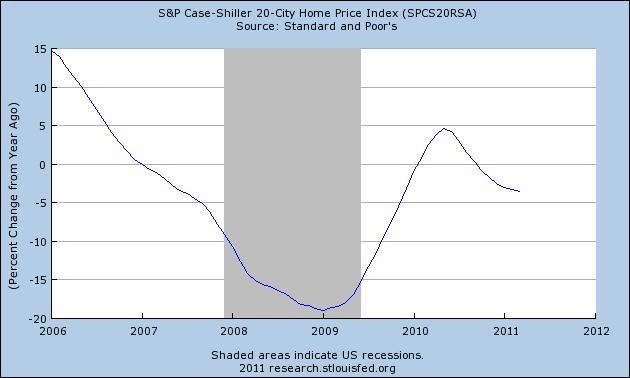
In comparison, here is the YoY% change for the same period of time in the Case-Shiller 20 city index:
The Housing Tracker trend in asking prices appears to run 1 to 4 months ahead of the Case-Shiller sales data, which as of the moment is only available through March. Even in the Case-Shiller series, it looks like the YoY% change may be close to bottoming.
To put it bluntly, an examination of the newly available aggregate US asking price data from Housing Tracker contradicts the conventional wisdom above that, as "the housing market is only now being left to face the brunt of post-crisis market forces, it is hard to be optimistic about the direction of the housing market," that "we have another 15% downside to go," and that "reasonable expectations for asset price stability, if not appreciation [a]ppears unlikely to happen any time soon."
To the contrary, housing prices have already "faced the brunt of market forces" without support for a full year, as a result of which they have been falling closer and closer to equilibrium, the rate of decline is abating, and actual real time data shows that nominal if not inflation adjusted stability may indeed be reached as soon as early next year.