Friday, March 25, 2016

Corporate profits head south


 - by New Deal democrat

At long last, the BEA has released corporate profits for Q4 2015.  Here's the bad news:


Corporate profits are a long leading indicator, and they have now turned negative for the second quarter in a row.  Usually proprietors' income (blue in the graph below), reported much more timely, tracks their direction well, but sometimes corporate profits (red) turn first - and in the 4th Quarter, that's what happened:


I'll be updating my look at all of the long leading indicators next week. Stay tuned ....

Note from Bonddad: this has been one of my biggest issues with the market for the last 6-12 months.  Both Zack's and Factset.com have documented a deteriorating revenue and earnings picture.  Just last week, I made the following observation in my weekly market commentary:

Market Outlook: the market is still expensive. The current and forward PE for the SPYs and QQQs is 23.61/21.45 and 17.05/18.09, respectively. The revenue and earnings picture is weak.  From Factset: 
The estimated revenue decline for Q1 2016 is -0.8%. If this is the final sales decline for the quarter, it will mark the first time the index has seen five consecutive quarters of year-over-year declines in sales since FactSet began tracking the data in Q3 2008. Five sectors are projected to report year-over-year growth in revenues, led by the Telecom Services and Health Care sectors. Five sectors are predicted to report a year-over-year decline in revenues, led by the Energy and Materials sectors......
The estimated earnings decline for Q1 2016 is -8.4%. If this is the final earnings decline for the quarter, it will mark the first time the index has seen four consecutive quarters of year-over-year declines in earnings since Q4 2008 through Q3 2009. It will also mark the largest year-over-year decline in earnings since Q3 2009 (-15.7%). Only three sectors are projected to report year-over-year growth in earnings, led by the Telecom Services and Consumer Discretionary sectors. Seven sectors are projected to report a year-over-year decline in earnings, led by the Energy, Materials, and Industrials sectors.
To reiterate: we’re potentially looking at 5 consecutive quarters of revenue declines and four consecutive quarters of earnings declines. These are bear market statistics. And they go a long way to explaining why I continue to be slightly bearish regarding the markets.

Bonddad Friday Linkfest


Next Thursday, March 31 at 3PM CST, I'll be doing a free webinar that will review the last month or so of US economic data along with an overview of the major markets (equities and bonds).  It's free! It'll last at most 30 minutes (probably shorter).  You can sign up here.


US Durable Goods


Wednesday, March 23, 2016

Time to Go Long on Emerging Markets?


Is Industrial Production "less bad"?


 - by New Deal democrat

One of my pet peeves is analysis that relies too much on Year-over-year comparisons, as in "X is still YoY positive/negative."  If you do that, you are going to miss turning points, which happened sometime during that year - perhaps many months before the sign turned.

But one good use of YoY comparisons is to see if they are getting "less good/bad."  This will help you spot a change in trend.

A few analyses in the last several weeks noted an improvement in the YoY comparison in Industrial Production, and I also made mention of it in my last Weekly Indicators  column.  But let's take a little closer look, first at the long term:


YoY industrial production tends to bottom right at the end of recessions (this is true of most recessions over the last 100 years, the above graph is limited better to show the current situation).  That little hook at the right is the recent improvement in YoY industrial production.

Here is a close-up of the lastl year:


There have only been two months of "less worse" readings, and they are well within the range of noise.  I would like to see several more months of such improvement before I would be confident that the shallow industrial recession has bottomed -- although, with the recent decline in the US$, that is the more likely scenario.

Bonddad Wednesday Linkfest

Don't forget about our monthly economic and market review on Thu March 31 at 3PM.  It's a free webinar.  You can sign up at this link.


Tuesday, March 22, 2016

Global Economy Has Taken Some Hits Already This Year ... And It Shows

This is quite a series of events from Fed President Lockhart.

We know that in January and early February, the world's financial markets, including our own, went through an episode of significant volatility. From the first trading day of January, investors appeared to go "risk off" and headed for safety. A number of concerns seemed to gang up on investors: the weak fourth quarter here in the United States, economic weakness globally in advanced economies and emerging markets, the apparent economic slowdown in China, Chinese currency depreciation, and the falling oil price and what that could mean for global demand.

We know that an important index that measures financial volatility—the VIX—rose to a level above 28 (a very high reading) on February 11 and has since settled back to a much calmer reading around 15. We know that financial markets here have substantially recovered lost value, but we do not know if the volatility investors experienced and the public observed in January and early February will have any extended impact on the broad economy.

We know that on March 5, the government of China stated its GDP growth target for the next measurement period at a range of 6.5 to 7.0 percent. The introduction of a range was interpreted as allowing for lower growth than recorded in the past, reinforcing the sense that China's economy is slowing.

We know that the Bank of Japan—Japan's central bank—unveiled a negative rate policy on January 29. Japan joined the eurozone in using negative official rates to spur inflation and growth.

We know that on March 10, the European Central Bank deployed Mario Draghi's "bazooka." The ECB pushed its policy rate more into negative territory and took other strong measures in an attempt to pull the eurozone out of its persistent weak state evidenced by very low inflation.

These are some highlights of a rough start to the year. As I said, the context has mutated somewhat since December, even if, all things considered, the economy remains on a positive trajectory.

Combine that with this chart of global growth from the Dallas Fed


One of these business metrics is giving a false signal


 - by New Deal democrat

The recent poor numbers on wholesaler and retailer inventories and sales stand in stark juxtaposition to the improvement in weekly reports of steel production, rail transport (until last week!), and consumer spending by the likes of Goldman Sachs and Gallup. The monthly numbers say deterioration, while the weekly numbers say improvement.

A similar contradiction is playing out in ISM new orders vs. business inventories and sales. Typically new orders turn positive first (red, left scale in the graph below), followed by sales (green, right scale), and finally inventories (blue, right scale):


Sales and inventories are shown YoY for easier visual comparison.  Here are the raw numbers for both sales and inventories:


ISM new orders have show two months of slight improvement, while inventories are no better than flat, and sales continue to decline.

Now here is a close-up on the last several years of the first graph above:


Inventories haven't really followed sales at all.  If this is an incipient recession, then I would expect inventories to follow sales, which means that ISM new orders are giving a false signal.  On the other hand, if this is simply a slowdown, like 1998 (far left in the first graph), then sales should turn positive, and like 1998 inventories will not decline, in which case it is elevated inventories that are giving the false signal.

Bottom line: either ISM new orders are falsely signaling optimism, or business inventory accumulation is falsely signaling pessimism.  A cause for optimism that the discrepancy will resolve to the upside is that the regional March Empire State, Philly, and as of this morning Richmond manufacturing indexes have all shown a positive spike in new orders.

Bonddad Tuesday Linkfest

Don't forget about our monthly economic and market review on Thu March 31 at 3PM.  You can sign up at this link.


Monday, March 21, 2016

Five graphs for 2016: March update


 - by New Deal democrat

At the beginning of this year, I identified graphs of 5 aspects of the economy that most bore watching.  With the first 2 months of data under our belts, let's take a look at each of them.

#5 The Yield Curve

The Fed having embarked on a tightening regimen as of December, the question is, will the yield curve compress or, worse, invert, an inversion being a nearly infallible sign of a recession to come in about 12 months.

Here's what has happened so far:


Rates on 2 year treasuries have risen slightly, while the 10 year treasury yield has fallen (typically long rates only start to fall once the tightening cycle has caused the economy to weaken).

Still the difference in the two rates, at about 1%, is typical when measured over the long term.  There is no particular tightness here.  At the same time, if the trend continues (no guarantee of that), then even as few as two more .25% rate hikes by the Fed could cause the yield curve to invert.

#4 The trade weighted US$

Perhaps the biggest story of 2015 was the damage done by the 15%+ surge in the US$ that began in late 2014 -- which not only harmed exports, but pretty much cancelled out the positive effect on consumers' wallets by lower gas prices.

Here there has been a big change:


Against all currencies, the US$ is now only up 3% -- a typical reading.  Against major currencies, the US$ has actually declined YoY.   This is good news.

#3 The inventory to sales ratio

An elevated ratio of business inventories to sales means that businesses are overstocked.  This has frequently but not always been associated with a recession.  Here the news is not good at all:


Typically sales peak/trough first, and inventories catch up with a lag.  In late 2015, inventories went sideways, even as sales continued to slide.  In the last two months, not only have sales continued to decline, but more inventory has been accumulated.  This is going in the wrong direction, and is about the single worst statistic in the economy. 

#2 Discouraged workers

While 2015 saw a big improvement in involuntary part time employment, the number of those so discouraged that they did not even look for work, even though they want a job, went stubbornly sideways until the last quarter of 2015.  In the last two months it has actually retreated from its December low,  and is still elevated well above its rate in the later part of the 1990s through 2007:


This may be just noise, or it may herald a stagnation in improvement.

#1 Underemployment and wages

The single worst part of this economic expansion has been its pathetic record for wage increases. Nominal YoY wage increases for nonsupervisory workers were generally about 4% in the 1990s, and even in the latter part of the early 2000s expansion.  In this expansion, however, nominal increases have averaged a pitiful 2%, meaning that even a mild uptick in inflation is enough to cause a real decrease in middle and working class purchasing power. 
There is increasing consensus that the primary reason for this miserable situation has been the persistent huge percentage of those who are either unemployed or underemployed, such as involuntary part time workers. 

This expanded "U6" unemployment rate ( minus 10%)  is shown in blue in the graph below, toether with YoY nominal wage growth (minus 2%):


In the 1990s and 2000s, once the U6 underemployment rate fell under 10%, nominal wage growth started to accelerate.  U6 is now 9.7%, and there has been some mild improvement off the bottom.  More than anything, the US needs real wage growth for labor, and the present nominal reading of slightly over 2% still isn't nearly good enough.

Bonddad Monday Linkfest

Don't forget about our monthly economic and market review on Thu March 31 at 3PM.  You can sign up at this link.

Oil's weekly chart broke through major resistance last week


Sunday, March 20, 2016

Saturday, March 19, 2016

Weekly Indicators for March 14 - 18 at XE.com


 - by New Deal democrat

My Weekly Indicator post is up to XE.com.

Most of the negative trends of 2015 have abated.  And then there's rail traffic ....

Friday, March 18, 2016

Jazz Shaw Doubles Down on Stupid

     One of the great things about suffering from the Dunning-Kruger effect -- which Jazz Shaw clearly does -- is that you don't know when you look stupid.  It allows you the option of continuing to make the same incorrect arguments without having the burden of acknowledging that you're beyond wrong.  And that's exactly where we are with one Mr. Shaw in his continual quest to argue that moderate increases in the minimum wage lower employment.

     First, let's review where we are.

1.) I have demonstrated that, based on the public record, Mr. Shaw is not qualified to discuss economics.
2.) Mr. Shaw -- like many on the right -- assume labor demand is elastic, when in fact it is inelastic.
3.) Mr. Shaw -- like many on the right -- has no idea about the cost curve, which is a central concept in microeconomics, nor can he explain why lower usage of labor would not lead to lower revenues (again, basic micro).  This point bolsters point 1.
4.) Mr. Shaw used the wrong data to prove his argument that the minimum wage caused a drop in Seattle employment.  This also boosts point 1.
5.) Notice now many things Mr. Shaw has said prove he doesn't know when he's talking about?  This is a classic case of Dunning-Kruger.

Now, Mr. Shaw is back, arguing that, because the CEO of Carl's Jr. is thinking about using Kiosks in response to minimum wage increases, that those increases will lead to lower employment.  And on the surface, that makes sense, right?  After all, there will be fewer jobs now.

But here's the rub: will it work?  We once again run into basic micro-economic concepts, which Mr. Shaw obviously doesn't know.  As I pointed out a few articles ago, the short-term cost curve demonstrates that, when you cut back too much on labor costs, your revenue goes down.  Again, micro 101 in action.  What happens is simple: the drop in labor means less customer service, less efficiency and less product produced.

More importantly, Wal-Mart tried this idea, with remarkably negative consequences:

A recent Reuters’ analysis confirmed something that many consumers have long suspected: Walmart simply does not have enough employees. The discount king’s footprint grew by around 45% in the last decade, yet its employee base grew by around eight percent.

That explains why customers sometimes have to spend up to half an hour searching for an employee when they need help at Walmart. It also appears to be the root cause of some of Walmart’s most glaring deficiencies, such as empty shelves, out of stock merchandise, long checkout lines, overaged produce on the shelves, and declining same store sales.

Reuters’ numbers indicate that the average Walmart employee has to deal with about 34% more store space. From a practical standpoint, that means a lot of work is not getting done at Walmart.

It also benefits competitors like Kroger (NYSE: KR) and Costco Wholesale (NASDAQ: COST), which are well known for high levels of customer service. One problem that Walmart is facing these days is that competitors like Costco and Kroger have figured out how to provide the kind of deep discounting customers want while delivering a fairly high level of customer service.

A big reason for these chains’ success has been their willingness to pay employees more and to offer benefits. Another has been their willingness to maintain a higher level of staffing, which increases expenses but retains customer loyalty.

This creates a dilemma for Walmart, which notoriously pays its employees very little. One result of this was that Walmart was effectively running a retail training school rather than a store. Employees would go to work there, get some experience and understandably move on to someplace like Kroger that offered higher wages and good benefits.

You might also want to see this article comparing Costco and Wal-Mart.

 Finally, the research shows that modest increases in the minimum wage actually stimulate the economy.   There are number of reasons why, but Keynes Marginal Propensity to Consume offers the best answer (someone else who Mr. Shaw doesn't know anything about).

So, once again Mr. Shaw is wrong.  But it doesn't matter to him because he's frankly too stupid to know that he's wrong -- which is part and parcel for Hot Air's economic analysis.

JOLTS adds to accumulating evidence of late cycle weakness


 - by New Deal demorat

Yesterday's JOLTs report (note: for January) has given us a more detailed look at the jobs market.  Last month was a particularly good report, but for most of the last 12 months I have been underwhelmed, noting that the pattern was similar to that in late in the last expansion.

First, here is a comparison of job openings (blue) and hires (red).  We only have one compete past business cycle to compare this with, so lots of caution is required, but in that cycle, hires peaked first and then openings continued to rise before turning down in the months just prior to the onset of the Great Recession:


That late 2005-06 pattern is what we hae been seeing for nearly a year now, as shown in this close-up of the last 2 years:


The same thing shows up in the YoY comparisons:


Early 2016 looks very much like early 2006.

After making a new post-reession record last month (very good), quits fell back at their late 2015 level:


Still, overall trend in quits appears to be positive, most like late 2005.

The good news is, this still looks like a late cycle slowdown, but not an actual contraction.  The bad news is, last month's good report was probably something of an outlier, and the evidence keeps accumulating that we are getting late in the expansion.

Bonddad's Friday Linkfest

At 3PM CST on Thursday, March 31, we’ll be reviewing the latest month of economic and market data in the US.  This is a free webinar that will last about 30 minutes.  You can sign up here.


Russia is in Terrible Shape


Thursday, March 17, 2016

First autos wobbled, now it's housing

 - by New Deal democrat

The two most leading sectors of the consumer economy are houses and cars.  For the last three months, vehicle sales have backed off of last autumn's highs.

My take on yesterday's report on housing permits and starts is up at XE.com.

At best, we have hit a temporary plateau.

Bonddad Thursday Linkfest

At 3PM CST on Thursday, March 31, we’ll be reviewing the latest month of economic and market data in the US.  This is a free webinar that will last about 30 minutes.  You can sign up here.


Chart from the Fed 


5-year Chart of the Dollar


Wednesday, March 16, 2016

I am running out of positives


 - by New Deal democrat

Not everything is gloom and doom.  Let me get the positive out of the way first: manufacturing industrial production rose +0.2% in February.  There is no sign whatsoever that the severe downturn in commodity production and exports, which caused the overall industrial production number to decline -0.3%, has hit the large manufacturing sector.  I don't see a recession where both employment and manufacturing are growing:


Now the bad news.  Although the -0.2% decline in consumer prices in February means that real retail sales were flat, the big downward revision in January was in no way ameliorated:


Worse, real retail sales per capita have been basically flat for 8 months, with a peak in December:


(note that population data isn't available for February yet, so the graph ends with January.)  This is a long leading indicator.

Just as bad, housing, which is perhaps the best of all long leading indicators, has also turned flat to negative.  No graphs yet, but neither permits nor starts made a new high.

Since the middle of last year, because of the NYC distortions, I have been looking at single family permits, and also permits excluding the Northeast in order to compensate.  Neither one of these made a new high, either, and both look flat for at least the last 4 months.

With a very long lag, 4th Quarter corporate profits will finally be reported as part of next week's final revision to Q4 GDP.  Should these not make a new high, which seems most likely, that would leave real money supply and the yield curve as the only two long leading indicators still giving positive results.

I am running out of positives.  At the moment there is no engine for growth.  Unless there is a quick jump-start to production and profits from the abating of US$ strength, or consumers finally spend much more of their gas savings, this does not bode well for 2017, and possibly Q4 of this year. 

Bonddad Wednesday Linkfest


UK Unemployment rate:


Tuesday, March 15, 2016

The US$ has ceased being a drag on the economy


 - by New Deal democrat

The biggest drag on the US economy for over a year and a half has been the surging US$, which favored imports and hobbled exports, counteracting the benefit to consumers of lower gas prices.

As I have been documenting in the last several months, all of the trends from the 2015 economy are changing.  And the biggest, most important of those trends, the strength of the US$, has also changed.

Here is the YoY% change in the trade weighted US$,, both broad (blue) and against major currencies (red), as of the Fed's update yesterday:


Not only is the US$ now down YoY against major currencies, but it has also faded to being just 3% positive YoY on the broad scale.  This is a much more neutral reading, as shown in this longer term view:


Note in particular that the YoY% change in the US$ has fallen to about where it was exiting the last two recessions.

It will take a few months at least before this feeds through into imports and exports, as well as corporate profits.  But for now the US$ has ceased being a drag on the economy.

Retail sales: February OK, January revisions - OUCH!


 - by New Deal democrat

The slight negative report for February in retail sales is not concerning, or at least not until we find out what February inflation was in the CPI report tomorrow, especially since ex-gasoline they were up +0.2%.

But the big OUCH! was the revision in January from +0.4% to -0.2%.  Here's the dismal graph:


The big hit was in general merchandies.  In particular furniture sales, building materials, and sporting goods, and  were poor.  I don't have a good explanation, and I find this revision particularly bothersome since it contradicts the contemporaneous weekly reports.  Needless to say, any evidence that the consumer is rolling over is particularly unwelcome.

In any event, further consideration after tomorrow.

P.S.:  I see that Bill McBride is reporting a good YoY number.  He has been using the same metric for auto sales, which one a monthly basis have retreated from their late 2015 highs .  As I have repeatedly pointed out, where we have seasonal adjustments, looking at YoY numbers will miss turning points, sometimes badly.  This makes tomorrow's housing permit and starts numbers all the more important.

Monday, March 14, 2016

Jazz Shaw: Dear God But the Economic Stupid is Strong With This One

     Jazz Shaw is a blogger at Hot Air who has written several pieces on Seattle's minimum wage issue.  He argues that the hike -- which is just beginning to take effect -- has sent Seattle employment plummeting, thereby proving his point that the hike was ill-advised.  However, as I will point out, Mr. Shaw is not only ill-qualified to make such an argument, but that the data he is using to justify his conclusion is the wrong data.  This second point not only disproves his thesis, but also bolsters my contention that Mr. Shaw is simply unqualified to write about economics in general.

     Who is Jazz Shaw?  Oddly enough, for a man with an extensive online presence, we know remarkably little.  I received the following after typing "Jazz Shaw, Biography" into Google:

Jazz Shaw is a heretical, Northeastern former RINO and the weekend editor at HotAir.com He can be reached at jazzshaw@gmail.com. Or you can follow him on Twitter @JazzShaw

This tells us nothing about his qualifications to write about economics.  My suspicion is that he has no training in the field.  I will happily change that opinion should I see contradictory information. However, if he wanted to bolster his assertions, we'd probably see something definitive about his background.  In addition, his statement "Is economics really a science? I’ve long felt it should be taught alongside astrology or some related field," is not only wrong (there is a tremendous amount of data and analytical work in the field that is statistically and mathematically very sound) but is the kind of thing someone would say to imply they could offer an informed opinion without having the requisite pedigree to do so.

     Let's turn to his latest effort, which is titled, "Fight for 15 update: Seattle employment craters." The entire basis for this article is a report from AEI, which supposedly shows a large drop in Seatle employment numbers after the minimum wages increased.  Here's the problem:  The AEI study uses the wrong data to justify its argument.  From the LA Times:

Now, Perry is back, armed with what he says are Seattle-only statistics. "Seattle's 'radical experiment' might be a model for the rest of the nation not to follow," he wrote on Feb. 18. He cited figures from the Bureau of Labor Statistics showing that Seattle employment fell by more than 11,000 from April, the date of the first minimum wage hike, through December. He compared these numbers to the Seattle MSA, writing that "while jobs in the city of Seattle were tanking starting last April, employment in the suburbs surrounding Seattle was increasing steadily to a new record high in November."

Unfortunately, local economists say Perry is still using bad data. Although he attributes the city-only numbers to the Bureau of Labor Statistics, they're not reliable jobs numbers. Perry's source is the Local Area Unemployment Statistics file, or LAUS, which is based on a small sampling. It's aimed at counting the number of employed people living in the sample area (in this case, Seattle), not the number of jobs. The data are "prone to error," University of Washington economist Jacob Vigdor told me by email, and "basically worthless for any serious analysis." 

Indeed, Vigdor — who is overseeing the university's analysis of minimum-wage data — notes that the same statistics for Bellevue and Everett, Wash., showed exactly the same percentage decrease that Perry found in Seattle, even though they haven't increased their minimum wage. (See below.)

Cities that didn't institute a wage hike experienced the same drop. That indicates something else is the cause of the drop.  You can't argue an event only impacting one area is the primary cause for the drop in two adjoining areas experiencing a similar decline.  That's poor logic.

     Shaw's and Perry's reasoning run into two primary microeconomic problems.  Both assume labor demand is elastic (a term I doubt Mr. Shaw is familiar with) -- that a change in cost will have a disproportionate impact on demand.  However, this simply isn't true.  For example, let's assume that a restaurant owner currently has 10 employees when wages increase.  Let's assume he fires 4 people due to increase cost.  At some point, he'll cut off his economic nose to spite his face -- that is, he'll lower his payroll to such an extent that he'll hurt customer service, lowering overall revenue.  Given the profit maximizing principal underlying cost theory (again, I doubt Mr. Shaw is aware of this concept, either), the current level of 10 employees is probably already peak efficiency, which means he'll either, absorb the cost, cuts costs elsewhere, raise prices, or do some combination of all three.

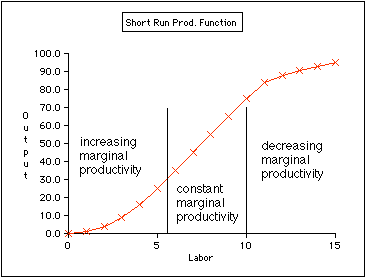
     And then there's the inherent problem of the production function graph:


As anyone who knows micro (which, it is painfully obvious Mr. Shaw doesn't) would note, when you lower your primary short-term variable cost (labor) you also lower your output.   Now, it's possible you might not do too much damage, depending on a number of different factors, but the bottom line is that you're moving in the wrong direction.

     So, Mr. Shaw, you have not won the argument, as you claim.  In fact, you've demonstrated that you really don't know anything about economics.  This of course, doesn't concern him.  He is a political blogger making political points.  Data is irrelevent.  However, it's also important that a record exists documenting his incompetence in this matter, if for no other reason, than to show him the large error(s) in his analysis.


Two encouraging signs from Transport


 - by New Deal democrat

Charles Dow's theory was that industrial production and the transportation of goods should move in tandem.

While we don't have any high frequency data with respect to manufacturing generally, last week I shared a graph showing that steel production appears to have bottomed, and indeed for the last two weeks the YoY change in steel has been positive.

On the transport side, rail traffic is reported weekly, but truck traffic only monthly.  The AAR report of carloads ex-coal shipments has been particularly encouraging.  Here's a graph of the last 3 years:


What is particularly positive about rail carloads ex-coal is that in the last few weeks, they haven't just been outperforming 2015, but 2013 and 2014 as well. They've been outperforming 2015 since mid-January.  And this measure doesn't include intermodal traffic, which is heavy with imported goods.  In other words, transport of domestically manufactured goods by rail looks pretty encouraging.  In a couple of weeks, the comparisons will get more challenging.
One pretty good monthly measure of trucking, meanwhile, is the Cass Freight Index, which just came out for February.  Since trucks do not carry coal very much, the comparison with rail carloads ex coal is a good one:


This is still negative YoY, but note that it is much "less bad" than any comparison since September.  And sufficiently so that it suggests that if we could seasonally adjust, probably late last autumn was the bottom.  We'll have to wait a month and see if trucking follows rail into positive territory in March.

Saturday, March 12, 2016

Weekly Indicators for March 7 - 11 at XE.com


 - by New Deal democrat

My Weekly Indicator post is up at XE.com.

For the last month I have pointed out that the trends that were established in 2015 are all reversing.  That process continued this week, as one more turned positive, and one deteriorated closer to negative.