Monday, January 7, 2013

2013 forecast: housing and refinancing vs. oil and austerity, part 1


- by New Deal democrat

My method of foecasting is pretty simple. In fact, so simple, I call it the K.I.S.S. method. Even though the LEI is the statistic most denigrated by Wall Street forecasters, it has the inconvenient habit of being right more often than the highly-paid punditocracy, especially at turning points.

Since I'm not a highly paid Wall Street pundit, I simply rely upon the LEI for the short term, and the yield curve for the longer term with the caveat of watching out for deflation. The simple fact is, with one exception, if real M1, and real M2 (less 2.5%), are positive, and the yield curve 12 months ago was positive, the economy has always been in expansion. When real money supply is negative, and the yield curve was inverted 12 months ago, the economy has always been in contraction. The exception is that the yield curve does not help to project the economy 12-16 months later if the economy at that later date is in deflation - as it was in 1930-32 and late 2008 and early 2009.

Since in the last couple of years I have also learned a lot about the methods of the late Prof. Geoffrey Moore, the founder of ECRI, I've also been able to intergrate his findings about short and long leading indicators into my forecast.

This year, the LEI, the yield curve, and the short and long leading indicators of Prof. Moore are in close agreement: they suggest that, for the next 3 to 6 months, the economy will continue to shamble along just barely avoiding recession. Thereafter all of the long leading indicators are suggesting further improvement. But as we saw in late summer 2012, an unexpected Oil price spike can complicate the picture. And the embrace of austerity as enacted by last week's "fiscal cliff" agreement also throws a monkey wrench into the forecast.

Let's take each of those items in order.

For the first half of 2013, the economy will shamble along basically sideways.

Here is a chart, from Briefing.com, of the monthly change in the LEI for the last two years:


Notice that in March 2012, the positive bias downshifted markedly. In fact, for the last 6 months through November, the index did not advance at all. Since a significant downdraft in November was the spike in inital jobless claims post-Sandy that completely reversed itself in December, we can expect a similar rebound in the LEI for December when it is released in a couple of weeks. This suggests an economy that is moving forward, but with very little momentum.

ECRI's Weekly Leading Index, which is also supposed to be a short, 6 to 8 month leading index, suggests the same shambling forward - which is no surprise, since it contains many of the same components. More specifically, it consists of initial jobless claims, the JoC ECRI commodity index, purchase mortgage applications, commercial vs. treasury yield spreads, real M2 money supply, stock prices, and corporate bond yields. Here is ECRI's latest publicly available graph of its WLI growth index:


Six to twelve months ago this index was generally negative to neutral. It is only in the second half of 2012 that it began to improve and then turn positive for the last three months. Additionally, several short leading indicators that only appear monthly, and are therefore not in the WLI - namely, new factory orders and ISM backlog of deliveries and inventory readings - are at recessionary readings. This index actually suggests deterioration in the economy in the next three months or so before stabilization by midyear.

We can also take note of the Oil choke collar in this analysis. It appears that gas prices bottomed in December 2012 at the identical price they were in 2011. It is reasonable to expect that the Oil choke collar will engage by spring and remain engaged, with gas quite likely hitting $4 a gallon by summer.

So is the balance tipped towards expansion or contraction in the first part of the year? With housing permits and car sales hitting new post-recession highs, with the S&P 500 index having just made a new 4 year high, and with initial jobless claims hitting new 4+ year lows, the answer should be an easy "NO!" None of these things has ever been consistent with a recession.

But Congress and President Obama just threw a monkey wrench into the works, in the form of a 2% payroll tax increase on the first $110,000 of income. The fact is, in order to maintain the long-term solvency of the Social Security Trust Fund, that increase (really just the ending of a temporary cut) was necessary. But for the health of the economy, without any offsetting relief on consumers, a new and significant drag has been added to consumer spending.

And it is consumer spending via refinancing which has been keeping the economy treading water for many months now. Frankly, I expect to see a significant pullback in consumer spending as a result of the decrease in disposable income within the next 3 months. Unless a further opportunity to refinance at even lower interest rates appears, that may be enough to tip us into a short term contraction at some point in the first 6 months of this year, specifically including one or more months of actual job losses beginning in March or April.

Contractionary fiscal policy is, after all, contractionary.

(continued in part 2)

Morning Market Analysis; Potential Bull Market Charts Developing


The above three charts show the IWM (Russell 2000, top), QQQs (NASDAQ, middle), and SPYs (S&P 500, bottom) in a daily (6 month) format.  I think it's best to think of all three averages as a coherent system rather than separating each market out individually.  While the IWMs are now at 6 month highs, the QQQs and SPYs are not.  Perhaps most disappointing is the SPYs stalled at resistance after such a strong jump higher at the opening on Wednesday.  Also note the declining volume as the week progressed, which is also a negative. 

It is still possible for follow through to occur.  The markets have not meaningfully sold-off and the underlying technicals are still good for the averages (rising MACD and positive CMF).  However, the lack of follow-through last week is troubling for the bulls.

Let's now look at the entire US treasury market.


Above are the weekly charts of all the major treasury ETFs, from shortest maturity to longest maturity.  There are a few key points to make:

1.) The longer ETFs have clearly declining MACDs.  The shorter ETFs do not have rising MACDs.

2.) All the ETFs have weakening CMFs

3.) The longer ETFs are at or near important, long-term resistance levels.

4.) The intermediate ETFs are approaching important, long-term resistance levels.

Also note there now appears to be some dissent within the Federal Reserve's ranks about the the timing of the end of QE.  Assuming the Fed signals the program will end at the end of this year, I would expect a sell-off of some magnitude in the treasury market.

However, also remember that certain yields on government bonds will naturally attract buyers looking for (or perhaps needing) the safety associated with government debt.  With inflation running at very cool levels, buy points will be low. 

Saturday, January 5, 2013

Weekly indicators: out with the old, in with the new edition


- by New Deal democrat

This week I am debuting a new template for this weekly report of the high frequency indicators, which usually signal the direction of the economy well before monthly reports. You won't have to wade through much verbiage, the raw numbers are prominently and simply displaced. This takes any subjective bias by me even further out of the picture. I plan on adding a brief comment at the end of each section. This week in the interest of (my!) time, I've only added it after the first number as a sample. My more general comments follow in the final paragraph. In future weeks I hope to add a little more detail to each data series to help you see the trend. Please let me have your feedback, good or bad.

But first . . . the big monthly data was the December payrolls report, which came in close to estimates at +155,000 jobs and unemployment at 7.8%. November's report was revised higher. Real average hourly wages turned positive YoY for the firt time in nearly 2 years. Auto sales were strong, just slightly below November's post-recession high. ISM manufaccturing returned to slight expansion. ISM services showed stronger expansion. Factory orders were ever so slightly higher. Construction spending declined slightly, but residential spending increased slightly.

Now let's turn to the high frequency weekly indicators:

Housing metrics

Housing prices
  • YoY this week. +2.2%
Comment: Housing prices bottomed at the end of November 2011 on Housing Tracker, and have averaged an increase of +2.0% to +2.5% YoY for the last year.

Real estate loans, from the FRB H8 report:
  •  +0.2%
  • w/w
  •  +2.2%
  • YoY
  • +2.7%
  • from bottom

Mortgage applications
  •   -14.8%
  • w/w purchase applications
  •   not reported
  • YoY purchase applications
  • -23.4%
  • refinance applications w/w


Interest rates and credit spreads
  •  -.09% to 4.61%
  • BAA corporate bonds
  •  -.04% to 1.76%
  • 10 year treasury bonds
  • -.05% to 2.85%
  • credit spread between corporates and treasuries


Money supply
M1
  •  +1.2% w/w

  •  +2.6% m/m

  • +11.9% YoY Real M1

M2
  •  +3.7% w/w

  •  +15% m/m

  • +6.5% YoY Real M2


Consumer spending
  •  ICSC +0.6% w/w +2.7% YoY

  •  Johnson Redbook +2.9% YoY

  • Gallup daily consumer spending $86 up $12 YoY


Oil prices and usage
  •  Oil $93.09 up $2.39 w/w

  •   gas $3.30 up $.04 w/w

  • Usage 4 week average YoY -2.3%

Employment metrics
Initial jobless claims
  •   372,000 up 22,000

  •   4 week average 360,000 up 3,250

American Staffing Association Index
  •   94 flat w/w

Daily Treasury Statement tax withholding
  •  $194.2 B vs. $175.7 B +10.6% YoY last 20 days

  •  $185.8 B vs. $162.3 B +14% December monthly YoY

Transport

Railroad transport
  •  -33,800 or -13.8% carloads YoY

  • -11,500 or -9% carloads ex-coal

  • -25,400 or -14.0% intermodal units

  • -59,300 or -13.9% YoY total loads

  • 17 of 20 types of carloads down YoY


Shipping transport
  • Harpex flat at 362

  • Baltic Dry Index up 6 to 706


Bank lending rates
  • 0.24 TED spread

  • 0.2077 LIBOR


JoC ECRI Commodity prices
  • up 0.43 to 126.07 w/w

  • +5.22 YoY

Almost all of the high frequency data was either positive or neutral this past week. Initial claims rose significantly, but the 4 week average was the lowest in over 4 years, ex last week. Tax withholding was positive. Temporary jobs were neutral. Consumers continued to spend in line with the trend for the last several years, or even better if you go by Gallup. Credit spreads were accomodative. Real estate loans incresed, although refinancing was hurt due to higher rates. Money supply continued to be very positive and bank lending rates were at new lows. Shipping at least stopped falling. Rail loads this week are best averaged with the excellent data one week ago, and are largely due to YoY anomallies at the end of the year.

Have a nice weekend.

Friday, January 4, 2013

John Cornyn is an Idiot of the Highest Order

From an editorial in the Houston Chronicle:

The biggest fiscal problem in Washington is excessive spending, not insufficient taxation. Tax cuts didn't cause this problem, so tax increases won't solve it. If we don't reduce spending and reform our three biggest entitlement programs - Medicare, Medicaid and Social Security - then we will strangle economic growth, destroy jobs and reduce our standard of living. With the national debt above $16 trillion, and with more than $100 trillion in unfunded liabilities hanging over us, our toughest fiscal decisions cannot be postponed any longer.

Republicans are more determined than ever to implement the spending cuts and structural entitlement reforms that are needed to secure the long-term fiscal integrity of our country.

The coming deadlines will be the next flashpoints in our ongoing fight to bring fiscal sanity to Washington. It may be necessary to partially shut down the government in order to secure the long-term fiscal well being of our country, rather than plod along the path of Greece, Italy and Spain. President Obama needs to take note of this reality and put forward a plan to avoid it immediately.

Let's start by looking at a history of the deficit:


Let's start with the above two charts.  The top chart shows federal receipts and expenditures in logarithmic scale, while the bottom chart shows the difference in absolute dollar terms.  Several points stand out.

1.) We started to see larger deficits starting in the early 1980s -- the time of the beginning of the "great moderation" and the country's implementation of supply side economic doctrine.

2.) After two recessions -- those occurring in the early 1990s and early 2000s -- we see deficits increase right after the end of the recession and decrease as the economy expands.  The jury is still out regarding this recession.  While there has been a drop, it hasn't been that big yet.  This tells us that either we see strong enough economic growth after the recession to lower it, meaningful policy action in Washington or some combination of the two.

3.) After both the 1980s recession and the early 2000s recession, the budget never returned to surplus -- which it did occur after the early 1990s recession.


The above chart places the deficits and surpluses in GDP perspective,  converting the dollar amount of the deficit to a percent of nominal GDP.  While the dollar amount appears to increase in the logarithmic chart (the top chart), the chart above shows that a deficit of between 3%-6% of GDP post recession was normal coming out of recession starting in the mid-1970s.  In addition, our current budget deficit is decreasing as well, moving from about 9%/GDP to 7%/GDP over the last four years.  While this percentage is higher than the other post-recession events, the last recession was extreme.


The above chart shows federal expenditures and receipts as a percent of GDP -- the same information as the preceding chart, but showing both data sets.  Again a few points stand out.

1.) The budget expenditures during the "great moderation" show expenditures being consistently higher than receipts.

2.) Our current situation is very much out of the statistical norm.

3.) The current situation is as much a product of the recession and the associated government spending stabilizers accompanying that event as entitlement spending problems.

Let's add up all this information.

1.) The deficit has been built up over a long period of time -- starting in 1980 and the implementation of supply side doctrine.  At that time, government spending increased and taxation decreased.

2.) There has been a long history of actual neglect of the deficit issue.  In fact, a strong argument could be made that Republicans could care less about the deficit when a Republican president is in the Oval Office.

3.) A strong argument could be made that a large percentage of our current problems are related to governmental stabilization payments to alleviate the effects of the recession.  The decrease in the deficit/GDP ration indicates that a period of stronger prolonged growth would have just the effect Cornyn is talking about.

All that being said, consider that according to the BEA, total GDP is currently at $15.8 billion and total federal debt is at $16.4 trillion, meaning the debt/GDP ratio of 103% -- hardly a fatal level.

Now -- let me address Senator Cornyn's statement that a partial shutdown of the federal government may be necessary.

Are you fucking insane?  No really, are you fucking insane?

First, considering that the government spending is a component of GDP, lowering government spending would lower GDP.  There is also standard IS/LM analysis, which would draw the same conclusion (the LM curve would shift to the left, lowering national income).  And then there's a new paper from the IMF which says austerity cuts economic growth.  And that's before we get to how much damage a shutdown would cause to the financial markets if and when it occurs.

In short -- a temporary shutdown of the US government would be a really stupid and probably recession causing event.


December jobs report: a lukewarm end to 2012


- by New Deal democrat

2012 closed out with a lukewarm report. By now you probably know the headlines: +166,000 jobs and the unemployment rate steady at 7.8%. October and November were revised up by +14,000. The broader U-6 unemployment rate stayed at 14.4%.

As I usually do, let's first look at the more forward-looking indicators in the report, which tell us where we are likely to go from here. These were mixed, with somewhat of a positive bias:

- Manufacturing added 25,000 jobs.

- The manufacturing workweek increased 0.1 hours to 40.7 hours.
Since manufacturing generally leads the rest of the economy, this is good. The workweek is one of the 10 official LEI and so will boost the December report.

- The positive revisions to prior months are also a good sign, as this generally happens in expansions but not in recessions.

But on the other hand,

- while the household report showed 28,000 jobs gained, this is still below the number of jobs 2 months ago. The household report tends to turn first at inflection points.

- 600 temporary jobs were lost. Temporary jobs also tend to lead.

- the number of workers unemployed for 0 - 5 weeks increased by 80,000. This is a more forward looking indicator than initial jobless claims.

Other more coincident indicators were generally good:

- the index of aggregate hours worked in the economy increased by 0.4. This is the second strong increase in a row. Aggregate hours are thought to be an indicator at least some members of the NBER consult to determine expansions vs. recessions.

- average hourly pay increased $.07 to $23.73. YoY pay has increased by 2.1%. This is the first time in two years that YoY pay has increased more than YoY inflation. In real terms, Joe Sixpack has more to spend.

- construction jobs increased by 30,000. Of those, 12,000 were residential construction jobs. This is more evidence of the housing comeback.

- overtime remained steady at 3.3 hours.

- the employment to population ratio remained at 58.6%. This is still poor, and we will see the usual monthly arguments about how much of this is due to Boomer retirements.

This was a positive report, but as usual, not nearly good enough to really make a dent in the country's unemployment problem. The muted but mixed leading indicators in the report suggest the economy will continue to just shamble along.

P.S.: I would be remiss if I didn't point out that this puts yet another nail in the coffin of ECRI's recession prediction. According to them, we are now 5 months into a recession and payrolls are still increasing. Of the 11 recessions since WW2, only 4 showed employment peaks after the onset of the recession, by 1, 2, 3, and 8 months - the last in the abrupt 1973-74 recession brought on by the Arab Oil Embargo. [UPDATE: in percentage terms, those increases were less than 0.1%, 0.2%, 0.3%, and 0.9% in the case of the oil embargo. In the last 5 months, employment has increased 0.6%.] In other words, it is possible but very unlikely that the positive reports would go on this long into an economic contraction.

From Bonddad:

From the BLS:

Nonfarm payroll employment rose by 155,000 in December, and the unemployment rate was unchanged at 7.8 percent, the U.S. Bureau of Labor Statistics reported today.

A classic good and bad news headline.  The number of jobs is good but certainly not great.  However, the fact the unemployment rate didn't drop is a concern.  Statistically, the number of unemployed increased by more or less the same amount as the civilian labor force.  This means that more people entered the labor force, probably seeking employment.

Total nonfarm payroll employment increased by 155,000 in December. In 2012, employment growth averaged 153,000 per month, the same as the average monthly gain for 2011. In December, employment increased in health care, food services and drinking places, construction, and manufacturing.

It's interesting that for the last two years overall employment growth as averaged 155,000/month consistently.  That's not the most impressive rate of growth, as it's barely more than needed to absorb the population growth and hence, meaningfully lower the unemployment rate.  It also indicates there is a clear concern on the part of businesses regarding the hiring of new personnel.  Something -- or a group of "somethings" -- is clearly holding them back. 

In December, the average workweek for all employees on private nonfarm payrolls edged up by 0.1 hour to 34.5 hours. The manufacturing workweek edged up by 0.1 hour to 40.7 hours, and factory overtime was unchanged at 3.3 hours. The average workweek for production and nonsupervisory employees on private nonfarm payrolls edged up by 0.1 hour to 33.8 hours. (See tables B-2 and B-7.) 

Average hourly earnings for all employees on private nonfarm payrolls rose by 7 cents to $23.73. Over the year, average hourly earnings have risen by 2.1 percent. In December, average hourly earnings of private- sector production and nonsupervisory employees increased by 6 cents to $19.92. (See tables B-3 and B-8.)

Increases in hours worked and the overall workweek are always welcome.  In addition, these figures usually move in small increments, so the small rise is no surprise or overly concerning.

The change in total nonfarm payroll employment for October was revised from +138,000 to +137,000, and the change for November was revised from +146,000 to +161,000.

It's good that we don't see a massive downward revision to these numbers.  In addition, the upwardly positive revision to November is encouraging.

Morning Market Analysis


The Chinese market appears to have bottomed at the beginning of December and has been making a sharp rebound since.  Prices have advanced through resistance at the 2140 level and are now moving through resistance established in late March/early April.   Notice the buy signal from the MACD and strengthening price picture from the RSI.  Finally, prices are now through the shorter EMAs, and are now moving towards the 200 week EMA.


The long end of the treasury market is very interesting.  The daily chart (top chart) shows that prices are near six month lows.  We see a big gap lower on Wednesday and a long candle yesterday, both on very high volume.  The underlying technicals are very weak, with a declining MACD and CMF and shorter EMAs dropping.  Prices are now below the 200 day EMA.  On the weekly chart, notice that prices are at very important long-term technical levels; a move below the 116/117 level could presage a strong move lower.


While the dollar had a strong advance yesterday, the important issue on this chart is that prices have strong support at the 21.6 level.


The oil market is in the middle of a nearly one month rally.  It started a little after December 10.  Prices have now moved through all the EMAs (including the 200), followed by bullish price action from the shorter EMAs with the 10 and 20 crossing over the 50 right before Christmas.  The MACD is rising, although the CMF is a little weak.  Prices are now at important technical levels established at the beginning of October.


Thursday, January 3, 2013

Young-Broder-in-training hears a heavy stillness


. - by New Deal democrat

Young Broder in Training, Ezra Klein, ever willing to shill centrist neoliberal social welfare cuts, tries -- seriously -- to sell the idea that liberals should relax because Obama won the fiscal cliff negotiations, but confesses to being taken aback:
The frustration I’m hearing in the aftermath of the fiscal cliff deal is different. First, it’s less fury than disappointment. In the aftermath of these deals — with the possible exception of the 2011 debt-ceiling crisis — there’s usually a core group of liberal pragmatists who think the White House did indeed outfox the Republicans, even if much of the left is angry over the deal. This time, those sources seem to think the White House got outfoxed, that they traded a lot of leverage for a little revenue, and they’re depressed over it. 

Second, the disappointment is more total than I can remember it being at any time since the debt-ceiling crisis. I literally have not had one conversation in the last 24 hours in which the person on the other side of the phone tilted positive on the Deal.
(my emphasis)

In other words, instead of hearing hot frustration, he hears cold depression. The stillness of a dog which realizes its master will do nothing but continue to beat it. The quiet of an abused spouse who finally contemplates that her husband's repeated swearing that he'll never hit her again is an empty promise doomed to be broken. The silence of children whose parents have died, who know that their aunts and uncles really are going to put them in an orphanage. Hot anger has been replaced by cold acceptance. This is the sullen, heavy silence that Klein has heard.

At some level, it must finally be sinking in for those "on the other side of the phone" that they should take Obama at his word that he really is a 1980s moderate Reagan Republican who ran for office on the democratic line mainly as a flag of convenience. [Memo to the Daily Kos Obama kewl kidz: if you admit that your policies are 1980s GOP policies, then you are admitting that you are a 1980s GOPer, just as surely as a storekeeper who refuses to serve minorities is a bigot, despite any protestations to the contrary.]

But when the thief attacks the owner in the night, the dog is likely to cower in the corner. When the drunken husband falls asleep, the spouse loads up the car with her belongings - if she doesn't use the revolver first. The orphans grow up to adulthood and move away, while their cousins hold secret meetings vowing not to treat one another's children as their own parents treated their cousins.

So far, the fish-eyed consideration may only be of Obama. But in short order, the cold reserve may be extended to a wider group. Since the election, I have steadfastly maintained that is the democratic brand, not the GOP's, which is likely to be forever tarnished.

Ezra Klein has heard a heavy stillness. Usually it is accompanied by a greenish hue to the clouds. Soon there will be a far off rumble somewhere as the contemplative quiet gives way. There Will Be Consequences.

Bonddad's 2013 Economic Predictions: A Really Weak 2013 Is In Store

First, I actually hate the idea of making predictions, largely because there are simply way too many variables to consider in an economy as large as the US'.  So, I'm not going to make any targeted statement (the S&P500 will be at X level).  Instead, I want to highlight some trends that I think will either continue or emerge in the coming year.

I've written in some detail about this is over the last few weeks: see here and here

1.) Housing will continue to rebound.  Inventory of both new and existing homes are both at far more realistic levels and the Fed is driving down interest rates with its MBS program.  Housing affordability is at levels not seen in a very long time and builder confidence is rising.  Put all of these factors together and it appears that housing should remain on the comeback trail for most of next year.

2.) Inflation will remain contained.  There is far too much demand slack in the economy for there to be any demand pull inflation, and there is far too much slack in capacity utilization for there to be any supply push inflation.  While a commodity price spike of some sort is actually fairly likely, producers will absorb the increase in the conversion from raw to finished goods.

3.) US wages will continue to perform poorly.  Consider the following two charts:


The top chart is real disposable personal income's percentage change from the year before and the second is the year over year percentage change in average hourly earnings of production and non-supervisory employees. 

Currently, unemployment stands at 7.7% -- too high for any wage pressures to emerge.  In addition, let's assume that unemployment drops 1.5% this year -- which is a very generous assumption and one which I don't think has a remote possibility of happening.  That would place unemployment at 6.2%, which is still too high for there to be any meaningful upward wage pressure.

The bottom line is wages will have lackluster growth for most of 2013.

This prediction also bolsters prediction number 2.

4.) Washington will continue to provide a great deal of confusion for anyone trying to get a clear or even muddled vision of policy -- a fact which is entirely the Republican's fault.  From their clear denial of factual evidence (denial of evolution, denial of global warming, and their suppression of any evidence that contradicts their opinions), to the fact that a major conservative group nearly had an armed coup, to Speaker Boehner's complete inability to deliver a meaningful voting majority, the Republicans are bat shit insane.  They should not be listened to at all.

Quick update: I wrote this last weekend.  The fiscal cliff situation and the complete disregard for Sandy victims is literally icing on the cake, demonstrating just how completely out to lunch the Republicans are.

5.) Internationally, the BRIC story will continue to fade.  Brazil, Russia, India and China will continue to fall from the headlines as they each grapple with their own respective issues.  Brazil and Russia will deal with the effects of a slowing world economy and the inherent slowdown in commodity demand associated with same.  India has a terrible combination of high inflation and a stifling bureaucracy to deal with.  China has a new leadership in place and is working at changing the composition of its economy to a more demand driven model.  

6.) We start the year with three major economies in recession -- Japan, the UK and the EU.  That means that for at least the first half of 2013, there is little possibility of these regions generating meaningful growth.  In addition, it's highly likely they will slow down other regions as there will be lower trade going into any of these countries/regions.  Hence, the opening analysis of the world's overall situation is not encouraging.

7.) There is the possibility that the second half of the year will have stronger international growth.  However, I doubt we'll see anything except a weak, meandering rate of expansion from Japan, the UK or the EU.  Japan is in its fifth recession in 15 years; the UK hasn't meaningfully grown since 2008 and the EU is currently sinking further into recession.  None of these fact patterns points to anything except substandard growth for the coming year.

In short, as we exit 2012, we can pretty much assume that 2013 will look an awful lot like the year we're leaving -- painfully slow growth with the possibility of strong, downward shocks negatively impacting the issue.


Morning Market Analysis

First, a note on yesterday's price action.  It's only one day and we have a second fiscal fight coming up in less than two months.  As a result, I'm still holding to my primary argument for the stock market right now, that we're running into strong upside resistance and that concern about the slowing economy and large inflow into bonds prevent any continued and major move higher.

Let's place yesterday's action in perspective.


The good news for the bulls case is the IWM (Russell 2000, top chart), where prices moved through resistance on very strong volume.  In addition, this is the risk based capital market, so the move indicates a big increase in risk appetite.  However, the QQQs (middle chart) have a fair amount of technical real estate to make up before they come close to making new highs.  Plus, yesterday's price action occurred on weak volume -- a problem shared by the SPYs (bottom chart).  Also note the SPYs remained right at technical support, instead of closing higher.

Putting all of these factors together, we still at minimum need to see some confirmation from the following trading days to make an assessment of yesterday's move.  And the real move we need to see is a meaningful sell-off in the treasury and corporate bond market, indicating that risk based investment is back on.  And that's before we consider the second fiscal fight right around the corner.

However, if we see the SPYs move higher and the IWMs continue to move higher, a rally would be confirmed if we had a slight, profit taking sell-off to important technical levels.


All that said about the US market, I wanted to highlight one of the best performing international markets last year -- Mexico.  The weekly Mexican ETF (top chart) moved through the 63 price level in September, had a profit taking sell off to the 63 price level in early November and is now at its highest point in 2+ years.  However, the best news is the monthly chart (bottom chart) which shows that prices are now at their highest level in over 10 years.


Yesterday I noted that oil was really in the middle of a multi-year consolidation.  The weekly chart of copper (above) has the same problem.  Prices have been consolidating in a symmetrical triangle pattern for the last year.  There is no momentum and the consolidation is occurring right around the 200 week EMA.  If traders were expecting a strong economic performance to start, we'd see a far stronger chart for this important commodity.


Wednesday, January 2, 2013

"We now permanently have a tax system that will not raise enough revenue to cover our expenditures"


- by New Deal democrat

This is worth repeating. Andrew Samwick writes, seconded by Mark Thoma:
So Who Won the Fiscal Cliff Fight?: Obviously, former President George W. Bush. Despite how much he has been vilified in the years since his departure from office, the Congress and the President yesterday decided to ratify almost all of his tax policy agenda. As Joe Wiesenthal of Business Insider noted, "The difference between the Obama Tax Cuts and the Bush Tax Cuts? Obama's are permanent*." Joe also pointed out, quite astutely, that even if top marginal tax rates are not lower than in the Clinton years, taxpayers with the highest incomes are still paying lower taxes because all the tax rates below the top are lower. Who's laughing now?

Not me. In over eight years of blogging, you won't find a single word of praise for the Bush-Obama tax cuts. As a matter of revenue, we now permanently have a tax system that will not raise enough revenue to cover our expenditures.
And for that, we got a 60 day reprieve on cuts to Social Security and Medicare.

A Look Back At Oil's Price Movements

NDD has correctly identified oil as one of our economy's Achilles heels; he refers to it as the oil choke collar.  As such, it's important to understand how oil prices have behaved over the last few years.


On the monthly chart, we see the oil price spike of 2008 which helped to send the economy into the last recession.  But since then, oil prices have stayed more or less within Fibonacci retracement levels from the 2008-2009 oil sell-off (roughly 76 and 103).  Also note the importance of Fibonacci fans for the last two "rallies" in the oil market.

Looking at the underlying technicals, we see a somewhat weak picture.  First, both the momentum and CMF readings are weakening.   Second, the shorter EMAs are all moving lower. 

From the fundamental side, keeping prices from advancing too high is the overall slow world-wide economic situation, as slow-growth equals slower demand growth.  Secondly, the US is producing far more oil, leading to overall increased supplies.  Consider this chart of overall oil supplies from the latest This Week In Petroleum:

As of now, the US is amply supplied.


On the weekly chart, pay particular attention to the symmetrical triangle using red lines.  For all of 2012, oil prices consolidated from a high of 107.5 to a low of around 80.  Since then, prices have been narrowing their trading band.  Also note the importance of the 200 week EMA in the above chart; every time prices have moved below this important technical level, they have quickly rebounded. 

In addition, momentum is decreasing and the shorter EMAs (10, 20 and 50 week EMAs) -- while positive -- are all moving lower.

In effect, oil is in the middle of a waiting game. 


Market Analysis; 2013 Begins With A Whimper

First, it's good to be back.  I hope that everybody had a good holiday.  Let's start the year by looking at the long-term equity charts and comparing those with several treasury and corporate yield charts.


Currently, the market is running into resistance around the 140 level -- which is near the market top from the rally that ended in late 2007.  In addition, while the market has rallied from its 2009 lows.  the rallies have been decreasing in strength and magnitude.  The first ran from 65 to 110, the second from 100 to 130 and the third from 125 to 145.

Also note the momentum has stalled and the CMF -- while strong -- is declining.  Also note the slight uptick in BB width, indicating a possible increase in volatility coming up.


There are several pieces of color-coded information on this weekly chart.  First, notice that 140 provides key technical resistance.  Secondly, the trend line that started in late 2011 has been violated (the blue line).  Third, the red lines indicate prices are consolidating in a symmetrical triangle formation. 

So, these two charts tell us that prices have rallied from their 2009 lows, but they are running into resistance at the 140 level -- a level with a very strong historical meaning.  But the rallies that got us here are decreasing in intensity.  However, the bulls can still argue that prices are simply consolidating around the 140 level as they get their economic bearings for the new year.

Let's next turn to the treasury market.


Above is a graph of the yield of the 2, 5, 10 and 30 year CMTs.  One point clearly sticks out on the above chart: for the last half of last year, not much really happened.  Instead of strong trends up or down, we see more or lass horizontal lines that qualify as statistical or trading noise rather than meaningful movements.  In fact, the only real movement in the curve came when prices rallied (and yield fell) starting in either March or April of last year.  Also note the yields are incredibly low -- the 30 years is yielding under 3%.  This tells us that investors are concerned just as much (if not more) with return of capital as return on capital.


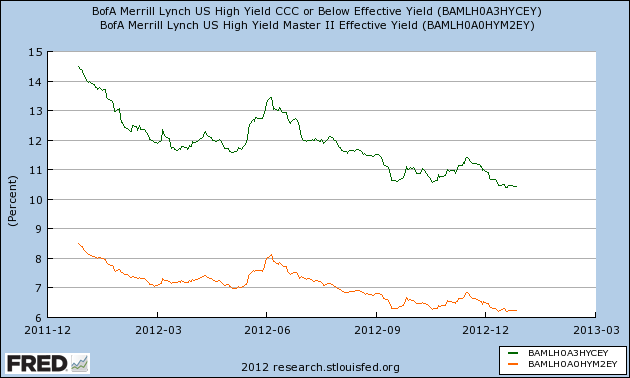
Above shows the AAA, BBB, CCC and high-yield curves from BofA.  Notice that we see strong movement in the junk, CCC and BBB yields, which is better highlighted by the following charts:


The high-yield market came in by about 350 basis points and the CCC came in by about 275 basis points.


The BBB market came in by about 90-100 basis points.

Investors are obviously looking for yield right now.  Capital appreciation is a secondary consideration.

Let's look at the corporate market by breaking it down into maturities:


The top chart shows the yield of the shorter BofA corporate credit indexes (1-3 years, 3-5 years, 5-7 years and 7-10 years), while the lower chart shows the longer corporate indexes (10-15 years and 15 plus years).  Notice the entire corporate yield curse has come in over the last year.  On the top chart, various curves have come in between 100 and and 150 basis points.  On the lower chart, yields have come in between 60 and 100 basis points over the last year.

Let's tie all of this information together.

1.) The equity market is at a key technical area.  It has rallied to this point from its 2009 low on three rallies, each of decreasing strength.  Prices have stalled at the 140 level for the last four months.  This is occurring against a weakening momentum picture.

2.) Instead of moving into equities, investors have plowed money into bonds -- both treasury and corporate.  This has led to a lowering of the yield curve across the spectrum.

3.) The fundamental background is weak.  Although it's expanding, the economy is very sensitive to shocks.  Additionally, we now have a debt ceiling negotiation to deal with, which will be contentious, ugly and probably won't solve any problems.

4.) Internationally, we see a great deal of weakness as well.  The only bright spot is a recent rally in the Chinese market.

In short, there is little to think the equity markets can rally strongly at this point, save for a "China will save us all" rally.


Monday, December 31, 2012

Happy New Year!


- by New Deal democrat

At the turning of the calendar, it's time to celebrate the circle of lif.... er, the living dead! . . .


BWA-HAH-HA-HA-HA! from the Nerds of the Living Dead.

See you next year.

An evaluation: looking back at my 2012 forecast


- by New Deal democrat

Back in January i published my 2012 forecast in which I relied upon "The K.I.S.S. method":
Since I'm not a highly paid Wall Street pundit, I simply rely upon the LEI for the short term, and the yield curve for the longer term with the caveat of watching out for deflation. The simple fact is, with one exception, if real M1, and real M2 (less 2.5%), are positive, and the yield curve 12 months ago was positive, the economy has always been in expansion.

The simplest forecast, therefore, is that since the LEI were positive all during 2011, and since both M1 and M2 are positive ... and since the yield curve did not invert at any point in the last year, so long as we don't fall into deflation we should have growth all through 2012.

.... [Further,] all of ECRI's long leading indicators have turned up since last spring, with real M2 and the DJBA making new all time highs....

This, plus the positive yield curve, tells me that for the second half of 2012, the indicators are really in agreement -- there will be growth.

So what do the shorter leading indicators say about the first half of 2012?

.... Ultimately the question as to whether the trend is slightly positive or slightly negative in the first part of 2012 becomes whether housing will show enough actual strength, and whether the Oil choke collar will weaken sufficiently, to support US growth if manufacturing and exports falter.... [M]y best judgment is that we will avoid recession, but that at least one quarter of negative GDP, with the likelihood greater in this quarter than the second quarter, can't be ruled out.
At midyear I updated the forecast, describing it as one falling between Scylla and Charibdid:
I really set myself up for failure in January with my forecast for this year of weakness in the first half,  most likely in the first quarter and probably as bad as 2006 but not quite as bad as the recession of 2001, followed by strength in the second half.  That's a really narrow passage to navigate!

....
Initial strength has been followed by progressive weakness that started with a poor March payrolls report.  I'm still expecting the weakness to end this summer sometime, partly because 
  •   (1) the long leading indicators of housing permits and starts, interest rates, and money supply all turned positive by the second quarter of last year and have continued to be positive.  ...

  •  (2) gasoline prices hit their seasonal peak at about the same level as last year, and have already backed off over 10%, putting more money in consumers' pockets, and

  • (3)  past patterns of inflation and deflation suggest that when YoY price deflation is at its worst, that is when the economy is at its slowest, improving thereafter.... [T]he YoY [inflation] comparison is going to start turn positive by about September, and based on past patterns that means the weakness bottoming out some time this summer, and stronger growth resuming thereafter
Looking back, it appears I was right on the trajectory but wrong on the timing. Judging by the 4 coincident indicators of sales, production, income, and jobs, weakness did begin by the end of the first quarter and continue thereafter, but instead of the economy re-accelerating in the second half, it was late summer and early autumn that waw the weakest numbers. Here's the graph of these four coincident indicators through 2012:


Indeed by early autumn the numbers were indeed worse than 2006 but not quite so bad as 2001, prompting ECRI to see a recession having begun. Three of the four number did make new highs again in November, suggesting that we did indeed avoid recession and a re-acceleration of growth may have begun.

The complete stall in the above numbers in August-October probably has a lot to do with the fact that, instead of declining through that season as it usually does, per my second point above, instead gas prices zoomed right back up their springtime highs again by Labor Day, only afterward declining to their 52 week lows a couple of weeks ago.

By GDP measures through the third quarter, the weak quarter was the second, but interesetingly, 2012 actually as been stronger than 2011:


Assuming the 4th quarter gives us reasonably positive GDP, that should be the final confirmation that we escaped recession again in 2012.

I can't let this year in review pass without noting one forecast that I got early and right, namely when I said in summer of 2011 that housing oruces would bottom this past spring:
[H]ousing prices have already "faced the brunt of market forces" without support for a full year, as a result of which they have been falling closer and closer to equilibrium, the rate of decline is abating, and actual real time data shows that nominal if not inflation adjusted stability may indeed be reached as soon as early next year.
Prices did indeed bottom, according to the Case-Shiller index, in March of this year. My forrecast of this bottom was months ahead of others, including Bill McBride's. Not too shabby.

All in all, while the timing may not have been impeccable (due to the unpredictable late summer gas price spike), my 2012 forecasst that steered between Scylla and Charybdis seems to have been on point.

Thanks to all you who read this stuff! I'll have a 2013 forecast sometime in the next few weeks.

Saturday, December 29, 2012

Weekly Indicators finish the year strongly edition


  - by New Deal democrat

November monthly data reported this past week was sparse, but included Case-Shiller home prices, which continued to rebound, and new home sales, which were flat. The Chicago PMI manufacturing index expanded slightly. Consumer confidence about the present increased sharply, but confidence about the future declined just as sharply, probably due to the "fiscal cliff" fiasco in Washington. This decline will be reflected as a component of the LEI.

I watch the high frequency weekly indicators because even though they are more noisy, they will signal a turn or continuation in the direction of the economy well before monthly data is reported. Even now November monthly data is still affected by Hurricane Sandy, while the weekly data is already completely unaffected.

To begin with, Employment related indicators were perhaps the most positive all year:

The Department of Labor reported that Initial jobless claims fell from 361,000 to 350,000. The four week average fell by 11,000 to 356,750. As I suggested last week, this week saw a new post-recession low in the 4 week average. Since 2 and 3 weeks ago were still slightly affected by Sandy, we could set yet more new lows in the next week or two.

The American Staffing Association Index again remained at 94. The general trend in this index is now declining slightly in comparison to last year.

The Daily Treasury Statement showed that for the first 18 days of December, $156.5 B was collected vs. $139.0 B for the first 18 days of December last year. For the last 20 days ending on Thursday, $156.5 B was collected vs. $151.0 B for the comparable period in 2011, an increase of $14.5 B or +9.7%. Tax collections have continued to increase sharply for well over a month.

Same Store Sales and Gallup consumer spending continued very positive:

The ICSC reported that same store sales for the week ending December 21 rose slightly, up +0.7% w/w and were up +3.2% YoY. Johnson Redbook showed a 2.9% YoY gain, which is a strong gain for them. The 14 day average of Gallup daily consumer spending as of December 27 was $85, compared with $77 for this week last year. Gallup's report has been running strongly positive this month.

Bond yields rose but credit spreads narrowed slightly:

Weekly BAA commercial bond yields rose +.07% this week at 4.70%. Yields on 10 year treasury bonds also rose +.11% to 1.80%. The credit spread between the two likewise decreased by .04% to 2.90%. Spreads are well off their 52 week highs.

Housing reports continue to be generally positive:

The Mortgage Bankers' Association did not report during this holiday week.

The Federal Reserve Bank's weekly H8 report of real estate loans this week rose 28 w/w to 3549. The YoY comparison, which is from the bottom, increased to +2.3%.

YoY weekly median asking house prices from 54 metropolitan areas at Housing Tracker  increased +2.6% from a year ago. YoY asking prices have been positive for over an entire year.

Money supply was almost fully positive:

M1 fell -1.9% for the week, but increased +2.5% month over month. Its YoY growth rate declined slightly to +13.2%, so Real M1 also fell to +11.4% YoY. M2 increased +0.3% for the week, and was up +1.1% month over month.  Its YoY growth rate rose to 8.1%, so Real M2 rebounded to 6.3%. The growth rate for real money supply has started to increase again in the last month.

Rail traffic rebounded and had a strongly positive week:

The American Association of Railroads  reported that total rail traffic increased for the second week in a row, up +24,900 carloads YoY, or +4.9%.   Non-intermodal rail carloads also up for the first time in many months, +2200 or +0.9%. Coal hauling was off -14,500, so ex-coal carloads were up +17,100. Negative comparisons declined to a recent low of 5.   Intermodal traffic, which had suffered due to Pacific port strikes, rebounded to +22,300 or +10.2% YoY. It is very unlikely that this rebound will be sustained at this level.

Finally, the prices of oil and gasoline rose off their seasonal bottoms, and gasoline usage also fell:

Gasoline prices rose $.01 last week to $3.26. This is equal to last year's seasonal lows and probably marks the seasonal low this year as well. Oil prices per barrel increased from $88.38 to $90.70. Gasoline usage was down for one week at 8608 M gallons vs. 8923 M a year ago, or -3.5%. The 4 week average at 8517 M vs. 8761 M one year ago, was off -2.8% YoY.

Turning now to the high frequency indicators for the global economy:

The TED spread rose sharply from 0.26 to 0.30, at the high end of its 3 month range. The one month LIBOR remained staady at 0.2097, near its 3 year low.

The Baltic Dry Index was essentially flat, drifting down 1 from 700 to 699, a 3 month low, but still within the middle of its 1 year range. Harper Peterson took a holiday break and did not report its Harpex Shipping Index this week. The longer term declining trend in shipping rates for the last 3 years is intact.

Finally, the JoC ECRI industrial commodities index rose from 124.57 to 125.64. It is now up 7.07 YoY.

There was very little weakness in the high frequency data this past week. Shipping remains weak, as does gasoline usage. There were slight increases in bank lending rates and interest rates. But almost everything else was positive or strongly positive. Layoffs set a new nearly 5 year low. Tax withholding is soaring. Housing loans and prices are positive. Consumer spending continues to be very positive. Gas prices are seasonally accomodative. Money supply is very positive. Commodity prices signal strength. This week railroad data was again quite positive.

Just as at the end of last year, the most up-to-date weekly data shows a solid positive bias, perhaps reflecting a new seasonality of autumn and winter growth, that has been balanced by spring and summer stalls. Meanwhile, the "fiscal cliff" remains a wild card.

Have a nice weekend, and best wishes for a happy and safe New Year.

Thursday, December 27, 2012

A bah, humbug consumer Christmas? not so fast


. - by New Deal democrat

Yesterday the econoblogosphere was all atwitter about a MasterCard report that consumers had only spent 0.7% more this holiday season vs. last year. This is said to be the weakest showing since the recession collapse of 2008,

But before you accept that a the final word on the subject of consumer sales at year end 2012, take a look at this screenshot of Gallup's daily consumer spending report published yesterday, covering data fron February 2008 through December 23:


The last two weeks have seen the highest amount of consumer spending since 4 years ago, and the spike last week is by far the highest since 4 years ago as well.

So, how does this square with the MasterCard result? Two reasons are likely. First of all, the MasterCard result includes all shopping since October 28, i.e., just before Sandy. Spending was depressed from then until mid-November. Second, MasterCard is reporting credit card purchases only. Gallup, by contrast, is a relatively small sample - and so more volatile - and further is a self-report of all consumer spending. So while credit card transactions may only have increased slightly, cash buying by more frugal or budget-conscious consumers may have increased more substantially.

So I'm certainly not saying that the MasterCard data is wrong. But the Gallup consumer data earned its bones during the debt ceiling debacle last year, when it accurately and in real time showed that consumers were not slowing their spending.

Bottom line: the consumer may not have been as Scrooge-ish as reported yesterday.

New low in initial jobless claims contraindicates recession


- by New Deal democrat

Initial jobless claims are generally acknowledged to be a short leading indicator for the economy. With this morning's report of 350,000 new claims being filed last week, the 4 week average fell to 356,750. This is the lowest 4 week average in nearly 5 years! In the nearly 50 year history of initial jobless claims data, there has never been a new low in initial claims set during a recession.

Back in July I took a look at the historical record. In all cases but one since records started to be kept back in the 1960s, initial jobless claims rose 10% from their lows before a recession began. The lowest increase was 5%. Once recessions have begun, the number of claims rose inexorably. The shortest period of time between the low in claims and the onset of recession was 2 1/2 months.

While we did have two weeks post-Sandy where initial claims were more than 10% above their previous post-recession low of 363,000, my calculations have shown that ex-Sandy, the four week average of new claims would only have risen into the low 370,000s range.

While initial jobless claims are only one indicator, it is unheard of for claims to be falling to new lows unless the economy is expanding, and is strong evidence against any thesis that a recession began earlier this year.

P.S.: The data for one week ago suggests that the effects of Sandy have almost completely dissipated. Combined NY and NJ claims one week ago were 9.4% of all claims filed, vs. 9.0% one year ago, and vs. 8.9% in October before Sandy struck. At worst, Sandy may have had about an impact of about 1000 claims.

P.P.S.: I'll update with a graph showing today's data once it is available. UPDATE:Here's the graph, starting in 1989 to compare the typical pattern, and showing this week's new post-recession low at the very end:

Wednesday, December 26, 2012

A last look at 2012 recession indicators


- by New Deal democrat

A recession is generally defined by the NBER as a substantial downturn in production, employment, sales, and income. Now that the November numbers are in, let's take a last look for where those numbers stand in 2012.

The St. Louis FRED site directs us to nonfarm payrolls, real personal income excluding transfer payments, industrial production, and real retail sales as defining metrics. Here's how those stand, normed to 100 as of July 2012:


As of now, 3 of the 4 metrics are still rising. Only industrial production has contracted since that time.

Another metric that is thought to be looked at by at least a few members of the NBER is aggregate hours, which measures the total hours worked in the economy. During the recession of 2008-09, about 6% of alll jobs were lost, but 10% of all hours worked. The deficit in hours worked was made up at the beginning of 2012, and the two have moved largely in tandem since:


So aggregate hours have also continued to increase.

In addition to real retail sales, another way of measuring sales is via real personal consumption expenditures, which also have continued to increase:


The preferred sales metrial cited by ECRI is real manufacturing and trade sales. This series isn't tracked by the St. Louis FRED, but blogger Doug Short has been measuring this recently to track ECRI's prediction, and here's his graph:


My conclusion is that, by most measures, the expansion has continued through November. Nevertheless it is clear that, no matter how you measure, the economy slowed markedly by March and has not picked up momentum since.

Monday, December 24, 2012

Household deleveraging continues


-by New Deal democrat

The Federal Reserve's report on household debt burdens was released last week, covering the July - September quarter. According to the bank,
The household debt service ratio (DSR) is an estimate of the ratio of debt payments to disposable personal income. Debt payments consist of the estimated required payments on outstanding mortgage and consumer debt.

The financial obligations ratio (FOR) adds automobile lease payments, rental payments on tenant-occupied property, homeowners' insurance, and property tax payments to the debt service ratio.
Both measures declined substantially, after a relative pause about a year ago for several quarters. I've combined the two measures into a single graph:


Both debt service payments (blue line) and total household onligations (red line) are now less than at any time since 1984. While in recent quarters the rate of decrease has slowed, debt service payment are now only 0.1% above their all time low.

Earlier this year CNBC reported that :
U.S. home owners are refinancing their mortgages at the fastest clip since 2005, but the difference now is they are putting cash in, not taking it out.

At the going rate, 25 percent of all first-lien U.S. mortgages will be refinanced this year, according to LPS Applied Analytics. That represents about $7.1 billion —just through June of this year — in savings on monthly payments, according to economists at Freddie Mac, who ran the numbers for this report.
This equates to about 0.6% of all retail spending per month.

I have long suspected that, before this cycle is over, households would set new all time lows for debt service. That looks very likely now. If anything, refinancing has increased in the last few months with new record lows in mortgage rates, and is probably keeping the economy from tipping back into recession.

Sunday, December 23, 2012

Weekly Indicators: new seasonal strength shows itself again edition


  - by New Deal democrat

November monthly data reported this past week included the highest number of housing permits in 4 years, and a very good report on new home sales as well. Durble goods also showed a solid increase. Personal income, spending, and savings also all rose. The Empire State manufacturing index contracted, while Philly's improved. On the other hand, consumer sentiment soured sharply, most likely in response to the "fiscal cliff" shenanigans in Washington. The Leading Indicators in November also declined -0.2, showing a complete stall over the last 6 month period. Had Sandy not impacted initial jobless claims, most likely the LEI would have risen +0.1 instead.

Once again, let me make this reminder that I watch the high frequency weekly indicators because even though they are more noisy, they will signal a turn or continuation in the direction of the economy well before monthly data is reported. In particular, right now November monthly data is still affected by Hurricane Sandy, while its affect the weekly data has almost completely abated.

To begin with, Employment related indicators were mixed but with a positive bias:

The Department of Labor reported that Initial jobless claims rose from 343,000 to 361,000. The four week average fell by 13,750 to 367,750. As of one week ago, the effects of Hurricane Sandy were still slightly affecting the weekly number. As the elevated post-Sandy numbers wash out, the 4 week average should continue to decline slightly for at least one more week. It is quite possible that we will see a new post-recession low in the 4 week average next week.

The American Staffing Association Index remained at 94. The general trend in this index is now declining slightly in comparison to last year.

The Daily Treasury Statement showed that for the first 14 days of December, $115.6 B was collected vs. $103.1 B for the first 14 days of December last year. For the last 20 days ending on Thursday, $151.0 B was collected vs. $142.3 B for the comparable period in 2011, an increase of $8.7 B or +6.1%. Tax collections have continued to increase sharply for over a month.

Same Store Sales and Gallup consumer spending continued very positive:

The ICSC reported that same store sales for the week ending December 14 declined -4.3% w/w but were up +3.5% YoY. Johnson Redbook showed a 2.4% YoY gain, which is a strong gain for them. The 14 day average of Gallup daily consumer spending as of December 20 was $83, compared with $78 for this week last year. Gallup's report has been running strongly positive this month.

Bond yields rose but credit spreads narrowed slightly:

Weekly BAA commercial bond yields rose +.06% this week at 4.63%. Yields on 10 year treasury bonds also rose +.07% to 1.69%. The credit spread between the two likewise decreased by .01% to 2.94%. Spreads have generally increased in the last month, but remain well off their 52 week highs.

Housing reports continue to be generally positive:

The Mortgage Bankers' Association reported that the seasonally adjusted Purchase Index fell -5% from the prior week, but increased 9% YoY, close to if not at a 2 year high. The Refinance Index declined 14% for the week, as mortgage rates rose.

The Federal Reserve Bank's weekly H8 report of real estate loans this week declined -2 w/w to 3521. The YoY comparison, however, increased to +1.3% and is 1.4% above its bottom.

YoY weekly median asking house prices from 54 metropolitan areas at Housing Tracker  increased +2.3% from a year ago. YoY asking prices have been positive for over an entire year.

Money supply has returned to being fully positive:

M1 rose +0.3% for the week, and also increased +3.2% month over month. Its YoY growth rate declined slightly to +13.6%. Real M1 also fell to +11.8% YoY. M2 increased +0.5% for the week, and was up +0.4% month over month.  Its YoY growth rate rose to 7.7%, so Real M2 rebounded to 5.9%. The growth rate for real money supply has started to increase again in the last few weeeks.

Rail traffic rebounded and had a strongly positive week:

The American Association of Railroads  reported that total rail traffic increased for the first time in many weeks, up +6600 carloads YoY, or +2.2%.   Non-intermodal rail carloads were again off significantly, -12,000 or -3.9%, and as usual entirely due to coal hauling, which was off -17,500. Ex-coal carloads were up +5500. Negative comparisons remained at 8.   Intermodal traffic, which had suffered due to Pacific port strikes, rebounded to +18,600 or +8.0% YoY. It is very unlikely that this rebound will be sustained at this level.

Finally, the price of oil rose off its seasonal bottom while the price of gasoline fell sharply, and gasoline usage also fell:

Gasoline prices fell $.10 last week to $3.25. This is equal to last year's seasonal lows and probably marks the seasonal low this year as well. Oil prices per barrel increased from $86.73 to $88.38. Gasoline usage was down for one week at 8610 M gallons vs. 8879 M a year ago, or -3.0%. The 4 week average at 8472 M vs. 8722 M one year ago, was off -2.9% YoY.

Turning now to the high frequency indicators for the global economy:

The TED spread fell from 0.29 to 0.26, in the middle of its 3 month range, and also in the middle of its 3 year range. The one month LIBOR rose from 0.2090 to 0.2097, near its 3 year low.

The Baltic Dry Index fell sharply again from 784 to 700, a 3 month low, but still within the middle of its 1 year range. The Harpex Shipping Index also fell 1 more to yet another new 52 week low of 352. The longer term declining trend in shipping rates for the last 3 years is intact.

Finally, the JoC ECRI industrial commodities index rose from 123.20 to 124.57. It continues to be positive YoY, up 5.76.

Most of the recent themes in the weekly data remain intact. Manufacturing is weak, as are shipping and gasoline usage. Consumer sentiment is souring. On the other hand, domestic rail ex-coal is positive and improving. Housing continues its resurgeance from a very low level. Consumer spending remains strong. Money supply is strong. Weekly employment data is generally positive, although temporary help may be flagging. Gas prices are very accomodative at the moment. Commodity prices are positive. Bank lending rates, bond rates, and credit spreads have eased slightly. This week railroad data also turned quite positive.

The "fiscal cliff" is a wild card, and the effects of Sandy remain in the monthly data. In general the most up-to-date weekly data shows a solid positive bias, perhaps reflecting the new seasonality of autumn and winter growth, balanced by spring and summer stalls. At the same time, the flat LEI should not be discounted, as it signifies a complete stall at some point next year, although a post-Sandy rebound in December data, especially jobless claims, may make for a short-lived signal.

Have a nice weekend.