Monday, January 14, 2013

Republicans Publicly Support Starting A Recession

From Politico:

House Republicans are seriously entertaining dramatic steps, including default or shutting down the government, to force President Barack Obama to finally cut spending by the end of March.

The idea of allowing the country to default by refusing to increase the debt limit is getting more widespread and serious traction among House Republicans than people realize, though GOP leaders think shutting down the government is the much more likely outcome of the spending fights this winter.

“I think it is possible that we would shut down the government to make sure President Obama understands that we’re serious,” House Republican Conference Chairwoman Cathy McMorris Rodgers of Washington state told us. “We always talk about whether or not we’re going to kick the can down the road. I think the mood is that we’ve come to the end of the road.”


Republican leadership officials, in a series of private meetings and conversations this past week, warned that the White House, much less the broader public, doesn’t understand how hard it will be to talk restive conservatives off the fiscal ledge. To the vast majority of House Republicans, it is far riskier long term to pile up new debt than it is to test the market and economic reaction of default or closing down the government.

  GOP officials said more than half of their members are prepared to allow default unless Obama agrees to dramatic cuts he has repeatedly said he opposes. Many more members, including some party leaders, are prepared to shut down the government to make their point. House Speaker John Boehner “may need a shutdown just to get it out of their system,” said a top GOP leadership adviser. “We might need to do that for member-management purposes — so they have an endgame and can show their constituents they’re fighting.”

Let's review a few basic economic concepts.

1.) The GDP equation is C+I+X+G, or consumption + investments + net exports + government spending = gross domestic product.  Using math, we can deduce that lowering the value of the elements of the equation would lead to an overall lowering of the final value.

2.) According to the IS/LM curve, lowering government spending would lower national income, thereby lowering output.  In the current slow growth environment, a recession is the most likely outcome.

3.) The entire world uses the US Treasury market for several vitally important functions such as liquidity (supplying bonds which are used for every transaction imaginable) and a riskless hypothetical yield curve for financial projections.  Playing with with that concept would at minimum provide a shock to the entire world economy.

4.) The last time this happened, S&P lowered the US' debt rating as a result of our inability to come to a political consensus.   Consider the effects an actual shutdown and second budget impasse would have.

5.) A recent paper from the IMF has provided a "mea culpa" regarding the calculation of the multipliers inherent in government spending.  In essence, the paper comes to the conclusion that government multipliers are in fact higher than  previously thought, thereby lowering or even eliminating the efficacy of austerity.  As the Financial Times noted:

Blanchard and Leigh’s latest working paper is a much more convincing document than the original WEO as Alan Beattie described in his blog last week. The new paper argues again that the fund’s 2010 growth forecasts were too optimistic in countries that planned to undertake more fiscal tightening and that the results of the WEO research stand up to scrutiny. In particular, they claim the results are not generated simply by the inclusion of Germany and Greece, which were certainly two outliers.

But it concedes that the results suggesting that fiscal austerity had a much bigger than expected effect do not apply to the 2011 forecasts. This is an important point as it suggests the result of bigger effects of austerity plans in 2010 are not general.

In conclusion, the paper says that multipliers appeared to be large at the beginning of the crisis and have either fallen since or that forecasters have learnt and become less optimistic about the effects of planned austerity since 2010. The authors argue two conclusions are warranted:
1) “it seems safe for the time being, when thinking about fiscal consolidation, to assume higher multipliers than before the crisis”
and
2) “it is worth emphasizing that deciding on the appropriate stance of fiscal policy requires much more than an assessment regarding the size of short-term fiscal multipliers. Thus, our results should not be construed as arguing for any specific fiscal policy stance in any specific country. In particular, the results do not imply that fiscal consolidation is undesirable.

To sum up the above points, government shutdown would be an unmitigated disaster, lowering GDP growth and providing a self-inflicted and unnecessary shock to an economy which may not have the inherent strength to withstand it.

Put another way, the Republicans have now demonstrated beyond a shadow of a doubt that they are bat shit insane.

Morning Market Analysis


The top chart (SPY, 30 minute time frame), shows that after the big move higher at the beginning of the year, prices have meandered higher.  There is support around the 145-145.5 level.  The lower chart (SPY, daily time frame) shows that the daily action has been printing small candles on declining volume.  While prices have advanced through technical resistance, there really isn't any meaningful rally since.


Since the start of the year, oil prices have have been inching higher, slowly approaching the 38.2% Fib level.  Prices are now about the 200 day EMA, with the 10 and 20 day EMA crossing over the 200 day EMA.  While the CMR is giving a very strong buy signal, the MACD is approaching a sell signal.


The daily chart of the Russian market (top chart) shows that prices have been rallying since mid-November.  Prices have broken through the 200 day EMA and are now just below 6-month highs.  The lower chart (weekly time frame) shows that prices are right at year long consolidation range between ~24 and 30.


The yen has dropped a little over 12.5% since the end of last summer.  Also note the severity of the sell-off; traders continue to dump the currency.


Morning Market Analysis; Is Asia Rising?

The Australian ETF spent about nine months trading between the 19 and 23 price level.  Prices broke through upside resistance at the end of the summer and have been rallying since.  They are now near multi-year highs.  Also notice the strong EMA, MACD and CMF reading, supporting the idea for a continued move higher.

 
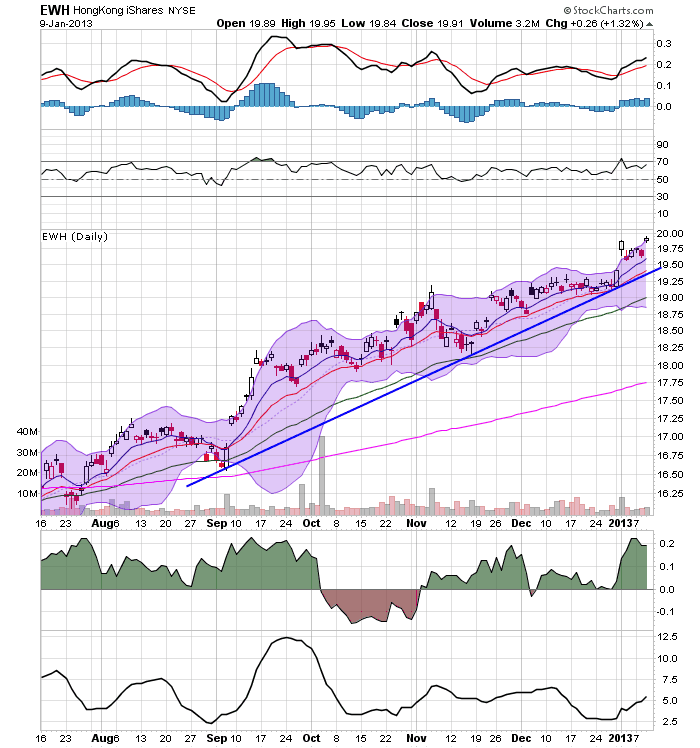
The Hong Kong market spent about a year consolidating in a symmetrical triangle pattern.  But starting in May, the market started to rally, moving through the upper triangle band at the beginning of the summer.  Prices have continued their rally and are now at multi year highs.  Also note the strong supporting technical readings from the MACD, CMF and EMAs.


The Malaysian market spent about a year and a half forming a rising triangle pattern.  Prices tried to break through resistance at the end of last summer, but couldn't quite keep up the momentum.  But over the last few weeks, we see a strong move higher.  Unlike the examples above, the underlying technicals aren't as strong on this chart.  The MACD is flat.  But we do have a decent reading from the CMF and EMAs.


The Singapore ETF is in the middle of an upward sloping channel, with prices near multi-year highs.  Like the Malaysian market, the MACD reading is a bit weak, but we do see a good reading from the CMF and EMAs. 


The Taiwanese ETF spent about a year consolidating in a symmetrical triangle pattern.  Prices broke through upside resistance at the end of last summer and have continued to move higher.  The MACD reading could be stronger, but there is also positive support from the EMAs and CMF.


The South Korean market also spent a year consolidating in a triangle pattern.  But, like the Taiwanese market, prices broke through resistance early last fall and have continued to move higher since. 


Saturday, January 12, 2013

Weekly indicators: consumers on track, rail loads derailed edition


- by New Deal democrat

There was little in the way of monthly data for December this week. Consumer confidence increased. Import and export prices decreased. The trade balance worsened. None of these are particularly big numbers.

So let's turn to the high frequency weekly indicators:

Housing metrics

Housing prices
  • YoY this week. +2.4%
Housing prices bottomed at the end of November 2011 on Housing Tracker, and have averaged an increase of +2.0% to +2.5% YoY for the last year.

Real estate loans, from the FRB H8 report:
  • +0.2% w.w

  •  +2.3% YoY

  • +2.9% from its bottom
Loans turned up at the end of 2011 and have recently shown more strength.
Mortgage applications
  • +13% w/w purchase applications

  • -8% YoY purchase applications

  • +12% w/w refinance applications
Purchase applications have been going sideways for 2 years. Refinancing applications were very high for most of last year with record low mortgage rates, but with the recent increase in rates, these have declined substantially in the last month or so, despite the increase shown this week.

Interest rates and credit spreads
  • +0.10%% to 4.71% BAA corporate bonds

  • +0.11% to 1.87% 10 year treasury bonds

  • -.01% to 2.84% credit spread between corporates and treasuries
Interest rates have risen in recent weeks, but spreads have declined again and are close to 52 week lows.

Money supply
M1
  • -0.8%% w/w

  • +1.5% m/m

  • +11.0% YoY Real M1

M2
  • +0.7% w/w

  • +1.8% m/m

  • +6.6% YoY Real M2
Both Real M1 and Real M2 remain strongly positive, with M2 in particular improving in the last several months.

Consumer spending
  • ICSC -4.2% w/w +4.2% YoY

  • Johnson Redbook +2.1% YoY

  • Gallup daily consumer spending 14 day average $83 up $15 YoY
This week is close to if not at a 1 year high YoY increase for the ICSC index. Anything over 2% has been better than usual for Johnson Redbook in the last year. Gallup remains the real star, with spending up sharply compared with January last year, and remaining close to holiday season levels.

Oil prices and usage
  •  Oil $93.56 up $0.47 w/w

  •   gas $3.30 flat w/w

  • Usage 4 week average YoY -2.3%
Gas prices are seasonally low. Usage continues to run negative YoY as it has for most of the last year plus.

Employment metrics
Initial jobless claims
  •   371,000 down 1,000

  •   4 week average 365,750 up 5,750
American Staffing Association Index
  • down 5 to 89 w/w
Daily Treasury Statement tax withholding
  •  $183.9 B (adjusted for 2013 tax changes) vs. $171.8 B +7.0% YoY last 20 days

  •  $66.9 B (unadjusted) vs. $69.1 B down -2.2 B 1st 7 days of January monthly YoY
The decline in the ASA Index is normal after Christmas, although in the second half of 2012 the index's performance compared with 2011 declined significantly, although the absolute index was higher. Initial claims have jumped back into their 10 month sidways range. Tax withholding, even adjusted for the increase in the payroll tax, remains very strong.

Transport

Railroad transport
  •  -33,200 or -12.1% carloads YoY

  • -24,800 or -19% carloads ex-coal

  • -15,600 or -8.0% intermodal units

  • -39,800 or -9% YoY total loads

  • 16 of 20 types of carloads down YoY, 1 less than last week
Shipping transport
  • Harpex up 4 at 356

  • Baltic Dry Index up 54 to 760
Rail transport, after being extremely positive YoY 2 weeks ago, has been extemely negative YoY since. It is something that will have to be watched closely.

Bank lending rates
  • 0.24 TED spread flat w/w

  • 0.2057 LIBOR down .002 w/w
The TED spread is near its 52 week low. LIBOR is at a new 52 week low and is close to a 3 year low.

JoC ECRI Commodity prices
  • up 0.98 to 127.05 w/w

  • +4.13 YoY
The most striking data in the last couple of weeks has been the steep and sudden YoY decline in railroad carloads. That being said, there have been some wild swings at this time of year due to haphazard winter weather in the past, and that may be part of the reason for the big YoY differences. Very little else was negative. Gasoline usage continues to be negative YoY, and interest rates have risen slightly.

On the other hand, consumer spending, especially as measured by Gallup, remains quite strong. Money supply, interest rate spreads, and bank lending rates are also very positive. Tax withholding is strong. Gas prices remain accomodative. House prices and loans are positive, although purchases and refinancings of mortgages are mixed this week. Shipping rates are up slightly.

I am most interested in when or whether the 2% increase in withholding tax rates will have an effect on consumers, although I wouldn't have expected it to show up yet.

Have a nice weekend.

Friday, January 11, 2013

Have a Good Weekend

I'll be back on Monday.  NDD will be here tomorrow with the weekly indicators.

I'll have dog pictures next week.

Have a good weekend.


The Underlying Improvement in EU Funding But the Lack Of Transmission Thereof

From Draghi's press conference:

Following our non-standard monetary policy measures and action by other policy-makers, a broadly based strengthening in the deposit base of MFIs* in a number of stressed countries was observed. This allowed several MFIs to reduce further their reliance on Eurosystem funding and helped to reduce segmentation in financial markets. M3 growth was also supported by an inflow of capital into the euro area, as reflected in the strong increase in the net external asset position of MFIs. 

*MFI = Major Financial Institution

Draghi'a primary assumption in the above statement is that when banks rely on the central bank for the primary source of their overall funding there is an inherent problem in the system.  The reason is that depositors have withdrawn their money from the banks and placed these funds elsewhere, which indicates a deteriorating confidence in the financial sector.  Conversely, when depositors begin placing their deposits back in banks it indicates more confidence in the financial system and, hence, a better underlying situation.

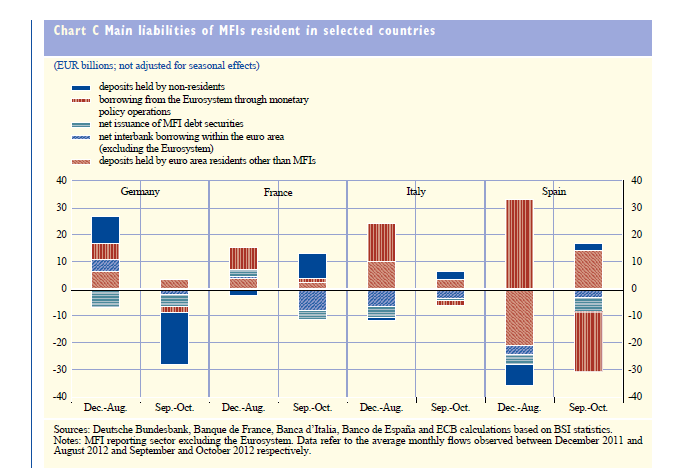
With that in mind, consider the following chart from the latest monthly ECB bulletin:


As the report notes:

The improvement in banks’ funding situation is also reflected in positive flows for domestic and non-resident deposits in France, Italy and Spain (see Chart C). Meanwhile, German banks have seen a decline in deposits held by non-residents, suggesting some moderate rebalancing of portfolios by international investors. Consequently, German banks reduced their claims on the Eurosystem in September and October, while banks in other countries (especially Spain) have
reduced their borrowing from the Eurosystem. The results of the October 2012 bank lending survey also show that banks’ access to retail funding improved in the third quarter of 2012.1 Overall, these developments suggest that the degree of financial fragmentation in the euro area may be declining. That can also be seen in the stabilisation of TARGET2 balances since mid-2012.


At the same time, the improvement in funding -- and low cost of capital -- is not being transmitted to the private sector:


Notice the negative credit growth in the system for both the second and third quarter of 2012. 

Morning Market Analysis


The entire weekly corporate bond market has broken trend.  The short market (top chart, weekly time frame) broke trend in December and is now right at the 20 week EMA.  The MACD is weakening and the CMF has a negative reading.  The intermediate market (middle chart, weekly time frame) broke trend in December as well, but has been moving sideways since.  Prices are also right at the 10 week EMA.  Finally, the long term chart (bottom chart, weekly time frame) broke trend lase week.  Now prices are also right at the 10 week EMA with a declining MACD.

None of these markets is showing signs of imminent collapse.  However, breaking any trend that is in place for more than a year is a very important development to keep in mind.


The chart shows the weekly Swiss franc chart.  The spike and subsequent sell off in 2011 occurred after the Swiss central bank stated they would do whatever it takes to prevent the franc from rallying.  After the intervention, the market sold-off sharply.  The currency remained in a downward sloping channel for nearly a year, until it broke trend in September of last year.  However, notice how little appreciation the currency has seen since breaking trend. 


The daily Indian chart (top chart) shows a remarkably hard to characterize market.  Prices had an upward trend until October, then fell back to the 200 day EMA in October, only to rally to the 61 price again.  The weekly chart shows that the market is right at the top end of a year long consolidation range, with the lower 60s area providing upside resistance.


Thursday, January 10, 2013

Industrial Production And Real GDP Growth

I spend a lot of time talking about and analyzing manufacturing data for both the US and other countries.  There are also tons of US manufacturing indicators but (oddly) only one  macro level services index (the ISM services index).  In addition, industrial production is a key metric used by the NBER to date recessions.  But manufacturing is a small part of the US economy.  So, why all this focus on manufacturing?

Because it's a really good coincident indicator.  Let's look at industrial production (the most visible manifestation of manufacturing activity and also a stat for which we have a long series of historical data) and compare it to GDP.  The data series below have been normalized so that both real GDP and IP are based on 100.  I've also made the IP data quarterly by summing the monthly data.


The above chart shows the relationship between industrial production and real GDP.  While correlation does not equal causation, these two data series have a similar trajectory for most of the other's existence.


The above three scatter plots show the relationship between the year over year percentage change in industrial production with the year over year percentage change in real GDP.  As above, the IP information was placed into quarters by summing each three month series and both data series were "normalized."

As with the first chart, notice the clear positive relationship between industrial production and real GDP; when IP increases, do does GDP while the reverse is also true.


A question for platinum coin supporters


- by New Deal democrat

Let's assume that Treasury minting a $1 trillion platinum coin is legal.

Now let's fast-forward to the year 2017. Another GOPer with the last name of Bush is President. The democratic Congress is blocking his plan to lower the tax rates on all earnings over $1 million to 5 percent. So he has the Treasury mint 1 million $1 million platinum coins and starts handing them out to his friends, cronies, and supporters.

It seems to me that would have to be equally legal.

In other words, this might be a classic case of "be careful what you wish for." Am I wrong?

Morning Market Analysis


The Chinese market has been on a role, rising nearly 17% in December.  Notice the steepness of the rally and the 3-4 different consolidation areas during the rally.  Prices are now above the 200 day EMA with rising shorter EMAs.  At some point, I would expect prices to pull back, if only for traders to take some profits.


The weekly chart shows that prices have moved through resistance established in early 2012.  Prices are now about all the shorter weekly EMAs (the 10, 20 and 50 week), with a fair amount of room to run up to the 200 week EMA. 


Both the Singapore (top chart, daily time frame) and Malaysian market (bottom chart, daily time frame) have risen strongly over the last two months.  Both have moved through important resistance levels and are now consolidating their gains.  As they are tied into the Chinese economy in a big way, these markets should rise in concert with China's markets.


The Hong Kong market is in the middle of good, six month rally.  This one is far less steep than the Chinese rally, which is good as it tells us that traders have been allowing for more consolidation on the move up.  Also not the bullish orientation of the EMAs -- all are moving higher and the shorter are above the longer. 


The weekly Brazilian market shows that prices are still bear multi year lows.  While there was a small rally in December, prices are still contained by levels established in the fall of last year.  The MACD is still negative as well.  However, money is flowing into the market and prices are strengthening.  A move through the 50 week EMA could lead to a strong rally as there isn't much meaningful upside resistance (aside from Fibonacci levels, the meaningful resistance levels are over a year old).


Wednesday, January 9, 2013

Why Is Europe Rallying? Or, The Power Of Central Bank Jawboning

Consider the following charts of European ETFs:


Both the Italian (top chart, weekly time frame) and Spanish (bottom chart, weekly time frame) ETFs have formed an upside down head and shoulders formation.  We see rising momentum in both charts.  The Italian market is right below the 200 week EMA while the Spanish market is right at the 200 week EMA.  All of the shorter EMAs are rising and are bullishly aligned.  Both markets are also right at important technical support levels.


The French ETF was trading between the 17/18 level and the 22 level for most of the last year.  However, prices also staged a rally starting at the end of last summer and are now above the 200 day EMA.  We also see a rising momentum reading and decent CMF.


The German market has now rallied through the 61.8% Fib level established from the 2011 sell off.  Prices are above the 200 week EMA, and the shorter EMAs are rising.  The CMF is very strong, while the MACD is rising moderately.

And yet, when we look at the fundamentals of the region, we see a recession.  As I wrote in mid-December regarding overall GDP growth:

1.) The EU 17 has been contracting for three straight quarters.
2.) The EU 27 has bee contracting for two straight quarters.

In other words, the entire continent can be described as in a recession according to one of the standard definitions of recession (two straight quarters of contraction).

Also note the following.

1.) Three countries have been contracting for two straight quarters: Belgium, Denmark and Finland

2.) Four countries have been contracting for three quarters: Czech Republic, Spain, UK and Hungary

3.) Six countries have been contracting for at least four quarters: Italy, Greece, Cyprus, Portugal, Netherlands and Slovenia.

That means that of 27 countries in the EU 27, a little under half are in a technical recession.


And yesterday we learned that unemployment has increased: 

Eurozone unemployment hit a fresh record of 11.8 per cent in November, official statistics showed on Tuesday, highlighting the dire state of the bloc’s economy in spite of hopes for a gradual recovery this year.

Across all 27 members of the EU, more than 26m people were out of work in November, or 10.7 per cent of the workforce, according to Eurostat, the EU’s statistical office. The seasonally adjusted unemployment rates for both the eurozone and the wider EU jumped significantly from a year earlier, when they were 10.6 per cent and 10 per cent, respectively.

So -- despite this terrible economic record, why are we seeing strength in the EU markets?  There are several reasons.

1.) Equity markets are a leading indicator: traders are betting on future growth.  They saw the bottom last summer and started buying when shares were cheap.

2.) Belief that strength in the US will help to pull the EU out of recession.  When the US reached the fiscal cliff deal worldwide markets moved higher.  Europe was no exception.

3.) Cheap money and minimal return on safe assets.  Consider this chart from Ed Yardeni's blog:

French and German bonds are offering investors nothing in terms of return after considering inflation.  Buying those assets would lead to a return of capital not a return on capital.  As such, people looking for return are forced into the equity markets to obtain that return.

4.) The Draghi Speech on July 26, when he made this statement:

When people talk about the fragility of the euro and the increasing fragility of the euro, and perhaps the crisis of the euro, very often non-euro area member states or leaders, underestimate the amount of political capital that is being invested in the euro.

And so we view this, and I do not think we are unbiased observers, we think the euro is irreversible. And it’s not an empty word now, because I preceded saying exactly what actions have been made, are being made to make it irreversible.

But there is another message I want to tell you.

Within our mandate, the ECB is ready to do whatever it takes to preserve the euro. And believe me, it will be enough.

Notice that all of the markets noted above started rallying at the end of July/early August time period, when the above statement was made.  Also note in the chart from Dr. Ed that yield on the more speculative EU credits started to drop around the same time.

It's important to remember the markets have not meaningfully tested the Draghi  statements yet.  They are simply relying on his good faith to follow through on his promises.  There is also the assumption that programs put in place will be enough to avert a continent wide disaster if implemented.  I'm not stating they are not -- just that they are untested as of now.


Morning Market Analysis


The wheat market has fallen sharply over the last month or so, moving through the 200 day EMA.  The shorter EMAs are following suit, with the 10 and 20 already far through the 200 and the 50 about to follow.

Soybeans are also in a bear market -- at least by the standard metric of prices being below the 200 day EMA.  In mid-November, prices fell to levels established in late March, rallied through the 200 day EMA, buy quickly fell again.  The shorter EMAs are now through the 200 day EMA and the 50 is about to follow suit.


The corn market has just moved through the 200 day EMA and is still a bit above the levels it established in the spring of last year.  However, is is clearly in a downward sloping trend with the shorter EMAs moving through the longer.


The Australian market is still in a multi-month run.  Prices are above the 200 day EMA, and all the shorter EMAs above the 200 and rising as well.  The market has paused several times to consolidate gains (see the recent sideways move from mid December to the end of December and the recent downward sloping pennant pattern). 


The top chart shows the daily transports, which have been in a rally since the middle of November.  This has been a sharp rally, printing a strong bar on the weekly chart (see lower chart).  While both charts have a positive momentum picture and rising EMAs, the weekly chart has a negative CMF reading. 


Tuesday, January 8, 2013

Housing Inventory Continues to Drop

In my 2013 economic prediction, made the following observation about housing:

Housing will continue to rebound.  Inventory of both new and existing homes are both at far more realistic levels and the Fed is driving down interest rates with its MBS program.  Housing affordability is at levels not seen in a very long time and builder confidence is rising.  Put all of these factors together and it appears that housing should remain on the comeback trail for most of next year.

CR published the following graph of total housing inventory earlier today:


Notice that it's taken between 5-6 years for the economy to get here.  That's a tremendously long adjustment process during which the economy has suffered a tremendous amount of pain.


2013 forecast: housing and refinancing vs. Oil and austerity, part 2


- by New Deal democrat

In the first part of my 2013 forecast, I said that the short leading indicators point to the economy shambling along and just avoiding recession in the first half of 2013, but that the monkey wrench of the 2% payroll tax hike just enacted is likely to tip that into contraction unless a new refinancing opportunity via even lower interest rates bails out consumers again.

Since the LEI and the short leading indicators don't help us see the second half of the year, we have to turn to the long leading indicators - those measures of the economy which almost always turn 12 months or more before the economy as a whole does.

The second half of 2013 shuold feature renewed, or stronger, growth

Fortunately, these are almost all in agreement in suggesting improved growth. It may be growth from a new bottom due to contractionary fiscal policy, but if Washington can manage to keep its hands off the economy by not enacting any more austerity measures (yeah, I know, and pigs can fly), it should be renewed growth nevertheless.

First of all, let's at a graph of the yield curve (blue) and Real M2 minus 2.5% (red):


As I said at the beginning of this forecast, unless we expect actual deflatioin, a positive yield curve and postive Real M2 of greater than +2.5% reliably signal economic expansion 12 months later. Although low wage growth is a real longer-term concern, the only thing that I can foresee that would lead to actual deflation in 2013 is if there were to be a 2008-style gas price spike, say, to $5 or more. Since that doesn't look very likely, actual deflation is not likely, and the K.I.S.S. signal of a positive yield curve and positive M2 suggest that the economy continues to grow throughout 2013.

While Prof. Moore did not use the yield curve as a component of his long leading index, he did make use of Real M2. Let's look at the other components. Here are housing permits:


Permits have risen sharply from their bottom over the last nearly 2 years. We've never had a recession with permits rising like this.

Next, here are corporate bond yields (inverted). A decrease in corporate bond yields is good:


Corporate bond yields have kept hitting new lows. This also signals continued expansion.

Next, here are corporate profits after taxes (log scale). These have also continued to rise as of the latest data, from the 3rd quarter of 2012:


In summary, all of Professor Moore's long leading indicators have been improving throughout 2012, suggesting continued growth throughout 2013.

Finally, let's look at a long leading indicator I found several years ago -- the real personal savings rate. This is a proxy for how comfortable consumers feel spending money. When it declines more than 5%, that is an indicator that consumers are more fearful and feel the need to save more, and has frequently been a harbinger of recession about a year or so later. The end of the recession has generally been signaled by a rise of 2.5% in the real savings rate, as consumers loosen the purse strings somewhat. Here the indicator is more ambiguous:


This indicator did indeed decline by more than 5% between 2010 and the end of 2011, but only briefly, and rose more than 2.5% during 2012, before declinng slightly again. If anything, it suggests a mild contraction right about now followed by improvement.

Taken together, the long leading indicators all appear to suggest more growth in 2013, especially as the year progresses.

In conclusion, this first year of a presidential term, like other such years, looks most vulnerable to at least a technical recession. Increasing gas prices, an apparent seasonal distortion in the statistics since 2008, and the immediate loss of 2.0% of disposable income due to the payroll tax increase make spring of this year especially likely to see actual contraction.

But the resurgeance of the housing market, and the continuing accomodation in interest rates and moentary policy, look like they will come to the rescue again later in the year, provided Washington can avoid burdening the consumer with further austerity measures taking effect this year.

Morning Market Analysis; Japan Post Election

Over the last month or so, Japan has elected a new government.  Now that a sufficient amount of time has passed, let's take a look at the effect on several Japanese asset classes.


The top chart shows the Japanese ETF, which was consolidating between the 8.7 and 9.4 level.  However, prices have now moved through support at the 9.4 level and advanced a little over 6% to just shy of the 10 level.  All of the underlying technicals are now bullish.  The lower chart -- which is in a weekly time frame -- shows that prices were consolidating in a downward sloping triangle pattern for approximately a year.  However, prices have now moved through upside support as well, with an accompanying increase in the CMF and a rising MACD.


The top chart of the yen shows that prices have dropping about 9%, falling from the 122 level to the 121.  The move lower has been consistently lower, with no relief rally at this point.  The lower chart shows the yen weekly, which also slows that the sell-off has been occurring for about two months.  There has been an uptick in the weekly volume charts and most importantly an increase in volatility as evidenced by the increased Bollinger Band width.