Friday, April 17, 2015

CPI: there is still no inflation, and real wage growth has stopped


 - by New Deal democrat

This inflation report this morning concluded 4 data series that size up where we are at our current crossroads.  

Industrial production tanked, as expected.  Housing (of which I'll write more later) was a mixed bag:  the more forward-looking and less volatile permits, as revised, tied their post-recession high in February but fell back, in a normally variable range, in March.  Starts, which were severely impacted by the weather especially in the Northeast during February, only came back partway, as the Western region took a dive (Oil patch weakness?).

As to inflation, the primary takeaway I heard from the talking heads was "OMG! OMG! Core CPI ticked up .1% to 1.8%, thus moving closer to the Fed's 2% ceiling, oops, I mean target."

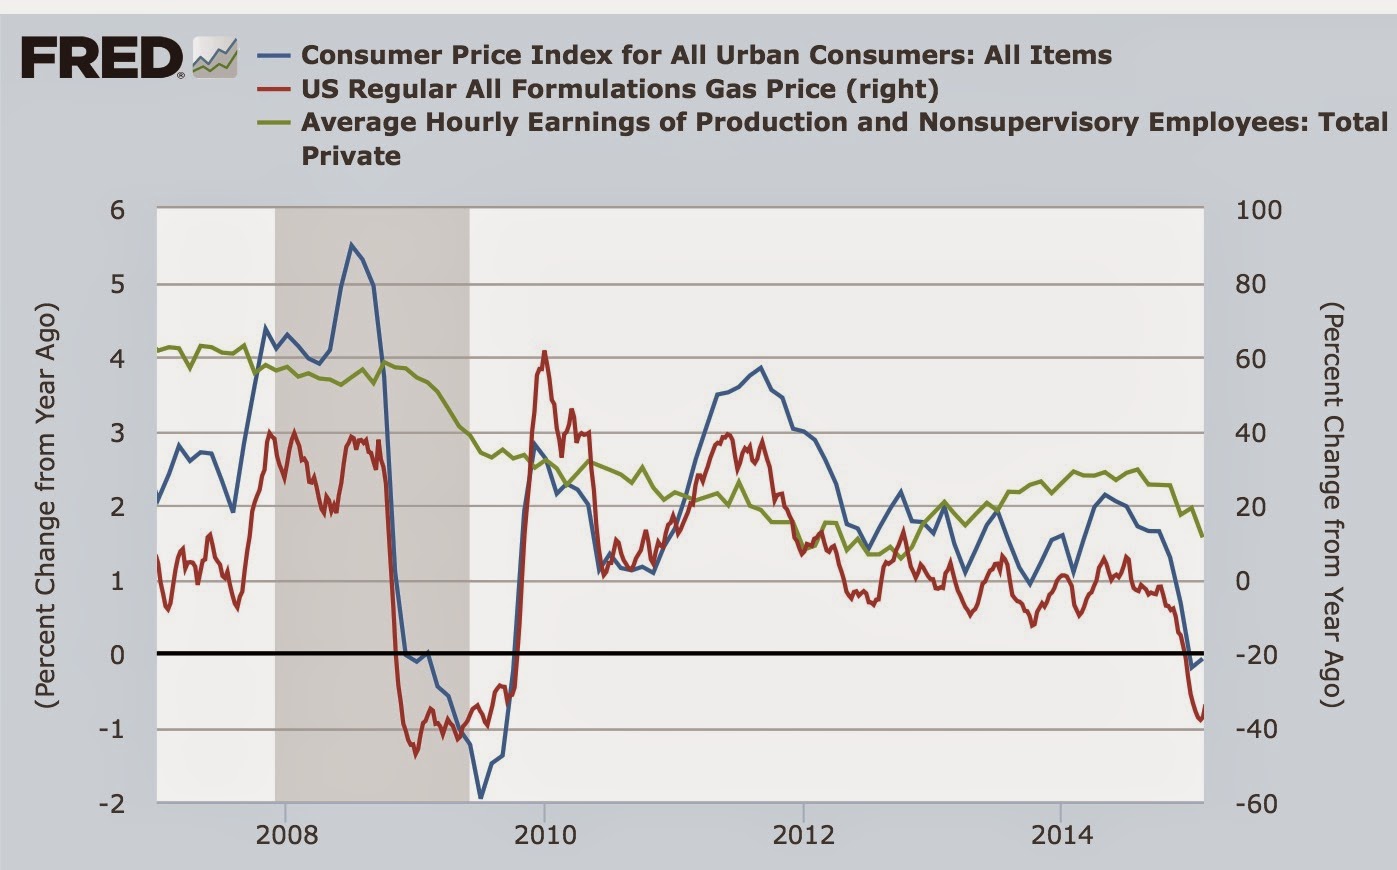
But the fact is that headline CPI is still just a skosh negative YoY:


The tame CPI number means that real retail sales for March took back almost all February's weakness, although they are still below their November peak:


They also mean that real wages declined slightly more in March from their January peak:


There has been a lot of pushback against the Fed raising rates in June, most recently from former Fed vice-chair Alan Blinder, mainly due to this weakness.  At this point I think we can safely assume that rate hikes are off the table in the next few months. 

Thursday, April 16, 2015

Johnson and Johnson: A Great Company In a Great Sector

This is not an invitation to buy or sell this security.  Do your own research and come to your own conclusions.  Heck, you might learn something in the process.
 
     Johnson and Johnson (JNJ) is just barely the second largest company in the health care sector.  With a market cap of $279.72, it is just below Novartis’ $272.81 total.  Pfizer and Merck come in 3rd and 4th, respectively.  JNJ recently announced an earnings beat, but also warned on growth thanks to a strong dollar.  Despite this warning, JNJ is a buy at current levels.  It has a strong balance sheet, growing revenue, positive cash flow and an attractive dividend yield (2.78%).  With an aging population, the US, Europe and Asia will provide an increasing number of customers for the company's products.   Finally, the health care sector is in the middle of a three year rally. 
 
The Health Care Sector
 
     Global health care spending is buoyed by two key factors: aging world demographics and broad insurance coverage.  In the US, 10,000 baby boomers will retire/day through 2029.  And with the uninsured level dropping, a larger percentage of the US will have access to the health care market.   Europe has universal coverage and an aging population , as does Asia.  JNJ has  international reach, allowing them to take advantage of these developments.
JNJ’s Charts
     The above factors explain why the health care ETF has been in a three-year rally:
 
The weekly XLV chart has more than doubled over the last three years, rising from a low of 33.65 in 2012 to a high of 76.01 earlier this year.  JNJ has been a strong participant in this rally:
 
The weekly chart shows a rally form 2012-2014, when the stock rose from ~56 to 1~08.  There was a period of consolidation that lasted about 6 months in 2013, when prices moved between 78-83 on the low end and 89-92 on the top end.  Prices broke the longer-term uptrend at the end of last year and have since been consolidating in a triangle pattern.  Pay particular attention to the MACD, which is nearing a buy signal. 
 
 
     JNJ’s daily chart shows the company is trading right around the 200 day EMA, near yearly lows.  But with a 2.78% yield and solid earnings history, this price level looks very attractive, which is supported by this table from Morningstar:
 
 
The company’s PE is 27% lower than the industry average, despite having better revenue and net income growth.  And their ROA is 12.4 compared to the industry’s 7.3.  Despite being one of the largest companies in their industry, JNJ is undervalued.
JNJ the Company 
    JNJ is a multi-national health care company with three divisions: consumer products (~19% of sales), pharmaceuticals (~43% of sales) and medical devices (~38% of sales).  Each segment has international exposures.  All financial information will be analyzed at the consolidated level.
     It doesn’t get much better than JNJ’s balance sheet.  With a current ratio of 2.36 and quick ratio of 1.76, they have ample liquidity.  Accounts receivable decreased from 9.5% of assets in 2010 (which is still a very low number) to 8.3% in 2014.  Inventory has increased, but that statement is deceptive: it rose from 5.2% of assets in 2010 to 6.2% in 2014.  LTD only comprises 11.53% of liabilities.  And to be on the safe side, they have 99 days of cash on hand.  While the word “bulletproof” is a bit cliché, it clearly applies here.
     Solid financials don’t end at the balance sheet.  Top line revenue has grown between 3%-6% for the last four years.  While not a gangbusters pace, it’s impressive for one of the largest health care companies in the world.  Additionally, expenses are contained.  COGs has been very stable at 30%-31% since 2011.  Operating income has been a bit more variable, coming in between 23%-28% over the same period.  And net margin has fluctuated between 14% and 21% for the last four years.  Moreover, the dividend payout ratio is a solid 47.5% while the interest coverage ratio is 39, meaning the company has more than adequate resources to pay its obligations.
     And finally, we turn to the cash flow statement, where the company has free cash flow levels between $11.4-$14.7 billion for the last four years.  This is more than adequate to fund the $7.4 billion dollar dividend from current operations. It also means they have ample financial room to maneuver should they experience any problems.
     JNJ is a well-managed company with solid overall financials, growing earnings and strong cash flow.  Thanks to the global aging of various populations, the company's customer base will grow over the next decade.  And at current levels, the company is undervalued relative to its peers.  What's not to like?


Wednesday, April 15, 2015

Industrial Production: why, if you're not already, you should be reading "Weekly Indicators"


 - by New Deal democrat

For the last month, I have been saying, based on the "Weekly Indicators" of poor rail transport and steel production, that March Industrial Production was likely to be poor.  And this morning, we found out just how poor: down -0.6%.  It is not down over -1% from its peak in November 2014.

Yesterday March retail sales were reported to have increased, also as forecast by the "Weekly Indicators" of  stable YoY comparisons in the Johnson Redbook and Gallup Daily Consumer spending.  Still, sales are the second of the 4 big coincident indicators of economic growth vs. contraction to have failed to exceed their November peaks.

But if you have been reading my "Weekly Indicator" columns over at XE.com, you already knew that.  If you haven't, well, you should.

Abenomics Report Card: C+, At Best

This is over at XE.com

Tuesday, April 14, 2015

March retail sales: good news, but still below peak


 - by New Deal democrat

I have a new post up at XE.com.  The March retail sales report, as forecast by consumer spending in the "Weekly Indicators," was positive.  But still not positive enough.

Monday, April 13, 2015

Why you should be afraid: the next recession is likely to include wage deflation


 - by New Deal democrat

Beginning 3 years ago, I identified poor wage growth  as the shortfall in the economy that worries me the most. And it still worries me, even though there has been some modest improvement.

Why? Because unless there is enough of a cushion, the next recession, whenever it comes, there is a significant danger of outright wage deflation. And as we know from the Great Depression, outright wage deflation means that payments on previously contracted debts become, in real terms, higher. This can lead to a vicious spiral of debt-deflation, whereby more and more people fall behind on debt, leading to a further economic contraction, more unemployment, and even more wage deflation, and so the cycle repeats.

So why am I particularly concerned now?  Because a decline in wage growth is a feature of virtually all recessions.  And we may start the next recession from such a low level of wage growth that the decline in wage growth turns into an absolute decline.

Here's the data.  Below is a graph of the YoY% change in average hourly wages (a mean measure) for the last 50 years (blue), and also median usual weekly earnings, a quarterly measure, since the start of the series in 1979 (red):


We are 6 years into this economic expansion. Six years into the last 3 expansions, nominal wage growth already exceeded 3% YoY, and ultimately exceeded 4%.  This time, both average and median wage growth is under 2%.  Simply put, wage growth is likely to decline by more than that whenever the next recession hits.


More specifically, with only one exception (1974), growth in average hourly wages declined substantially during each recession.  Similarly, with one exception (1991), growth in median weekly wages declined substantially during each recession as well.  Below I have broken out this data in chart form, showing the pre-recession high and recession or post-recession low in both average and median wages, as well as the net change, for each recession since the start of each series:


RecessionHigh/low Average
hourly wages
Decline average
hourly wages
High/low median
weekly income 
Decline median
weekly income

19706.9 / 5.5-1.4   ---  ---
19746.4 / 5.5-0.9   ---  ---
19808.7 / 7.1-1.79.5* / 7.1-2.4
1981-829.4 / 1.6-7.89.5 / 3.3-6.2
19914.4 / 2.3-2.15.1 / 2.6-3.9
20014.3 / 1.6-2.76.6 / 1.2-5.4
2008-094.2 / 1.3 -2.94.5 / 0.3-4.2


*Series inception: actual previous high might have been higher


As of now, the highest growth of average hourly wages YoY since 2009 has been +2.5% in August 2014.  In 3 of the 7 most recession recessions, growth in average hourly wages have declined by more than that.

Even worse, the highest growth of median weekly income since the end of the Great Recession was +2.9% in Q1 3014.  In every recession except possibly one since the inception of the series, median wages have dropped by more than 2.9%.  In other words, if the next recession has a similar footprint, median weekly income is going to go into absolute decline.

Hopefully this economic recovery continues for quite a while, and hopefully nominal wage growth improves substantially from here. But if it doesn't, or it doesn't improve enough, we are likely to cross from wage growth into wage declines in the next economic downturn, with the distinct possibility of triggering a debt-deflationary spiral.

We  barely escaped such a spiral in 2009.  Here is an article by Mike Shedlock:  Wage Deflation is starting in, from March 27, 2009, listing 14 companies that had announced wage cuts.

Are you scared now?

Saturday, April 11, 2015

Weekly Indicators for April 6 - 10 at XE.com


 - by New Deal democrat

My Weekly Indicator post is up at XE.com.

That part of the US economy most intertwined with the global economy appears to be in recession.  That part which is primarily domestic is almost universally positive.

Friday, April 10, 2015

Caterpillar Is A Buy At These Levels

This is not a solicitation to buy or sell this security.  Do your own research and come to your own conclusions.  I own this.
     According to Finviz.com, there are 14 companies in the farm and construction machinery sector.  With a $49 billion market cap, Caterpillar is the largest.  John Deere is a distant second with a total valuation of ~$29 billion.  Attesting to Cat's dominant position, the third and fourth largest companies are much smaller at $11.3 and $4.1 billion, respectively.  This industry faces a difficult international environment.  Not only is the strong dollar hurting competitiveness, the commodities super cycle is slowing, which lowers demand.  Domestically, durable goods orders have slowly decreased since mid-summer.  This challenging environment is a primary reason why most companies in this sector are trading at attractive levels.
     Here is the weekly chart, going back three years
 
The stock has fallen about 30%, moving from the 109 level in mid-2014 to its current level in the lower 80s.  There is strong technical support at these levels from several years ago.  The chart may have formed a double bottom in 1Q14.  Finally, the low reading of the MACD implies a move higher is possible. 
     Here is a table from Morningstar of the relevant valuation metrics:
 
On a PE basis, the company is slightly overvalued relative to the industry.  Supporting this is the slightly better than average return on assets and equity.  However, the company’s growth is less than the industry average.  Although the company is pretty fairly valued, its dominant industry position warrants a better than average PE.
     Caterpillar’s balance sheet shows the company is financially well managed.  Receivables decreased from 26% of assets in 2010 to 19% in 2014.  Although the receivables turnover ratio has increased from 2.77 in 2010 to 3.25 in 2014, the size of the increase is statistically meaningless.  Inventory increased from 14%/assets in 2010 to 17% in 2012, but returned to 14% over last two years.  Since 2010, inventory turnover has slightly increased, moving from 95.84 to 113.95.  However, these increases in inventory are very small and don’t detract from the company’s overall attractiveness.  The current ratio is 1.39, indicating the company has ample liquidity.  Finally, long term debt is a conservative 32% of liabilities.  With well-managed receivables and inventory accounts along with a conservative debt structure, Caterpillar’s balance sheet should appeal to any conservative investor.
     The company’s income statement, however, could be better.  The biggest problem is the two year drop in top line revenue, from $65.9 billion in 2012 to $55.1 billion in 2014.  While the COGS percentage has been stable for the last five years, there has been a 2% increase in SGA expenses, leading to a 2% drop in the net margin over the same period.  The dividend payout ratio of 44% firmly supports current dividend levels.  Perhaps most importantly, the interest coverage ratio stands at 12.79, indicating the company’s debt load is anything but a problem.
     And finally, we turn to the cash slow statement, which dividend investors should cheer.  The company has been cash flow positive for the last five years.  With the exception of 2012, the dividend was funded entirely from operations.  The company has the option of ending a stock buyback program (which totaled $4.2 billion in 2012) to protect future dividend payments if necessary.  And with operations investments steady between $1.7 and $1.9 billion for the last three years, there is little reason to think any major change in dividend policy is on the horizon.
     Given the low interest rate environment, Cat’s 3.35% dividend yield is very attractive.  Their financial condition is solid, meaning there is little reason to see a cut in the near future.  The current price level, which is near the lowest of the last three years, is attractive from a long-term investment perspective.  Adding all these factors up, Cat is a buy at these levels.   


International Economic Week in Review: Growing Concern, Edition

This is over at XE.com

This is the graph that scares me still


  - by New Deal democrat

Three years ago I ran a post entitled, "This is the graph that scares me," featuring the graph of  median wage growth, which I've updated below:


Below is an abbreviated version of what I wrote then:
----------------------
[Median wage growth] has been running at under 2% at all times since the financial collapse of 2008.

So, even if inflation runs at the very modest rate of only 2% ..., more than half of all workers fail to keep up.


You simply cannot have a durable economic expansion where most workers are consistently falling behind.


Lower mortgage rates in the last several years has enabled a huge number of consumers to refinance ... [and therefore] the average household has a lower carrying cost of debt, compared with their income, than at any point in the last 30 years.

In the past 30 years,as shown in this graph of mortgage rates, which highlights those periods where interest rates are higher than they were 3 years prior in red, once households have been able to refinance, it took at least 3 years without new lows being established, before the economy fell back into recession.


[in 2012 I continued:]


We just set new lows.

It's difficult to imagine any further round of refinancing once this one is done.  Can rates really go much lower?


If median wage growth doesn't improve soon,  there will be no escaping another recession once the effect of refinancing has run its course ....


[In the Great Recession], we managed to escape without actual wage deflation (although laid off workers may not have been able to find work at the same salary they were making previously).  I doubt we will be so lucky a second time ....

--------------------------
One year ago I updated this post, saying the graph still scared me, and pointing out that YoY growth in median wages was still paltry.

So where are we now?

Here is mortgage refinancing through last week, courtesy of Bill McBride a/k/a Calculated Risk:


Refinancing all but died in mid-2013, and except for a mini-spike at the beginning of this year, has remained asleep ever since.

Refinancing had helped households lower their debt ratios to 30+ year lows:


That deleveraging has all but stopped.

Here is an update of the graph of mortgage rates, focused on the last 5 years:


Mortgage rates bottomed in December 2012.  Eight months from now will mark 3 years since that time.

The good news is, the big decline in gas prices has meant that real median wages have increased to new highs, and most recently nominal median wages have grown at a 2.3% rate.  If gas prices remain low, and if the economic expansion continues for awhile longer, hopefully real median wages will continue to rise.

But I remain very uncomfortable with paltry nominal wage growth. And the next recession is out there somewhere. When it hits, growth in nominal wages will decline.

We entered the Great Recession with wage growth as high as 3.5%, and ended it with 1.5% nominal wage growth.  A similar decline from the current 2.3% nominal wage growth would tip us into outright wage decreases, with all of the horrors of debt-deflation that implies.  This is still what scares me.

Thursday, April 9, 2015

What's the culprit behind recent retail sales and jobs weakness?


 - by New Deal democrat


What is behind the recent slowdown in so much economic data?  Candidates include the weak global economy and the related strong dollar, the West Coast ports strike, and unusually poor winter weather, among others. The issue is important because, while winter has given way to spring, and the ports dispute has been settled, the Oil patch weakness is continuing and may even intensify.

Breaking the reports down on a state by state basis helps us determine which of the potential issues was the primary driver of the data.  To cut to the chase, it looks like Oil patch weakness is the prime ingredient in the punk March jobs report, although weather may have played a supporting role.  By contrast, weather appears to have been the primary culprit in hiring in February, and poor retail sales in January.  We will get further information on these later this month, with state-by-state breakdowns in the unemployment rate, and state revenue reports for March, which will reflect actual retail sales in February.

Ironman at Political Calculations offers supporting data that the March employment report reflected a particularly bad month in the Oil patch.  As I pointed out the other day, there was a big increase to over 300,000  during the weeks ending February 7, 21, and 28.  He shows us this graph of how much of that increase can be traced to the 9 states most impacted by fracking:


Note that the big increase starts in February, increasing to 15,000 per week. This showed up in the March employment report, which of course nets hires and fires.

Meanwhile, on Tuesday we got the JOLTS data for February.  Here is Doug Short's graph of the monthly numbers and 6 month moving averages for openings, hires, and discharges:


Note that, through February, there has been virtually no upward movement in discharges.  what has changed is that, while job openings are growing at an increased pace since early 2014, the growth in actual hires, which had accelerated even more than openings, has decelerated in the last few months.

This suggests that, through February, the Oil patch and the West Coast ports strike, which would have increased discharges, were not significant.  That conclusion is buttressed when we look at the breakdown of openings and hires broken out by job sector:


Note that openings in February increased vs. January in virtually all job sectors.  Meanwhile, hires for those openings decreased in virtually all job sectors, although the biggest percentage decrease was in construction (which is where we  would expect the Oil patch weakness to be most felt.  In other words, while Oil patch weakness played a role, the primary driver of hiring softness in February was probably the weather, since almost all job types were affected.

Finally, there is the anomalous decline in retail sales, which has happened in the face of a big increase in real personal income due to savings on gas purchases.  Thus it is hard to assign this to importing global weakness or concentrated declines in the Oil patch.

And looking at reports of state tax revenues appears to confirm that weather is the big culprit behind the recent weakness in retail sales.  Below is a chart of reports through February of sales tax revenues (recall the businesses typically pay sales tax receipts in the month after the goods or services are sold, so the February reports are primarily January sales):

StateDec
JanFeb
CA+3.8
-12.4+34.8
TX4.3
+11.2+11.7
NY+3.1
+4.2-0.3
MA+0.9
+0.5+0.2
NJ-1.6
+2.9+2.6
VA-1.0
+11.2+4.2
GA+5.2
+8.2+5.7

If the West Coast ports strike was the big culprit, California should be faring the worst.  Instead in February it reported a large YoY increase.

If the Oil patch were the primary driver, Texas should be faring poorly.  Instead Texas also reported large YoY gains in February.

But look at the northeast, especially New York.  Alone among all states, New York reported an actual YoY decline in February. New Jersey and Massachusetts also saw declines in positive comparisons between January and February, and even Virginia saw a similar decline.  Georgia was unaffected.

The slew of winter snowstorms that broke Boston's record of annual snowfall started at the end of January.  New York City, for the first time in over 100 years, shut down its subway system due to a (blown) blizzard forecast, which even at the time was estimated to cost in excess of $750 Million in revenue.

The Fed's Beige Book also points to weather as the main culprit in February.  Here are a sample of the observations:

New York District:  [some] contacts say that early 2015 sales continued the positive trajectory in place by the end of 2014, but business dropped off noticeably in late January, when the first of four (to date) significant winter storms hit. One retailer reports that over the last month, about 200 of their stores based in New England had been closed for a few days because of the severe weather

Retail sales have improved somewhat, on balance, since the last report. A major general merchandise chain indicates that sales were up strongly from a year ago and also above plan in January but slowed a bit and were on plan in the first half of February. Similarly, a major retail contact in upstate New York describes January as a solid month and February as fairly strong. In both cases, harsh winter weather was said to have hindered business somewhat. In general, retailers report that inventories are in good shape and that discounting remains prevalent.

Philadelphia: A Pennsylvania contact described sales levels throughout the state as being strong overall through mid-February despite the typically softer seasonal levels. New Jersey contacts reported strong statewide sales for January; however, weather was taking a toll on early February sales. Auto dealers expect growth to continue in 2015 as it had in 2014.

Richmond:  Retail activity slowed in the weeks since our previous report. Sales of cars and light trucks were generally flat, according to dealers in Virginia, North Carolina, and South Carolina. A dealer in the eastern panhandle of West Virginia reported slightly slower sales. Grocery and convenience stores reported a decline in food sales in in the past month. According to the manager at a Virginia chain of discount stores, holiday and post-holiday sales were softer than expected, but still higher than a year ago.

Kansas City:  Consumer spending activity was flat in January and early February, but remained higher than a year ago with solid expectations for the coming months. Retail sales declined from the previous survey but were around year-ago levels. Several retailers noted a drop in sales of luxury products, although sales of winter and lower-priced items were steady.

Dallas:  Retail sales rose during the reporting period, but the pace of growth was mixed. Demand continued to be up year over year, and a few retailers noted slight improvement in foot traffic since the last report. Two national retailers said Texas' sales performance was in line with the nation overall, while a third national retailer noted Texas was outperforming the national average. Outlooks were positive, and contacts expect modest sales growth over the next three months.

San Francisco:  Overall retail sales activity grew moderately during the reporting period....  Merchants in some areas showed very strong holiday sales and would have seen even larger volumes if not for delays receiving merchandise caused by labor disputes at West Coast ports. In other regions, holiday sales were not quite as strong as expected, and, as a result, retailers in those areas still have a little excess inventory.

The beige book shows that, with the exception of Kansas City, all of the slowing was in the Northeast and Mid-Atlantic.  Meanwhile, Texas was strong, and the only impact of the West Coast ports strike in California was a decline in inventory, not sales.

To summarize:
  • retail sales through January into February appear to have suffered primarily due to the unusually poor winter weather. 
  • hiring in February was also primarily affected by the weather, although Oil patch weakness played a contributing role.
  • jobs in March so far look like they were primarily affected by Oil patch weakness.
I will update this once we get further information by the end of this month.


Oil's Price Drop Hurting Canada

This is over at XE.com

Wednesday, April 8, 2015

Corporate profits vs. stock prices: an update


 - by New Deal democrat

I have a new post up at XE.com.  Since corporate profits are a long leading economic indicator, and the stock market is a short leading indicator, it makes sense that, contrary to common investor wisdom, stock prices follow rather than lead corporate profits.

So what does that mean now?

Tuesday, April 7, 2015

The simple reason there will not be a US downturn

 - by New Deal democrat

Houses and cars.  This post is up at XE.com.

Monday, April 6, 2015

The punk March jobs report looks primarily like an Oil patch story


 - by New Deal democrat


At first blush, the relatively poor March jobs report looks like an Oil patch story, not a weather story or a West coast port strike story.
Changes in initial jobless claims during a month have a pretty good correlation with the same/next month's jobs report (since the reference week is the one including the 13th of each month).  Here's the relevant scattergraph and regression line for this expansion:


We had 3 bad weeks in February of new jobless claims over 300,000 a month.  To find out if the weather was a big factor, or if the primary weakness was the Oil patch,  I compared TX and OK with NY and Mass, going back to the first of the year.  This can be done using the Department of Labor's state-by-state breakdown of initial jobless claims, which is reported with a one week delay.  
The result was that NY and Mass. had lower claims on average in 2015 in the reference weeks compared with the same week in 2014. TX and OK, by contrast, had about 15% more initial claims in those weeks during 2015 vs. 2014 during the reference weeks for the March report.
Oklahoma's jobless claims increased YoY starting at the end of November.  Texas turned negative YoY in late January.

Massachusetts had one week wherein 2015 claims equalled 2014 claims. All other weeks were lower. New York had two weeks in 2015 slightly higher than 2014, but the other two weeks were significantly lower than 2014. 
While the since-resolved West coast ports strike could have nationwide impacts, one state where it would surely have an impact is California.  California did have one negative YoY week of jobless claims, all the way back in early January.  It also had comparatively small decreases in jobless claims in 2015 vs. 2014 during the weeks ending January 31 and February 7. During the 4 reference weeks for the March jobs report, however, it went back to strongly positive YoY readings (i.e., steep declines in jobless claims in 2015 vs. 2014).
Tomorrow's JOLTS report will be for February, so it will give us little insight into March.  State-by-state unemployment rate changes won't get reported until the end of this month. For now, what we can say is that the relatively poor March jobs report looks primarily like an Oil patch story and only secondarily a weather story, and not a West coast ports strike story.


Saturday, April 4, 2015

Weekly Indicators for March 29 - April 2 at XE.com


 - by New Deal democrat

My Weekly Indicators post is up at XE.com.

The US appears to have "imported" a near-recession limited to production and spending for the first time in over a century, while income and employment still show a good domestic economy.

Friday, April 3, 2015

International Economic Week in Review: Highlighting Global Problem Spots, Edition

This is over at XE.com

March jobs report: the good streak is broken


- by New Deal democrat

HEADLINES:

  • 126,000 jobs added to the economy
  • U3 unemployment rate unchanged at 5.5%
With the expansion firmly established, the focus has shifted to wages and the chronic heightened unemployment.  Here's the headlines on those:

Wages and participation rates
  • Not in Labor Force, but Want a Job Now: down -169,000 from 6.538 million to 6.369 million
  • Part time for economic reasons: up 70,000 from 6.635 million to 6.605 million
  • Employment/population ratio ages 25-54: down -0.1% to 77.2% 
  • Average Weekly Earnings for Production and Nonsupervisory Personnel: up +0.2% from $20.82 to $20.86,  up +1.8%YoY (this YoY change is a bounce from last month's +1.5%). (Note: you may be reading different information about wages elsewhere. They are citing average wages for all private workers. I use wages for nonsupervisory personnel, to come closer to the situation for ordinary workers.)

January was revised down by -38,000 from 239,000 to 201,000.


The more leading numbers in the report tell us about where the economy is likely to be a few months from now. These were generally negative for the second month in a row.

  • the average manufacturing workweek declined -0.1 to 40.9 hours.  This is one of the 10 components of the LEI and so will affect it negatively.

  • construction jobs decreased by -1,000. YoY construction jobs are up 282,000 YoY.  

  • manufacturing jobs also decreased -1,000, and are up 188-,000 YoY.
  • Professional and business employment (generally higher-paying jobs) increased 40,000 and is  up  662,000 YoY.

  • temporary jobs - a leading indicator for jobs overall - increased by 11,400.

  • the number of people unemployed for 5 weeks or less - a better leading indicator than initial jobless claims - increased by 57,000 to  2,488,000, compared with December 2013's low of 2,255,000.

Other important coincident indicators help us paint a more complete picture of the present:

  • Overtime decreased by 0.1 hour from 3.4 hours to 3.3 hours

  • the index of aggregate hours worked in the economy fell -0.2 from 103.1 to 102.9.

  • The broad U-6 unemployment rate, that includes discouraged workers decreased from 11.0% to 10.9%
  • the index of aggregate payrolls rose by 0.2% to 122.1.
Other news included:
  • the alternate jobs number contained in the more volatile household survey increased by 34,000 jobs.  This represents a 2,535,000 million increase in jobs YoY vs. 3,128,000 in the establishment survey. 

  • Government jobs increased by 1,000.
  • the overall employment to population ratio for all ages 16 and above was unchanged at 59.3%,  and has risen by +0.3% YoY. The labor force participation rate declined -0.1% from 62.8% to 62.7%  and is down -0.5% YoY, and is equal to its 2014 low (remember, this includes droves of retiring Boomers).

SUMMARY:


Obviously this was a disappointing report relative to the last year of reports.  The headline numbers were positive or neutral, but most of the internal numbers declined. That there were downward revisions to the previous two months' numbers is also not something that happens in a robust expansion. Most of the leading indicators in the report also declined.

There were a few bright spots, as wage growth increased, and those not in the labor force who want a job now decreased.  But these really just reversed last month's poor numbers.

In the longer view, while this is a bad month, I do not think the expansion itself is in danger.  We are importing some of the global weakness, and the oil patch has a very focused decline, which has shown up in the initial jobless claims in the last month or two.  In fact, the most noteworthy item in the report was that there have been -11,000 job losses in areas that typically support the oil and gas industries.

If we were to see a real decline of concern, it would show up in housing and vehicle purchases.  We just got a good March report on vehicle sales, so the reports on the housing industry this month are of added importance.

Thursday, April 2, 2015

Chevron's 4% Dividend Is Safe

I own this.  This is not a solicitation to buy or sell this security.  Do your own research and come to your own conclusions.

    Oil’s recent sell-off provided one of the best buying opportunities in the energy sector since the Lehman crash.  Of course, the next logical question is, “what security?”   I started by looking at the big, multi-national oil companies.  What first attracted me to CVX was its dividend, which is currently yielding a healthy 4%.  On deeper analysis, I believe the dividend is safe, making this a very attractive company, especially at current price levels.

     Let’s start by looking at the weekly chart:
 
Prices are currently near their lowest level in the last three years and are consolidating around the 200 week EMA.  Momentum is weak but stabilizing and relative strength has upside room.  With a 4% dividend, the shares have built-in price support.  Just going by the chart, CVX is a bargain.

     Charts, however, aren’t the whole picture.  Let’s turn to CVX’s valuation by looking at this table from Morningstar:
 
CVX’s P/E is a few points below the industry average which is probably due to its revenue growth being lower than the other major’s.  Nevertheless, the company has better margins, ROA and ROE than its competitors.  Adding to the bullish case is the company has the fourth lowest PE in the industry according to the Finviz.com website.  Adding these factors together, one can arrive at the argument that the stock has at least a few points of upside potential.

     Turning to the company’s financials, CVX’s balance sheet demonstrates the company is well managed.  Accounts receivable has decreased from 11.24% of assets in 2010 to the current level of 6.29%.  Inventory levels have been consistently between 2.5% and 3%.  The current ratio is 1.32, giving the company a bit of financial flexibility.  On the other side of the balance sheet, long term debt is only 9% of liabilities.  Value investors should be impressed by the increase in book value, which rose from $105 billion in 2010 to $155 billion in 2014.  Although not bullet proof, CVX’s balance sheet is in good shape. 
     This is fortunate, because the income statement shows some weakness.  The company’s revenue fell from $254 billion in 2011 to the current level of $211 billion.  Over the same period, the cost of revenue has decreased from 66.2% to 56.4% while operating expenses have increased by the same amount.  The result is net margin has consistently been between 9%-10% for the last five years.  Management has been distributing a large minority of these earnings.  The dividend payout ratio has increased from 30% in 2011 to its current level of 41%.  This is a key reason why the current dividend is safe.  Top line revenue would have to fall by 40% before the payout ratio was challenged.  With a company of this size, a drop of that magnitude is highly unlikely. 
     Finally we have the cash flow statement.  Free cash flow (operating cash flow – investment expenses) has been positive in all but one year for the last five years.  From 2010-2102, the company added $38 billion in cash before considering investment activity; the only year of decreases saw a drop of $607 million.   
     To conclude, the company is a bit undervalued.  Its balance sheet is solid, with a well-managed short-term asset position and a reasonable amount of debt.  Although revenue has declined, it would have to drop at least 40% more to threaten the current dividend.  The company has been cash flow positive for the 4 of the last 5 years.  Finally, the 4% dividend gives the stock built-in price support.  At these levels, CVX is buy.    


Wednesday, April 1, 2015

The long leading indicators updated through Q1 2015


 - by New Deal democrat

I have a new post up at XE.com.

What do those indicators that forecast the economy more than 1 year out say now?

Tuesday, March 31, 2015

I'm Raising the Caution Flag On the US Economy

This is over at XE.com

Once more into the breach on wages and income since the Great Recession


 - by New Deal democrat


Two articles were posted elsewhere this morning discussing wages and income during this expansion.  Both have misleading aspects to a lesser or greater degree.

The first is an article by Pavlina R. Tcherneva of the Levy Economics Institute.  While I do not disagree with its overall emphasis or conclusion, I do have a significant quibble, because there is one erroneous comparison which can be misleading.

Tcherneva says:
"In the postwar period, with every subsequent expansion, a smaller and smaller share of the gains in income growth have gone to the bottom 90 percent of families. Worse, in the latest expansion, while the economy has grown and average real income has recovered from its 2008 lows, all of the growth has gone to the wealthiest 10 percent of families, and the income of the bottom 90 percent has fallen [through 2013]."
....
Consider what has happened to the incomes of the bottom 99 percent of families in the meantime. Average real income for the bottom 99 percent, which fell after the crash—from $50,400 (2007) to $47,000 (2008) —continued falling during the expansion, to $44,300 (until 2011). It finally showed a small uptick in 2012, to $44,900, but in 2013 it remained essentially flat. Thus, any “improvement” in the income distribution is not due to improvements in the well-being of the bottom 99 percent of households."

Included in the article is a graph, which is likely to see wide distribution, and which is the problem with this article:

The problem with this graph, and its description, is that it purports to measure income growth during entire expansions.  But that's not quite true, since the current expansion did not end in 2013, but is ongoing.  Thus the measure of the relative income shares of the bottom 90% vs. top 10% in prior expansions is not directly comparable. 

To be directly, comparable, Tcherneva should have measured relative income shares during the first 4 years of each expansion.  I should emphasize that, had she done so, the results would have been similar, using the Saez and Piketty tax return data, which can be found here,

Aside from technical  accuracy, I am highlighting this issue because a slightly deeper look can give us much more information.

To begin with, the Saez and Piketty numbers are based on "tax units," i.e., tax filings.  Thus it is very similar to, although not identical with, households.  Thus the data is subject to all of the same issues that we get into when we discuss median household income - e.g., distortions based on the tsunami of Boomer retirements, and the importance of the unemployment rate (since the unemployed are counted in households and tax units, but not for purposes of median or average wages.

The second is best summed up in this graph, from Doug Short, which shows the real median income of the bottom 90% from the Saez and Piketty data, for the entire last century:


Note that income first peaked in the early 1970s, and has only exceeded that peak one time, briefly, during the tech boom of the late 1990s.  Of particular interest is how long it took in each economic recovery since 1980, and also the plateauing of income in the late 1980s.

Tcherneva herself posted a graph several months ago showing what happened with the comparative incomes of the bottom 90% and top 10% from income peak to income peak:
Note that in the early 1980s, like the present, the average income of the bottom 90% actually fell -- just has it did in the present expansion through 2013.

This tells us the importance of three trends: (1) after the second Oil shock of 1979, and particularly in 1986, real gas prices fell dramatically, in contrast to the rise of gas prices from a low of $1.40 in 2009 to a high of $3.95 in 2012 and 2013; (2) household income rose dramatically in the early 1980s, despite a fall in real wages, due to the huge numbers of women entering the workforce; and (3) wage growth declines after particularly severe recessions like 1981 and 2008-09.

In short, if we want to explain Tcherneva's data, both during the current economic expansion, and over the longer term, we really don't have to look further than three things
  1. 1. the increase of gas prices post-Great Recession currently, and its volatility since 1974, 
  2. 2. the decline in labor force participation rate since 2000, and its dramatic rise in the 1970s and 1980s due to women entering the workforce in huge numbers; and 
  3. 3. the decline of labor bargaining power due to the collapse of unionization and the correlative rise of globalization. 

 The other article this morning deals with wages, and comes from the Cleveland Fed via Barry Ritholtz.

The purpose of the study was to determine what has happened with real wages during this economic expansion - are they stagnant or have they fallen?  If so, why?  
As the authors state, "This article answers the question: What fraction of recent changes in the average wage is due to changes in the occupation mix versus changes in wages within occupations?"  The answer is given in the below chart:


Interestingly, the authors find that, through 2013, the jobs added in the recession have NOT been, as commonly assumed, low wage jobs, but have actually skewed towards higher paying jobs.  They do find, however, that within occupations, real wages actually fell slightly.

My big problem with this article is in its explanation for the data. To begin with, it is not demographically normalized.  While it is always true that old fogies retire and young whippersnappers take their places at entry level incomes, this has disproportionately been the case as Millennials move into the labor force as Boomers retire.  This is likely to place some unusual downward pressure on wages.

But here is my real problem.  The authors conclude:
"Why did wages rise during the recession and fall during the recovery? It may be due to what are called “selection effects.” During recessions, firms tend to retain their most productive workers, both across and within occupations. ...
"It is also possible that wages declined more in the recovery than in the recession due to what economists call “sticky wages.” Reducing real wages is one of the ways the labor market adjusts to drops in demand for labor. ..."
You have got to be kidding me.

Wages rose during the recession because the price of gas fell was $3+ at the end of 2007 when it began and was under $2 a gallon when it ended.  Wages fell from there to 2013 because the price of gas went up to $3.95 a gallon during 2012 and 2013 (red, right scale in the graph below). This translated into actual deflation during the later stage of the recession, and 3%+ inflation during 2011 (blue, left scale), while nominal wage growth  slowly decelerated from 4% YoY to 1.5% YoY (green, left scale):


Period.  End of story.

Let me emphasize that this is not an issue of nominal vs. real wages.  The authors state, "We adjust all wages to 2013 dollars to make it easier to compare values across time. For brevity, we call the 'real average hourly wage' simply the 'average wage.'

It continues to amaze me how the huge impact of the Oil Choke Collar has been almost completely overlooked.