Tuesday, May 17, 2011

The Economic Slowdown, Part II: International Issues

About a year and a half ago (on August 31, 2009), I published an article titled The Fits and Starts Expansion. where I identified the following areas as economic drivers: consumer spending (albeit at a slower pace than the previous expansion), inventory adjustments, manufacturing, Asian consumers and stimulus spending. First, I should note that all these areas did contribute to the latest expansion in more than insignificant ways. However, we are now entering a different phase where a slower pace of growth is occurring.

International markets are now the primary driver of the world economy with the BRIC countries (especially India and China) accounting for a large amount of the overall growth. However, both these countries are facing problems in the form of higher than desired inflation:


As the charts indicate, India has had an uncomfortably high inflation rate for some time, while China's is also clearly increasing. As a result, both countries are raising interest rates:


India has been raising rates for over a year and China has started to raise rates. In addition, China is also raising reserve requirements to add further weight to the slowdown.

Brazil is also in a less than desirable position:


Their inflation rate is climbing, leading to


Rising interest rates.

As a result of increasing rates, we're seeing declining and now negative prints in the Indian and Brazilian LEIs:


And while the Chinese LEIs are still increasing, they are doing so at a lesser rate:

As a result of the above policies, the equity markets for all three of these countries (China, India and Brazil) have all stalled, as evidenced by their US ETFs:


The Indian market is actually in downtrend, with prices fluctuating above and below the 200 day EMA since the first of the year.


The Chinese ETF is using the 200 day EMA for technical support, with prices not having made a new high since late last year.


The Brazilian ETF has been moving more or less sideways since late last year.

With three of the four largest growing economies slowing, the US won't be far behind.

Monday, May 16, 2011

Treasury Tuesdays

Last week, I wrote the following about the bond market:
As I mentioned above, I would be long in this market, at the levels stated above. However, I would have very tight stops. Remember, on the flip side of bond prices are bond yields. At some point, yields get to low to justify the risk taken. Currently, the 10-year is yielding 3.17%. Eyeballing the situation, I would use 2.75% as the abject lowest the 10-year should yield in the current environment. In addition, I wouldn't be looking for massive gains from this trade, instead, thinking that a few points would probably be the pretty good.
Last week, the bond market was caught between several interesting cross currents. Despite the coming issue of the debt ceiling -- which should be bond negative -- bonds actually held steady. The reason is they are still considered a safety bid, which they caught as the risk trade (commodities) went off. In addition, concern about the EU situation contributed to the bid as well, as has weakness in the stock market.

Let's take a look at the charts:


The IEFs consolidated last week, eventually hitting the 10 day EMA and are now moving higher. The shorter EMAs are bullishly aligned (shorter above longer and all moving higher) and prices are using the EMAs as technical support. The A/D and CMF lines indicate money is moving into the market and the MACD is still giving a buy signal.


The TLT are in the same technical position as the IEFs, but with the exception of a slightly weaker price and MACD position.

My analysis of the Treasury market has not changed. The market is moving higher, but keep the stops tight. Also remember that yields are dropping, and we're getting near levels when yields shouldn't be moving much lower without a change in the fundamentals. I'd still use 2.75 on the 10 year as the absolute lowest yields can go in the current environment.

Are Financials Signaling a Lower Market

Something I will start delving into in more detail is sector analysis -- that is, breaking the various markets down into smaller components to see what those sectors tell us about the overall markets.

However, the financial sector of the market (ETF: XLF) may be telling us a weaker market lies ahead.

Financial stocks have been an interesting sector to watch as of late. For a while it was the sector to watch from 2008-2010, if financial stocks went up the market followed, Bob Paisini loved to mention the correlation. Now it seems financials are either being looked over by the market, when it can be giving a huge early warning sign that a downward movement is on the horizon.

Financials have been slowly declining throughout the last month or two, even as the market rallied. Our post on GS mentioned to watch the key $148 level, after breaking that GS fell to $141. There was a similar support level on XLF that was broken on Friday.

XLF closed below $15.87 a key support level. The support level was created in December after XLF broke out and started an uptrend to new highs. It was then a support twice during XLF's decline, providing a launch pad for the ETF. But the third time this support level failed and XLF closed at $15.77. In addition to this being a support level, the support level makes up the base of a descending triangle pattern. This is a 1.14 measured triangle and this move would put XLF around 14.77ish.

Click on the link for the full story.

The Economic Slowdown, Part I: Federal Uncertainty

Raising the Federal debt ceiling should be a political non-event, supported by the vast majority of politicians with a few vetoes for good political measure. Instead, we are treated to a veritable circus of political stupidity and posturing, with people who have absolutely no idea what constitutes an economy arguing about the debt ceiling.

As readers of this blog know, government spending is part of the GDP equation. According to the CBO, government spending accounts for a little over 20% of GDP and has for the last 40 years. Therefore, a cut in spending is by definition a cut in GDP.

But there is a deeper issue involved here, one that is regrettably difficult to quantify but one that nonetheless exists. That is uncertainty. For the last few months, we've been hearing about how Washington can't agree on either a budget or whether or not to raise the debt ceiling. The first spending issue occurred a little over a month ago as the Republicans and Democrats wrestled about whether or not to cut somewhere between $30 and $60 billion for the current years budget. The amount is unimportant; what is important is that there was extreme disagreement over a paltry amount of spending. This episode sent the entirely wrong message to the economy and the financial markets: namely, that American government barely works and may not be able to resolve the budget issue. This is without a doubt an extremely scary proposition. The U.S. is still the world's largest economy and there are important budget issues that must be resolved. The fact we're debating with such animosity about such insignificant amounts of federal spending right now indicates the bigger issue of balancing the budget may not even be possible. That is enough to halt any proposed plans.

In addition to the uncertainty created by federal gridlock, there is the increased emphasis on austerity, or cutting spending. While the government does need to get control of the budget, there is the importance question of how that is accomplished. To place this in perspective, consider the following chart that shows the percentage change in GDP from the previous quarter and how federal government spending either contributed to didn't contribute to that percentage change:


In the above chart, notice that in the last two quarters, the austerity issues at the federal level have clearly subtracted from overall growth. This again returns to the importance of understanding that government spending is variable in the GDP equation.

The debt ceiling debate is perhaps more important. That fact we're even having the debate -- or even saying shutting down the government is a good idea -- is the height of abject stupidity. To understand the sheer magnitude of the incomprehensible idiocy behind this, it's necessary to understand the importance of the government debt market.

The Treasury Yield curve is the base yield curve of the US economy. All other bonds are quoted based on their respective spread to treasuries. For example, a trading desk would quote a specific corporate credit at +50 to the corresponding Treasury, meaning the bond was trading at 50 basis points more than the corresponding Treasury. Treasury bonds are also used to hedge mortgages and corporate bond issues.

But this is not all (as if being the base interest rate curve were not not enough). As Krugman points out, Treasuries are a very important asset for the financial system:

First, US government debt plays a special role in the financial system: T-bills are the universal safe asset, the ultimate collateral. That’s why, during moments of financial stress, the interest rate on T-bills has actually gone negative. Make that safe asset suddenly unsafe, and it might cause vast disruption.

These assets have to remain safe given their incredible importance to the US financial system.

In short, arguing about the debt ceiling creates a tremendous amount of uncertainty, which slows private action. And that is something we don't need, especially as the economy is faced with a slowdown scenario.

Financial fear in a deep sleep

- by New Deal democrat

One of the drivers of last year's Summer Slowdown was the Euro-crisis-induced fear of another 2008-style financial freeze. The contrast with this year, as indicated in the below graph of LIBOR rates, showing the Euro crisis spike, and this year's plunge, is striking:


But if you want to see just how deep a sleep fear of another financial meltdown is, let's zoom back for a look that includes 2008:


A more sophisticated measure of the level of financial fear is the "TED spread." The TED spread is defined as "the difference between the three-month T-bill interest rate and three-month LIBOR." If you don't want to accept my word for it, then here is a link to Prof. Krugman's explanation right after the Bear Sterns collapse in March of that year.

And here is a graph, h/t Bloomberg, of the TED spread for the last five years:


Almost exactly two years ago, in May 2009, Felix Salmon wrote in the Financial Times:
Remember the TED spread? It closed at 139bp on March 17, which was a decided improvement over the levels over 400bp we saw last fall, but was still pretty wide.

Yesterday, however, it closed at 58bp, and today it’s finally broken the 50bp barrier, last at 48bp. Back when the likes of Paul Krugman started blogging the TED spread, in March 2008, it was oscillating wildly between about 100bp and 200bp. Now it’s back to much more normal levels
On Friday it closed at 24.

So somnolent is the fear of another financial freeze that a search for "TED spread" in google trends indicates that there haven't been enough mentions in the last 12 months to generate any line at all:


This is true even though there is widespread agreement that Ireland would be better off repudiating its debt, Greece must restructure its debt, and rumors that Greece could leave the Euro. Indeed this is a very different environment than even a year ago.

Equity Week in Review and Preview of the Upcoming Week/Month

First -- it's good to be back. As you know by now, blogger went down at the end of last week. It's amazing -- and a bit scary -- how omnipresent Google has become.

That being said, here is what I wrote about the markets last week.
I am still very concerned about the fundamental situation. As NDD has pointed out in his weekly high-frequency posts, most of these indicators are slowing. While the latest employment report was surprisingly positive, the spike in new claims is concerning. With the austerity movement taking hold in Washington, the "G" part of GDP is going to be weak for at least one more quarter. Although commodities moved lower last week, their overall prices are still high. In short, I don't see any strong fundamental reason for the markets to move higher right now.
I have no reason to alter my opinion at this time. As I will write throughout the week, it appears the economy is most likely moving into a soft patch which will remove upward momentum from the market. Important foreign markets (China, India and Brazil) are experiencing higher than desired inflation which is leading their respective central banks to raise rates. Gas is nearing $4 gallon which is dampening consumers and the federal fiscal situation is chaotic creating a tremendous amount of uncertainty decision markets. As such, there is little fundamental reason for markets to move higher.

Let's go to the charts:


The 10-day, 5-minute chart shows that prices have been consolidating in about a two-point range (between roughly 133.6 and 135.6) for the last 8 days. Notice that all strong advances are followed by consolidation lower.


The daily chart shows prices consolidating around the 134 level, which has operated as a center of gravity for trading for the last few weeks. Also note the 10 day EMA is now moving sideways and the 20 day EMA's advance is weakening. The 50 day EMA is still moving higher, indicating the longer-term trend is still up.

The technicals are weakening. The A/D line has moved lower as has the CMF while the MACD is dropping (indicating weaker momentum) and has given a sell signal.

None of the other markets are showing a divergence with this analysis:


While the transports have advanced to a new high, the chart appears to be forming a double top. Prices have recently moved through the 20 day EMA in a strong downward bar.


The QQQs have been trapped by the 59 price level.


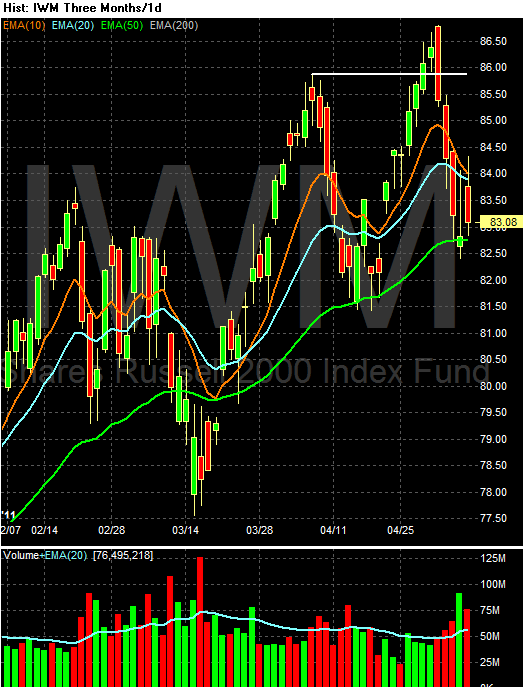
After breaking out, the IWMs fell back to the 50 day EMA and are currently consolidating.

In short, none of the other markets are giving us any hope for an upside break-out. I would treat the equity markets as currently consolidating we they wait to see what the overall economic direction is.


Friday, May 13, 2011

Weekly Indicators:*&%$#@! Blogger edition

- by New Deal democrat

This week was all about inflation and retail sales. Wholesale level inflation, the PPI at +0.8% is the highest YoY since just before the recession. The CPI came in at +0.4%, meaning YoY inflation is over 3%.. Unadjusted retail sales were up +0.5%, meaning that real retail sales were +0.1%. March's retail sales were revised up strongly from +0.4% t +1.0% turning March's real retail sales from -0.1% to a strong +0.5%. This was an important data point for me in the "economic stall" scenario, and it has been undermined. Consumer sentiment improved.

Turning to the high-frequency weekly indicators:

The BLS reported that Initial jobless claims last week were 434,000. The four week average is now 436, 750. The entire last half year or more progress on this number has been taken back, and will presumably be a big hit on April's LEI.

Oil ended the week at $99.65 a barrel, up about $2 over the week, but below $100. Nevertheless, it still remains slightly above 4% of GDP. Gas at the pump leveled off at $3.96 a gallon - with the exception of 8 weeks in 2008, an all time high. Gas prices have gone up over $1 a gallon in less than 5 months. Gasoline usage at 8826 M gallons was 3.4% lower than last year's 9140. This YoY comparison has been negative for the last none weeks in a row, averaging -1.9% for the last six weeks. If this level of decline continues for few weeks, that will be equivalent to the decline near the end of 2007. If we continue to get more poor economic data, expect the declines in Oil prices to stick around for a little while.

Railfax was up 3.2% YoY. Railfax has improved their data presentation on their site, which means I can tell you that baseline traffic at 220,153 carloads was down 2486 carloads or -0.7% from a year ago, Cyclical traffic at 160,832 is up 2431 carloads or +1.5% above last year this week. That means almost the entire gain was in intermodal traffic (a proxy for imports and exports) up 19,106 carloads or +7.5% compared with a year ago this week. Even so, intermodal traffic's YoY advance is at a low ebb, as is total traffic.

The Mortgage Bankers' Association reported an increase of 0.3% in seasonally adjusted mortgage applications last week. Refinancing increased 6.0%, preumably refelcting a decline in mortgage rates. It remains above its June-July 2010 lows. The purchase series has been generally flat for close to one full year - compared with its previous relentless decline, a good thing.

The American Staffing Association Index rose to 93, after 12 weeks at the 90-92 levels. This makes it better than its spring 2008 and 2009 growth, and much more like 2007 - slow growth, but not stalled.

The ICSC reported that same store sales for the week of May 7 rose 2.7% YoY, and were flat week over week. Shoppertrak reported a 5.8% YoY increase for the week ending May 7, completely reversing last week's 6.0% decline. It also reported a WoW increase of 24.0%, again reversing last week's 16.0% big w/o/w loss. This was probably the last week of distortion due to Easter-related calendar affects.

Weekly BAA commercial bond rates decreased .11% to 5.82%. This was slightly less thans the .12% decrease in the yields of 10 year treasuries to 3.24%. There remains no sign of corporate distress here, although there is hint of fear of deflation.

Adjusting +1.07% due to the 2011 tax compromise, the Daily Treasury Statement showed that for the first 8 days of May 2011, $60.0 B was collected vs. $57.8 B a year ago, for an increase of $2.2 B YoY. For the last 20 days, $133.6 B was collected vs. $130.2 B a year ago, for an increase of $3.6 B, or 2.6%. Use this series with extra caution because the adjustment for the withholding tax compromise is only a best guess, and may be significantly incorrect.

M1 was up 1.1% w/w, up 1.8% M/M, and up 11.0% YoY, so Real M1 is up 7.9%. M2 was up .3% w/w, up 0.8% M/M and up 5.2% YoY, so Real M2 is up 2.1%. Although Real M1 is still strongly in the "green zone" where it has been since before the end of the "great recession," Real M2 has faded back into the "yellow zone" below 2.5%.

The revised March and April real retail sales reports suggest consumers have approached their tipping point, but haven't tipped yet. Initial claims, Railfax, declining gasoline usage, declining bond rates, Real M2, and weak tax receipts suggest softness, but no downturn. at least among consumers. At the same time, intermodal rail shipping suggests that manufacturing continues its strong recovery.

Blogger permitting, we'll see you on Monday! Have a nice weekend.

Wow -- That Was Bad

For reasons unknown, blogger was down for most of yesterday afternoon and today.

Sorry for the interruption.

Thursday, May 12, 2011

Computers and Oil's Drop

H/T Econbroswer

From Reuters:

Machine-led trading is one plausible thesis for another apparent market anomaly that occurred on Thursday. Exchange data shows that the total number of open positions in the oil market -- a number that would typically fall in a selloff -- instead rose. Normally, panicky funds selling oil en masse would cause total "open interest" numbers to shrink, as exiting investors closed out contracts. But some machines, following the market trend, may have gone further, by dumping long positions and quickly amassing sizable short positions instead.

"Computers don't care. Momentum just increases until nobody wants to stand in front of it," said Peter Donovan, a floor trader for Vantage on the New York Mercantile Exchange.

Some big Wall Street traders watched their own systems sell into the down trend but couldn't know for sure who had initiated the selling spree. They only knew that similar machines at other firms, from New York, to London, Geneva and Sao Paulo, would be automatically selling in much the same manner.

During Thursday's crash, such selling locked in profits that high-flying commodities traders have been accumulating for months. Some of Thursday's rout appears to have been more a product of the wisdom of crowd computing than of widespread human panic.

"We believe the magnitude of the correction appears in large part to have been exacerbated by algorithmic traders unwinding positions," Credit Suisse analysts wrote in a report.

High frequency trading and algorithmic trading accounts for about half of all the volume in oil markets.

Wednesday, May 11, 2011

Thursday Oil Market Analysis

Last week I wrote the following about the oil market:

In short, I don't see the market moving strongly in either direction. As prices approach the 114 level, I see them hitting resistance, especially as news of gas prices gets publicity. However, there are strong supports for the market as well.

Basically, I think we're in for a fairly tight trading range near term.
As if on cue -- on the very same day I wrote that phrase -- the market tanked the most in the last few years.

Oil market 1; Bonddad 0.

In my defense, I was looking at my reasoning and, given what I knew then, I would make the same call today with the same information. I think last week we saw the commodities equivalent of a flash crash which no one can predict.

Let's take a look at the chart to see what it says this week:


Click for a larger image.

We clearly see the move lower, with prices printing some very strong downward bars. Prices also moved through the EMAs and the 10 and 20 day EMA are now both moving lower with the 10 day EMA already below the 50 and the 20 day EMA fast approaching that level. In addition, we see the rebound trade print one strong bar and one weaker bar, but with resistance at the EMAs. Yesterday, prices printed another strong bar lower.


Click for a larger image.

The 5-minute page shows the drop, the rally along a slightly upward trend line and then yesterday's move through the trend.

Yesterday I mentioned that I am now a bit cautious on commodities. The reason is there is now evidence that some of the faster growing economics (Brazil and India) are slowing down. China's inflation rate is now higher than desired, indicating the PBOC will continue raising rates. And gas demand in the US is dropping as a result of lower prices.

At the same time, we're not crashing, just slowing. While the US economy printed a slow 1Q, there are no signs of a double dip. As such, I still see a very tight supply/demand situation.

Right now, I have no read on the oil market and would avoid it; there are simply too many wildcards in the mix currently.

On Economists, Economics and the Current State of Economic Thought

NDD posted an article last week on the current state of economics. The article was in response to a post from Professor Delong regarding the current state of economic thought. I wanted to add my two cents to this discussion.

But first, I think an explanation of my economic education is in order, as I believe it explains a great deal about my perspective. I learned economics by accident. I had a professor in college who suggested that I read the New York Times and Wall Street Journal everyday to get my news. In doing so, I wound up reading the markets and economic section of the WSJ. While at first confusing, I continued to read until the whole picture started to make some sense. Then in my junior year in college I got a summer job cold-calling for a broker. The firm where I was working had a collection of books it used to help brokers study for the series 7 exam. I would up reading most of these books out of interest.

After college I wound up getting a job with a securities firm. I started in equities and moved to fixed income about a year later (now you know where my internet name comes from). At this job, I had clients who managed large amounts of money ($1 billion +). These guys were some of the sharpest people I have ever met -- they had probably forgotten more about the economy, markets and finance than I had ever learned. I spent a great deal of time talking with them about what was then happening in the economy (this was the mid to late 1990s). This was a great place for me to take what I had learned and apply it to the real world.

After going to law school in the 2001-2003, I found blogging in about 2004 and started to write about economics. The rest, as they say, is history (or at least a great deal of time spent writing about economics). In addition, in my current job, I consult on portfolio structures for small insurance companies.

All that being said, it should be clear that my primary goal in writing and explaining the economy has nothing to do with models or theoretical concepts; instead, it has everything to do with explaining where we are now, where we have been and where we are probably going. Another way to look at this is I (hopefully) provide actionable information. I am interested in figuring out what is profitable for myself and hopefully other people. The best way to do this is to know the current state of the economy.

How does this tie into what Professor Delong and NDD wrote about? Well, in my humble opinion, the vast majority of "economists" at colleges are great examples of really stupid smart people. First, most believe in this great myth: the rational person. That is, they believe that consumers all make rational choices regarding all sorts of things. This is bullshit, plain and simple. People are not rational. Here is but one example: I live in Texas. About every fourth car on the road is a pick-up truck or SUV. We are currently experiencing near $4 gallon gasoline, at a time of high unemployment -- meaning there is very little upward wage pressure. A rational person would look at this situation and trade in their pick-up en masse for far more fuel efficient vehicles. They would also be clamoring for more public transportation -- which, trust me, isn't going to happen in Houston anytime soon. I could go on -- and I'm sure you can think of a great example off the top of your head of the same situation.

As soon as I see an academic write an article about the ideal policy response, I turn off automatically. The reason is simple: they are arguing from a purely theoretical perspective that has absolutely no bearing on reality as we know it. Hence, it's a pure waste of time reading or engaging in any debate with these people. I should also add, one step removed from the academic economist is the political economist, or the "economists" who write for a "think tank" or a political party, candidate or cause. These people also have a clear agenda that completely pollutes their perspective to the point of making it worthless. In this category we have the entire political blogphere.

The people I do listen to are three types.

1.) Economists who provide an analysis based on data -- and the more the better. And I love disclaimers. Why? Because tomorrow the economy could change on a dime. If you want certainty, bet on death and taxes. But the economy is like a giant Calder mobile; there are myriad parts spinning around, continually changing their orientation, forcing you to continually reevaluate what you thought was real. I've had people complain to me -- or gloat about -- a change in my position regarding the economy. What these people don't realize is the picture is constantly evolving and changing. At most, anyone has got about 6 months of visibility, and that's only on a really good day.

2.) Economists who provide long-winded explanations of the situation with tons of nuance.

3.) People who are looking at markets in real time and making investments based on that data.

Everyone else -- in my opinion -- is garbage. And that includes the vast majority of academic economists, political economists, and the vast majority of internet economists.

Economic Idiocy on the front page of Daily Kos

- by New Deal democrat

It's bad enough that the only diarist left who hits the Wreck list there is the Pied Piper of Doom, but now the economic lunacy has hit the front page as well.

Last night Joan McCarter put up a piece called Housing news remains bad, but is likely to get worse. Relying on a story by Kevin Drum, who is talking about housing *prices*, she says:

This ... is really not good news for the nation's economy.
Home values posted the largest decline in the first quarter since late 2008
and continues:

....Of course, ongoing 9% and higher unemployment makes that picture even more grim, as does the news that more than 28% of homeowners are currently underwater on their mortgages. Foreclosures are spreading [and] home values continue to plummet....

Between high unemployment, stagnant wages, and rampant ongoing fraud and mortgage problems, who is going to be in the market to get a mortgage and buy a house?
(my emphasis)

I should start by saying I don't know Ms. McCarter at all, and have no personal ill will towards her. But the above is pure nonsense.

To begin with, foreclosures peaked over a year ago, in March 2010.

More to the point, on the very same day that a DK front pager says "who is going to be in the market to get a mortgage and buy a house?" the blog Housing Wire reports that:

Florida existing home sales followed the national trend upward in the first quarter, jumping 13% compared to the year prior to more than 44,500 homes statewide.

Existing condo sales rose 29% compared to the first quarter of 2010, reported Florida Realtors. The organization said all but one Florida metropolitan area witnessed annual gains in condo sales including Tampa-St. Petersburg-Clearwater, Fla., which saw a 27% increase in condo sales. Only condo sales in Tallahassee, Fla. dropped compared to 2010, down 20%.

In total, 23,375 condos sold around the Sunshine State, up 29% from little more than 18,000 in the first quarter of 2010.
And via Data Quick, we learn that:

Phoenix-area home sales surged in March, rising more than usual from February and posting a year-over-year gain for the third consecutive month as sales to absentee buyers hit a new high.... A total of 10,352 new and resale houses and condos closed escrow in March in the combined Maricopa-Pinal counties metropolitan area. That was up 44.3 percent from the month before and up 7.5 percent from a year earlier, according to San Diego-based DataQuick, which tracks real estate trends nationally via public property records.

A sharp rise in sales from February to March is normal for the season, although this year’s jump was larger than usual.... March’s sales were the highest for that month since 10,712 homes sold in March 2007. This March’s sales tally was just 1.0 percent short of the average number of sales for the month of March since 1994.
and further that:

Las Vegas region home sales held at a five-year high in March amid unusually strong activity among investors, cash buyers and others targeting sub-$100,000 homes.... In March, 4,953 new and resale houses and condos closed escrow in the Las Vegas-Paradise metro area (Clark County) – the highest sales tally for any March since 2006, when 8,486 sold.

March sales were up 27.3 percent from February and up 1.6 percent from March 2010, according to San Diego-based DataQuick.... On average, the region’s sales have risen 29.0 percent between February and March since 1994, when DataQuick’s complete Las Vegas region statistics begin. March’s sales total was 0.1 percent higher than the average number sold in March since 1994.
Memo to Daily Kos front pagers: when you make something cheaper, and the interest rates to pay for it go down, sooner or later it turns into a real bargain, and more people will buy it. Yes, prices are off an all time record from their highs -- which is awful if you are a seller, but is terrific if you are a buyer, especially a first time buyer. Which is most certainly not "bad news for the nation's economy." As I put it in March, describing this situation, Lo and behold, supply and demand works!

Tuesday, May 10, 2011

Wednesday Commodity Round-Up

Last week, I wrote the following about the commodities markets:

Below are six, longer term futures contracts. I have put them up to demonstrate the futures prices are falling or stalling in a number of markets. There are several reasons this is important.

1.) It lowers the possibility of inflationary pressures
2.) I could mean that supply/demand issues are coming back into balance
3.) There may be a bet that the world economies are slowing, thereby lowering futures demand.
This was the day before the commodities crash last week, which I would classify as the equivalent to the flash crash in the market a few years ago. Essentially, increased margin requirements led to selling. In addition, a rising dollar also contributed to the sell-off.

However, I want to issue a round of caution on the commodities markets. While I still believe they are a good long-term investment, I'm not sure the demand strength is there to keep pulling prices higher. Overall world LEIs are giving us mixed signals right now. The Brazil and India LEIs are clearly moving lower, the UK's flat, and Italy's is dropping. While China's is increasing, it is doing so at a lesser rate of increase. On that note, consider this story regarding China's overall economy:

China's industrial output growth eased much more than expected in April to suggest the world's second-biggest economy is cooling, reducing the need for further aggressive monetary policy tightening even as inflation remains stubbornly high.

Consumer inflation eased modestly to 5.3 percent in April from a 32-month high in March of 5.4 percent. The outcome topped expectations but still underlined the view that price pressures are peaking and may start to ease in the second half of 2011.

Industrial output rose 13.4 percent from a year earlier, but that was more than a full percentage point below both expectations and a strong pace in March.

Retail sales growth eased more than expected while annual increases in money supply and outstanding yuan loans hit their lowest pace in 29 months, signs that measures to slow the economy are starting to bite.

Most analysts said the central bank could now reduce the scope of further tightening in monetary policy, while a prominent Chinese government economist went further, saying policymakers may be concerned about an overly rapid slowdown.

Granted the rates of increase are still quite enviable by western standards. However, China has been tightening for the last year in both interest rates and reserve requirements, moves which appear to be having the desired effect.

Also note China's inflation rate is still above expectations, indicating further tightening is in order.

That being said, both the US and OECD area have decent LEIs, indicating the expansion may be self-sustaining at this point.

However, overall, I think a word of caution is warranted in the short-run regarding commodities as a class.

Conservative Sectors Looking Good


The three charts above are the ETFs for utilities, consumer staples and health care. These are considered very safe areas of the markets. Also note that all three charts are very strong, indicating investors are moving into these sectors.

When safe sectors rally, it's important to take note, as it indicates traders are lowering their risk tolerance, which may hinder upside growth.

Worst. Education Policy. Ever

From the WSJ:

The Class of 2011 will graduate this spring from America’s colleges and universities with a dubious distinction: the most indebted ever.

Even as the average U.S. household pares down its debts, the new degree-holders who represent the country’s best hope for future prosperity are headed in the opposite direction. With tuition rising at an annual rate of about 5% and cash-strapped parents less able to help, the mean student-debt burden at graduation will reach nearly $18,000 this year, estimates Mark Kantrowitz, publisher of student-aid websites Fastweb.com and FinAid.org. Together with loans parents take on to finance their children’s college educations — loans that the students often pay themselves – the estimate comes to about $22,900. That’s 8% more than last year and, in inflation-adjusted terms, 47% more than a decade ago.

In the long run, the investment is probably worth it. Education is a much better reason to borrow money than buying cars or McMansions, and it endows people with economic advantages that the recession and slow recovery have only accentuated. As of 2009, the annual pre-tax income of households headed by people with at least a college degree exceeded that of less-educated households by 101%, up from 91% in 2006. As of April, the unemployment rate among college graduates stood at 4.5%, compared to 9.7% for those with only a high-school diploma and 14.6% for those who never finished high school.


US higher education policy is a cruel joke. Public universities -- which use to be a great bargain -- have slowly shifted the cost onto students backs. I did a ton of research on this a few years ago, and the basic culprit was state governments slowly cutting funding, which left students picking up the tab.

This is something that has to change. Period.
Link

In Response to Professor Thoma and DeLong

Both Professor Thoma and DeLong are concerned about the employment to population ratio (Professor DeLong has a picture of it posted on his blog). I am not sure it is as concerning as they believe. Let me explain why.

The employment to population ration is a calculation from the Household survey, which is one of the unemployment reports issued by the BLS every month (the other is the establishment survey). The household survey provides very important data: the civilian non-institutional population, the total unemployment rate, the number of employed and the number of unemployed.

The employment to population ratio involves two numbers: the civilian non-institutional population, which comprises the following:
Included are persons 16 years of age and older residing in the 50 States and the District of Columbia who are not inmates of institutions (for example, penal and mental facilities, homes for the aged), and who are not on active duty in the Armed Forces.
Basically, this is everybody who would be eligible to work in some capacity if needed. This number makes up the denominator of the equation.

The second is an "employed person," which is defined as
Persons 16 years and over in the civilian noninstitutional population who, during the reference week, (a) did any work at all (at least 1 hour) as paid employees; worked in their own business, profession, or on their own farm, or worked 15 hours or more as unpaid workers in an enterprise operated by a member of the family; and (b) all those who were not working but who had jobs or businesses from which they were temporarily absent because of vacation, illness, bad weather, childcare problems, maternity or paternity leave, labor-management dispute, job training, or other family or personal reasons, whether or not they were paid for the time off or were seeking other jobs. Each employed person is counted only once, even if he or she holds more than one job. Excluded are persons whose only activity consisted of work around their own house (painting, repairing, or own home housework) or volunteer work for religious, charitable, and other organizations.
However, what if the overall population is aging, and more people are entering retirement than before? Before these people started to die there would be little effect on the civilian non-institutional population from these people dying (but not from births) while at the same time decreasing the number of people working. In short -- what if we were in a situation similar to the baby boomers starting retirement? That would lower the employment/population ratio in its initial stages.

What I'm wondering is this: what will be the overall, longer-term impact of the retiring baby boomers? As I've stated before, (see also this article from Marketbeat regarding a CBO study and this post from SilverOz), I firmly believe we'll continue to see weaker employment/population ratios and labor force participation rates. I should also add that the impact may not be as severe as I think it will be. But I also think the Professors Thoma and DeLong are incorrect in their concern about these numbers.

All that being said, last week I said I thought the oil market would be trading in a tight range on the same day it tanked the most in 2 years, so take this with a grain of thought.

Monday, May 9, 2011

Treasury Tuesdays

Last week, I wrote the following about the bond market:

I'm treating the current action as a consolidation range and would wait to make a trading move until after prices convincingly choose a direction. For the IEFs, that would be a move above 94-94.5 or a move below 92. For the TLTs, it would be a move above 93.5 or a move below 90.

The long end of the curve is still contained by the 200 day EMA -- a technically important development. In addition, the Treasury market is still in a trading range. Until we see a convincing move in either direction, I would not be trading this market.
Let's take a look at the charts to better illustrate the issue:


The vast majority of the IEF's price action since the beginning of the year has occurred between the 92 and 94 price level. However, now prices have broken higher with the shorter EMAs following suit -- all are rising and the shorter are above the longer. Also note the shorter EMAs have crossed above the longer EMAs.


Like the IEF's, the TLTs have been trading in a fairly consolidated range for most of the year. However, like the IEFs, the TLTs have also broken higher with a resulting move from the EMAs. The shorter EMAs are all moving higher as well. In short, this chart is breaking higher as well.

That leaves the question: will the rally last? The current Treasury rally is the result of weak economic numbers. These indicate two things: 1.) the Fed won't be raising interest rates soon, and 2.) price pressures aren't going to hit bond yields. However, I think reason one is really the primary reason for this latest rally.

As I mentioned above, I would be long in this market, at the levels stated above. However, I would have very tight stops. Remember, on the flip side of bond prices are bond yields. At some point, yields get to low to justify the risk taken. Currently, the 10-year is yielding 3.17%. Eyeballing the situation, I would use 2.75% as the abject lowest the 10-year should yield in the current environment. In addition, I wouldn't be looking for massive gains from this trade, instead, thinking that a few points would probably be the pretty good.

So Much For the Municipal Bond Collapse

At the end of last year and beginning of this year, the municipal bond market was dropping. The typical Cassandra's of Doom were arguing this was the coming of the End of Times. As is typical, these calls for collapse were wrong.

The municipal-bond market appears to be surmounting one of its most urgent challenges of the year as banks renew billions of dollars worth of expiring credit agreements with state and local governments, avoiding a costly scramble to refinance.

Early this year, with municipal-bond prices tumbling amid worries of defaults, analysts raised fears over tens of billions of dollars worth of bonds that would need to be refinanced if banks didn't renew letters of credit issued during the financial crisis. Those fears haven't yet been realized, according to a new report from Moody's Investors Service, another sign the $2.9 trillion muni-bond market is steadying itself after months of turmoil.

Of the $13.5 billion of letters of credit and other backstops tracked by Moody's that expired in the first quarter, 85% were either renewed or replaced by another bank, and the costs of many of the letters actually declined, the ratings firm said.

A bigger test comes in the second and third quarters, when $50 billion worth of letters of credit expire.

"We are cautiously optimistic that it all continues to work," said Thomas Jacobs, a senior credit officer in Moody's public finance team. "We are not through the end of this quarter, but we are not seeing problems with extensions." The borrowers typically use these letters of credit to backstop variable-rate demand bonds, which are long-term bonds with interest rates that reset periodically.

Let's take a look at the chart:


The fall at the end of last year was caused by the then-approaching expiration of the BAB program, where the federal government provided support for the muni-market. There was also concern about municipal finances. However, although finances are still tight, there are more and more signs of improvement. In addition, the renewal of the Letters of Credit adds further support to the market.


Notes on the employment report: aggregate hours and double-dip

- by New Deal democrat

Barry Ritholtz made the excellent point over the weekend that pundits who are "frequently wrong, but never in doubt" always have the biggest followings-- the ideologues will always present their case with religious zeal, and the acolytes will loudly proclaim their agreement, while the sensible muddle-through observers typically see no need to get involved. Zero Hedge proclaimed that "ex-McDonalds, ex birth death" there were no jobs last month (never mind that McDonald's hiring came after the week the BLS collected the data). CR was so exasperated he issued a rare direct rebuke. Mish's L-shaped recovery is long gone but he is still one of the top three followed bloggers. And the DK Pied Piper of Doom, whose blown prophecies in the last two years literally number over 100 (I've kept book), can't even bring himself to acknowledge the best month of private hiring in over half a decade - and the commenter who finally did so was ignored, by an audience who does not want to hear such news.

Well, on this blog Data is King, and we are all about nuance. So here are two notes of interest about Friday's employment report.

First, the growth in aggregate hours continues, and continues to be faster than the growth in jobs. Aggregate hours have clawed back 1/3 of the ground they lost in the recession:


This is a long, hard slog, but if the trend continues, by the end of next year hours should have made up all of their comparative lost ground vs. jobs, at which time I would expect growth to directly translate into jobs.

Second, below is an update of my scatter graph comparing initial jobless claims vs. nonfarm payrolls. This time I've included the deterioration in jobs leading up to and into the recession in red. Note how the red line traces a very different path than that of the recovery:


This is why I dismissed the straight line Prof. Delong drew at 400,000 jobs as the dividing point between job growth vs. losses. It simply makes a world of difference whether you are deteriorating into recession, or in recovery coming out of recession. The pattern seems to be:

- going into recession: (1) hiring stops; then (2) layoffs begin.
- coming out of recession: (1) hiring begins in new sectors; then (2) layoffs in the declining sectors stop.

leading to very different scatterplots as above.

But what happens if the recent increase in initial jobless claims presages a "double-dip"? How should we expect jobs to behave? We only have one true example, and that is the failed 1980 recovery turning into the 1981-82 recession. Here is the scatter graph for that double dip, showing the abortive recovery (blue) and the double-dip (red):


I do not foresee a double dip at this time - just a one or two quarter stall. But if there is to be a double dip, you should expect nonfarm payrolls to retreat into 5 digits and then negative numbers in short order.

An End to Cheap Imports?

From the WSJ:

For decades, plentiful Chinese labor kept down costs of a range of goods bought by Americans. Even as politicians in Washington accused China of hollowing out the American manufacturing sector, cheap DVD players, sweaters and barbecue sets were a silver lining for consumers who grew accustomed to ever-lower prices. China also kept down the value of its currency, giving domestic exporters a competitive edge.

"Inflation has been damped pretty dramatically in the U.S. because it exported work to China and other places at 20% or 30% of the cost," said Hal Sirkin, a consultant at Boston Consulting Group. The years of dramatic reductions in costs are over, the firm says.

.....

Li & Fung traces the start of rising wages to the "Foxconn Effect." Foxconn is the trade name of Hon Hai Precision Industry Co., maker of iPads for Apple Inc., and computers for Hewlett-Packard Co., among others. After a string of worker suicides last year at one of its China plants spurred Foxconn to defend its treatment of employees, the company raised wages 30% or more in a bid to improve worker conditions. That raise came as workers at other factories, including staff at a Honda Motor Co. parts plant, went on strike for higher pay.

Since then, the Chinese government has supported higher wages in part to address labor unrest, but also as way to boost domestic consumption and reduce reliance on exports to expand the economy. The rising wages affect both foreign and domestic companies.

Other factors besides rising wages are pushing up the price of goods. Chinese workers, for one, are starting to buy more with their higher salaries. That's contributing to higher prices for commodities such as cotton and oil, which are already climbing in part because of a weaker dollar. Rising living standards in developing economies like China will keep prices of natural resources high as demand outpaces supply.

China's move to let the yuan slowly appreciate in value—something eagerly sought by its Western trading partners—adds fuel to the fire. A stronger yuan makes it cheaper for China to import the raw materials it needs, such as iron and soybeans, helping tame domestic inflation. But it makes its exported goods more expensive for other countries to buy.

Equity Week in Review and Preview of the Upcoming Week/Month

Last week I wrote the following about the markets:
Last week, the market moved higher, which I did not think would happen. As I have stated for the last few weeks (see here, here and here), my underlying concern is the macro environment which is turning neutral (see NDDs Friday high frequency indicators report for more information) which I believe would have prevented the move higher. Obviously, the market did not agree.

So -- the question going forward for this week is the current rally a technical development -- that is, is the market merely acting on technical data -- or, is there a strong fundamental reason for the market to move higher? Currently, we don't have any confirming underlying data for the rally which is my primary criteria to believe the advance is for real. But this week, we get a slew of data which will either provide the requisite confirmation -- or not. The most important for me is Friday's employment report. The last few reports have been encouraging, but we have seen an unwelcome increase in initial unemployment claims over 400,000 for the last few weeks which could indicate the employment situation is weakening (see this link for a good discussion on the topic). We also get both ISMs - with the manufacturing ISM being of particular importance considering the recent drop in three regional manufacturing indexes.

A third possible explanation of the market is that of leading indicator; the market is saying the first quarter is an anomaly and growth will return in the second quarter. As such, traders are getting in on the rally at the earliest possible moment. That is always a possibility; that we are seeing a hiccup in growth and things will get better soon. I'm not completely sold on that idea as of yet, although it is a reasonable explanation. I'd be more comfortable with that analysis if prices at the pump were cheaper and initial claims weren't increasing.

At minimum, I'd wait until the unemployment report before moving into the market. But even then, I'm not thrilled by this advance. Overall, gas prices are high, 1st quarter GDP was low, other commodities' upward moves have stalled, and the bond market is also moving higher. And if we are seeing an advance rally that indicates the economy is experiencing a "hiccup" rather than a stall, there will be other buying opportunities.
My concerns last week are the same concerns I have this week: a fundamental situation that does not support a rallying stock market. First, let's take a look at the daily, 5-minute chart:


Prices dropped consistently on Monday, Tuesday and Wednesday and leveled out on Thursday. Notice that on Friday we see a gap higher in reaction to the better-than-expected jobs report, but prices could not hold those gains going into the close. This chart is important for two reasons. First, despite a better than anticipated jobs report, prices could not continue higher after the open. Secondly, traders did not have enough confidence in the possible weekend news cycle to keep positions over the weekend. That indicates traders are still concerned about the macro situation.


The daily chart shows very negative price action last week. All the bars of red -- not the stuff of rallies. In addition, we see increased selling action over the course of the week, telling us more people are heading out the door. Also of import is the 10 day EMA which is moving lower and the 20 day EMA which is moving sideways.


Prices have fallen to the 134 price area, which was an important area of technical resistance for prices. This means the price action going forward is extremely important; a technical bounce from this level would indicate the bulls are sill in control, but a move lower would obviously indicate the bears are taking over.


The IWMs -- which had broken to new ground -- have fallen back to the EMAs. Also note the increasing volume on the sell-off over the previous week.


The QQQs hit resistance and fell back.

I am still very concerned about the fundamental situation. As NDD has pointed out in his weekly high-frequency posts, most of these indicators are slowing. While the latest employment report was surprisingly positive, the spike in new claims is concerning. With the austerity movement taking hold in Washington, the "G" part of GDP is going to be weak for at least one more quarter. Although commodities moved lower last week, their overall prices are still high. In short, I don't see any strong fundamental reason for the markets to move higher right now.

Saturday, May 7, 2011

Weekend diversion: Japan tectonic shift infoporn

- by New Deal democrat

I'm a sucker for science and for infoporn, so I found the below two images really interesting.

The first shows the location of all earthquakes near Japan beginning just before the March 11 megaquake. It's really easy to see exactly how big a portion of the earth's crust shifted:


The large plurality of aftershocks in the last few weeks have been at the southwest edge of the wedge shown above, so I guess we know where the increased pressure is accumulating next. (To see this in time-lapse, google "Japan quake map:).

The second image shows how far each section of the above wedge moved (see index at lower right). The larger dark red dots are the locations and intensities of various aftershocks:


The biggest move appears to have been about 80 feet!

Weekly Indicators: Commodities Crash Edition

- by New Deal democrat

The big monthly news released this week was continued growth in nonfarm payrolls, up 244,000 in April. February and March were also revised higher. That makes 15 out the last 16 months that initial estimates have been revised upward. The household survey showed a decline of 191,000 jobs, so the unemployment rate went back up to 9.0%. Signifcantly, temporary hiring declined, while construction employment remained steady. While manufacturing continued strong, via the ISM manufacturing index, the ISM non-manufacturing index slipped sharply. Income and spending for April were reported higher, as were monthly same store sales.

Despite the good April payroll news, I sincerely hope that readers of this blog were not surprised by the several suddenly punk reports this past week. Back in January I said that I expected the economy to stall in the second and third quarters due to Oil and Austerian stupidity. Week after week for at least three months in this column I have been reporting the slowly deteriorating YoY numbers in many indices. This week the MSM's complacency was finally broken. So was the speculative surge in several commodities, most especially silver - which caused Oil to back off 10% in a single week. For the next several months I expect to be chronicling the coincident damage, while we wait to see how long it takes high prices to cure high prices, and how much Austerian stupidity emanates from Versailles.

So, turning to the high-frequency weekly indicators:

As indicated above, Oil started the week over $110 but finished at about $97.50 a barrel by Friday. Nevertheless, it still remains slightly above 4% of GDP. Gas at the pump increased $.08 more to $3.96 a gallon - with the exception of 8 weeks in 2008, an all time high. Gas prices have gone up over $1 a gallon in less than 5 months. Gasoline usage at 8943 M gallons was 2.3% lower than last year's 9148. This YoY comparison has been negative for the last eight weeks in a row, averaging -1.6% for the last six weeks. If this level of decline continues for another month, that will be equivalent to the decline near the end of 2007. If we continue to get more poor economic data, expect the declines in Oil prices to stick around for a little while.

The BLS reported that Initial jobless claims last week were 474,000. The four week average is now 431, 250. Needless to say, this was awful, and no it can't all be put at the feet of bus drivers laid off one week for spring break.

Railfax was up 3.3% YoY. Baseline traffic remains below last year's levels. On a 4-week average basis, Cyclical traffic is now also barely above last year's levels. Auto shipments are also down YoY (this may be related to the earthquake in Japan). Even intermodal traffic's YoY advance is at a low ebb, as is total traffic.

The Mortgage Bankers' Association reported an increase of 0.3% in seasonally adjusted mortgage applications last week. Refinancing increased 6.0%, preumably refelcting a decline in mortgage rates. It remains above its June-July 2010 lows. The purchase series has been generally flat for close to one full year - compared with its previous relentless decline, a good thing.

The American Staffing Association Index remained at 92 for the fifth week in a row, after stalling at he 90-91 level for 7 weeks. If this series does not pick up significantly in the next few weeks, it will mirror its flatness in early 2008 and 2009.

The ICSC reported that same store sales for the week of April 30 rose 2.8% YoY, and increased 0.8% week over week. Shoppertrak reported a 6.0% YoY decrease for the week ending April 30. It also reported a WoW decrease of 16.0% (reversing last week's big gain due to Easter). Calendar affects continued to strongly affect these results, but this is still the biggest YoY decline in a very long time for Shoppertrak.

Weekly BAA commercial bond rates decreased .05% to 5.93%. This equals the .05% decrease in the yields of 10 year treasuries to 3.36%. There remains no sign of corporate distress here, although there is a small tinge of fears of deflation (due to the commodity crash).

Adjusting +1.07% due to the 2011 tax compromise, the Daily Treasury Statement showed that for the first 4 days in May 2011, $37.0 B was collected vs. $36.7 B a year ago, for an increase of $0.3 B YoY. For the last 20 days, $132.9 B was collected vs. $130.1 B a year ago, for an increase of $2.8 B, or 2.2%. Use this series with extra caution because the adjustment for the withholding tax compromise is only a best guess, and may be significantly incorrect.

M1 was up 2.8% w/w, up 0.9% M/M, and up 11.6% YoY, so Real M1 is up 8.9%. M2 was up .3% w/w, up 0.4% M/M and up 4.9% YoY, so Real M2 is up 2.2%. Although Real M1 is still strongly in the "green zone" where it has been since before the end of the "great recession," Real M2 has faded back into the "yellow zone" below 2.5%.

We have a number of indices - Railfax, American Staffing Association, initial claims - that are stalling or worse. Still, both Real M1 and the holding steady of mortgage applications continue to say no outright downturn.

Have a nice weekend!

Friday, May 6, 2011

Weekend Weimar and Beagle

It's been awhile -- but here are some pictures of the kids


A note about the commodities crash

- by New Deal democrat

Some of you may have noticed, commodities have crashed in the last week. Oil went from over $114 to about $97 earlier this morning. According to Bespoke Investments, this is the most serious crash since 1980 (when the Hunt Brothers' attempt to corner the silver market imploded).

Most likely, this crash too goes back to the silver market, which has had a150%+ parabolic move in the last year, from about $18/ounce to just under $50:


There have been substantial allegations of manipulation made (as in, ETFs that are supposed to hold actual bullion, instead holding vapor). Margin requirements have been raised 4x in 8 days.

As of the end of yesterday, silver was off 30% in a single week. Gold was off about 7%. Oil was off almost 10%.

Note, however, that while Oil and some other commodities made tops on the same day as silver (last Thursday), their declines were very orderly until AFTER silver crashed. For example, here's Oil:


Note that the big move in Oil comes on the third day of the silver crash.

That suggests to me that people who were caught flatfooted by silver's move, and had margin calls, had no choice but to cash out other commodity positions to meet the calls. A similar thing happened with hedge fund redemptions in early October 2008 causing stocks to crash.

One important difference is, volumes in Oil futures have been rising, while silver's have been almost non-existent. I don't know what to make of that anomaly.

Usually when bubbles pop, the entire parabolic move is given back, although not necessarily all at once. If Oil positions continue to be cashed out, we could see Oil back at about $85. Which would, of course, be good for the economy.

The cure for high prices continues to be . . . high prices.

P.S. Due to the necessity of earning a living, Weekly Indicators will go up tomorrow. There will also be a double-special weekend diversion!

Payrolls Up +244,000

From Bloomberg:

The U.S. economy added more jobs than forecast in April, easing concern that higher fuel prices are slowing the economic recovery.

Payrolls increased by 244,000 workers last month, the biggest gain since May 2010, after a revised 221,000 gain the prior month, the Labor Department said today in Washington. Economists projected an April rise of 185,000, according to the median estimate in a Bloomberg News survey. Employment excluding government jobs jumped the most in five years. The jobless rate rose to 9 percent, the first increase since November.

More jobs and rising wages may give households, whose spending accounts for 70 percent of the economy, the means to overcome the highest gasoline prices in almost three years. Federal Reserve Chairman Ben S. Bernanke and some of his colleagues have signaled they plan to forge ahead through June with record monetary stimulus to bolster the expansion.

“The recovery has progressed into the self-propelling stage, where it’s less vulnerable to short-term swings in sentiment,” said Jim O’Sullivan, chief economist at MF Global Inc. in New York, who forecast a gain of 250,000 jobs.

On a personal note -- I am very relieved by this report. The events of the last few days have been very concerning, with the rise in initial unemployment claims particularly being particularly hair-raising. This goes a long-way to arguing that what we're seeing are temporary fluctuations.

NDD here with a few comments:

- Unemployment ticked up .2% because the household survey showed 190,000 jobs *lost*.

- Manfuacturing workweek, a leading indicator, was unchanged.

- Private payrolls were up 268,000. Government jobs continue to slowly bleed.

- Construction jobs were unchanged. That area of hemorrhaging is over.

- Perhaps most importantly of all, February and March were both revised upward, by a total of 47,000. This continues the pattern of relentless upward revisions. In the last three months, job gains have averaged 233,000. Not jumping for joy numbers, but not bad at all either.

- Since nonfarm payrolls are the quintessential coincident indicator, and initial jobless claims are leading, unlike Bonddad these do not alleviate my concern about the next few months. For that, we need Oil to decline - anybody heard anything about that?


Thursday, May 5, 2011

Friday Dollar Analysis

Last week I wrote the following about the dollar:

Given the above charts, and the fact nothing has fundamentally changed in the big picture for the dollar, my assessment of the dollar market for the coming week is the exact same as it was for last week: more moves lower with rebounds into the EMAs providing upside resistance


The dollar may be in a position for a technical rebound. Last week there was very little action lower, with prices instead moving in a rounding pattern. There has been a large volume spike over the last week, which may be the sign of a selling climax. Also note the gap higher today and the very strong candle print. There was a strong fundamental reason for the change of direction: dovish statements from the ECB regarding interest rates. I'm suspecting that some of today's action was also some short covering.


So far, the technical indicators are not giving a strong confirmation of a rebound trade. While the A/D and CMF have spiked up, these increases are still new and therefore still possibly transitory. In addition, the MACD is still giving as a neutral reading at best.

The idea of a rebound trade does not mean that the fundamental downward trend that is in place is in any danger of being broken. Prices have still moved through important long-term support levels indicating a strong move lower is already taking place. What is happening is a simple "profit taking" of the shorts. Given the underlying interest rate and fundamental issues underlying each currency, I don't see any reason to the dollar is in danger of a strong rally at this point. But, if you're shorting the market, I would consider taking some profits off the table right now.

Are Emerging Markets Giving the US a Sell Sign?


Let's assume that demand from emerging economies is a primary driver of the current expansion. Let's also assume that stock markets are leading indicators; as traders see the increased possibility of economic growth, they bid up shares in anticipation of increased earnings. Given those two assumptions, let's take a look at three emerging market ETFs.


Brazil has a sideways bias with prices stuck in a roughly 10 point range (70 to 80). The longer term trend (the 200 day EMA) is still higher, but the EMAs are now jumbled; the 10 and 20 day EMAs are moving lower and the 10 day EMA has crossed below the 10. Also note that prices have fallen sharply this week and are now right about the 200 day EMA.


The China ETF has a very similar profile the the India ETF. Most importantly, note that prices are gravitating around the 200 day EMA.


Over the last six months, the India ETF's prices have a slight downward bias, although the 200 day EMA is in a more or less sideways move. All the shorter EMAs recently moved about the 200 day EMA, but are now all moving lower with the 10 day EMA below the 20 and abo0ut to move below the 50.

All of these ETFS are at best showing a "wait and see" attitude regarding their underlying economy. As such, we should pay attention for the possible implications for the US market.