Almost six months ago I had a debate with another blogger who viewed the March increase in foreclosures over February as the beginning of a new "tsunami." The genesis of this story goes back to this graph and others like it that made the rounds beginning in 2006:

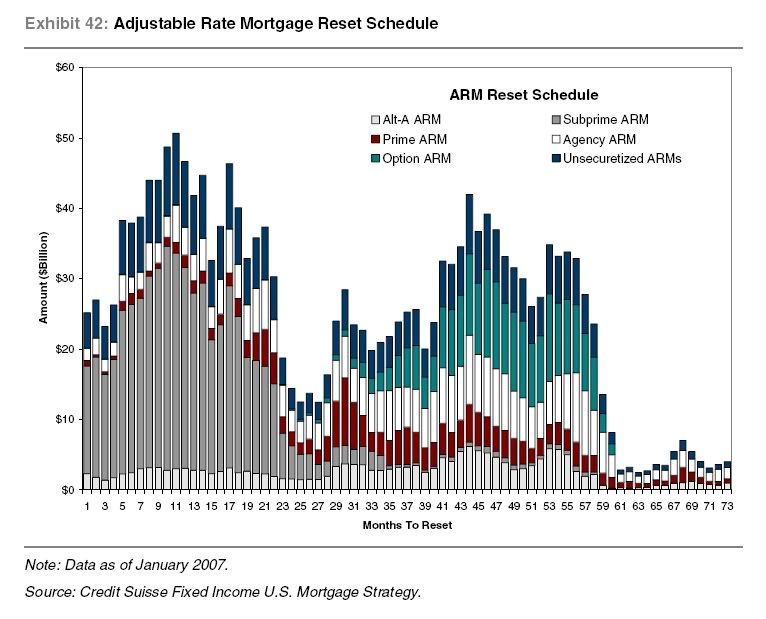
In the above graph, month 43 -- August 2010 -- marks the peak of those resets. While there is a similar graph which shows an even higher peak next year, like the graph above it shows an "eye of the storm" in mid 2008 and increases since then, so YoY increases in foreclosures should have resumed by now. So, today I am officially sticking a fork in the notion of a "foreclosure tsunami" due to those resets.
This morning Realtytrac reported that:
foreclosure filings -- default notices, scheduled auctions and bank repossessions -- were reported on 338,836 properties in August, a 4 percent increase from the previous month but a 5 percent decrease from August 2009. One in every 381 U.S. housing units received a foreclosure filing during the month.
The report further noted that, while:
Lenders foreclosed on 95,364 U.S. properties in August, the highest monthly total in the history of the report ... A total of 96,469 U.S. properties received default notices (NOD, LIS) in August, a 1 percent decrease from the previous month and a 30 percent decrease from August 2009 -- the seventh straight month where default notices have decreased on a year-over-year basis. Default notices peaked in April 2009, when 142,064 were reported nationwide.
In other words, old foreclosures were pushed to conclusion, while the pace of new foreclosure actions has slowed dramatically.
Here is an updated chart showing total foreclosure activity and YoY change for the last 19 months:
| Month | YoY % change | actual foreclosures |
|---|---|---|
| 04/2009 | +32 | 342,038 |
| 05/2009 | +18 | 321,480 |
| 06/2009 | +33 | 336,173 |
| 07/2009 | +32 | 360,149 |
| 08/2009 | +18 | 358,471 |
| 09/2009 | +29 | 343,638 |
| 10/2009 | +19 | 332,292 |
| 11/2009 | +22 | 306,627 |
| 12/2009 | +15 | 349,519 |
| 01/2010 | +15 | 315,716 |
| 02/2010 | +6 | 308,524 |
| 03/2010 | +8 | 367,056 |
| 04/2010 | -2 | 333,837 |
| 05/2010 | +1 | 322,920 |
| 06/2010 | -7 | 313,841 |
| 07/2010 | -10 | 325,229 |
| 08/2010 | -5 | 338,836 |
It bears emphasizing that the rate of foreclosures isn't "good", in fact it's very bad. But if the new wave of re-amortizing mortgage resets were going to result in a foreclosure tsunami, it surely would have manifested itself by the crest of that new wave. It hasn't. Foreclosure activity probably has been driven not by mortgage resets, but by stabilization in home prices and stabilization in jobs. The fundamental position of homeowners did not change for the worse in the last year.
Thus, there may yet be an echo-foreclosure increase due to renewed house prices declines - not mortgage resets - in the next couple of years. RealtyTrac's spokesman, Rick Sharga, suggested as much a month ago, indicating his belief that foreclosure activity probably won't peak until next year.
Nevertheless, the idea that an increase in resets would lead to a foreclosure tsunami at this point has to be regarded as a myth that has been busted.


5 comments:
Yes, I remember that graph and was properly concerned about its implications. But alas, the Fed has been busy shoveling money out the door so while the tsunami was indeed a vast event, it was mainly of concern only to one's ankles.
However, the latest numbers while suggestive of a longer termed real estate healing trend say nothing sobering about either the massive credit hangover or the plop-plop fizz-fizz of enhanced job creation.
I would suggest that the Tsunami is still out there sulking in the deep, bidding its time, awaiting for the moment when some player foolishly pulls the trigger.
Anon -
The credit hangover is being cured. Households are paying down their debt; the FSO ratio has been declining for the last few years.
The Fed's money shoveling hasn't happened as you claim; while the Fed has been purchasing securities as part of their quantitative easing program, this has not turned into a money printing situation as loans outstanding are decreasing.
1) Many of these mortgages have already defaulted in anticipation of reset.
2) If your mortgage resets this month and you want to hang around, you aren't likely to go into foreclosure this month. It takes a few months to process.
3) Regardless, banks, including the GSEs, have been very careful about managing their inventory of distressed properties (steady stream vs. tsunami). By managing the stream, fewer losses are marked to market at any given time, and banks (though not so much the GSEs) are allowed to earn their way out of their pu pu platter of decision-making circa 2007.
4) Depending on the product, your income and house prices are largely irrelevant. A recast option arm with a teaser rate has a 80-90% default probability, absent refinancing. But as long as your aren't crazy underwater, refinancing lately has been easy enough. Many have refinanced at a fair ways beyond LTV, so many of these will be indentured servants to their granite countertops for a generation or two. Sounds like fun to me!!!
5)The isn't over just yet, but it isn't likely to come to a dramatic crescendo, either. Another five to seven years of stagnantish housing is likely. It has been a policy decision to delay the process, and delaying the inevitable for a less dramatic effect has been effective in a sense. But it's also likely to delay the bounce-back effect from a return to healthy growth on the backside as well.
6) Still, we're probably much closer to the bottom than to the top (with the possible exception of NYC, Ireland, Spain, the Ukraine).
bonddad
I mostly agree with your assessment of the observable facts. I didn't want to focus so much on the extent of money shoveling beyond suggesting that the interest rates that would have created the reset Tsunami never materialized. Fortunately, money has rarely been cheaper than it is now...
I think though that what often gets left out of the technical discussions is the psychological component of life in today's America multiplied by the millions of Americans who've been deeply affected (and disaffected) by the plight of their friends, their neighbors, and themselves; as well as their collective observation that those who created the mess are largely in charge of its resolution. I rarely meet anyone who feels good about current conditions, and the economic discussions I typically engage in are known for the flecks of spittle they generate when the topic gets around to how generously we rewarded the economic titans whose actions are widely regarded as a criminal conspiracy. I don't know how well economic indicators measure this angst. Maybe better than I expect, and maybe the questions that inflame never get correctly framed. I am certain though that the questions that inflame are rarely asked of those who suffer the greatest duress...
Since consumer spending is the main driver behind the perception of economic well being, it will always reflect the perception of personal and social well being. The collective we are still a long way from feeling good about things, and it is the collective we that determines how fast the hangover cure will proceed...
Lastly I want to say how much I enjoy reading this blog since I discovered it a few months back. I try to cruise by at least once a day, but have never offered a comment before...
Foreclosures have stabilized in the 300,000 plus range due to the mortgage servicers managing the flow.
This is the result of such programs like HAMP and HARP which were ostensibly meant to help homeowners but were otherwise a veiled vehicle for the servicers to manage the rate at which they take homes and put them back on the market or auction them.
The point is we are at elevated levels of foreclosure activity relative to any "norms". That the numbers are consistently in a range suggests that this is a managed process for mitigating losses by maintain house prices and controlling losses in any given month. Otherwise, we would see the numbers falling with consistency if the homeowners out there were truly stabilizing. But the numbers are up and down with a variability that is more like the month over month variability in existing home sales.
We should see elevated (300K+) numbers for a couple of more years as the backlog is worked through. There are literally millions of homes that servicers haven't even foreclosed on that in normal years would have been in court already yet the servicers are delaying.
Remember that mortgage servicers have access to lines of financing (which are also packed into securities) that pay the PITI on homes in default to the MBS they service. It is the reason why they can drag out foreclosures and carry defaulted loans that haven't been paid for a year or more.
If you look at the 90+ deliquency rate it isn't getting any better at a rate reflective of the number of foreclosures passing through the system. So the foreclosure activity we see isn't indicative of stabilized households but rather the stability of bank processes for managing losses.
Post a Comment