Thursday, September 9, 2010

The Beige Book, Part I

Yesterday, the Federal Reserve released the Beige Book. This is one of my favorite documents because it allows us to take a fairly regular, comprehensive look at the US economy. I consider it a, "you are here" report, as it tells us the status of a fairly broad range of economic numbers.

Let's start with consumer spending:

Reports on consumer spending were mixed but suggested a slight increase on balance. Most Districts reported that non-automotive retail sales rose compared with the previous reporting period or were above their levels from 12 months earlier. By contrast, Atlanta reported a decline in the level of sales, and Richmond noted that sales "sputtered" in August, while New York and Dallas reported that growth in retail sales slowed. Several Districts noted an emphasis on necessities and lower-priced goods. Boston reported that back-to-school purchases were focused on immediate needs; in Cleveland, consumers focused on "value-priced seasonal items;" and in St. Louis, Kansas City, and San Francisco, sales were relatively stronger for lower-priced items. Spending on big-ticket items such as expensive consumer electronics was weak according to Philadelphia, Richmond, and Dallas. Most Districts also reported that sales of new automobiles and light trucks were largely stable or up slightly during the reporting period, and contacts were optimistic for stable sales or slight growth over the balance of the year. A few reports indicated that inventories for various goods remained near desired levels despite slower sales in some cases, as retailers have been practicing very tight inventory management.


Consider this points from the regional district reports:

Boston: First District retailers report mixed sales results for July and early August. Year-over-year same-store sales range from decreases of 10 percent to increases in the low single-digits, and one contact quips that "flat is the new up." Back-to-school sales were modest, with the consumer focused on buying for immediate needs only. Several retailers report increases in foot traffic but also smaller average ticket size.

NY: Non-auto retailers report that sales have slowed across the District since the last report, with comparable-store sales running just 2-3 percent ahead of a year earlier, on average, in July and up just 1-2 percent in the first few weeks of August. The slowing has been particularly pronounced at New York City stores. Two major shopping malls in western New York State also report that sales weakened in July through early August, and they report substantial discounting--especially at clothing retailers.

Philadelphia: Third District retailers reported that sales rose from July to August for the back-to-school shopping period, and most of the stores surveyed posted year-over-year gains for the period. Store executives continued to note that much of the year-over-year improvement in sales has been a consequence of last year's poor results; nevertheless, many said the fundamental trend in sales was beginning to strengthen. Some merchants noted relatively healthy sales of apparel and small appliances, albeit with significant discounting, but weak sales of big-ticket consumer electronic products.

Cleveland: For the period from mid-July through mid-August, retail sales generally showed some improvement when compared to the previous 30-day period. Purchases rose slightly on a year-over-year basis. Still, consumers remain cautious in their purchases and are focusing on value-priced seasonal items.

Richmond: Retail sales sputtered in August, with most merchants reporting either flat or contracting activity. Sales declined at several building supply businesses as well as lawn and garden retail establishments. An executive at a hardware store chain in central Virginia commented that sales were flat, and he had redistributed inventory across store locations as part of an ongoing cost reduction plan to survive the weak housing market. The store manager for a discount chain store in central North Carolina reported erratic apparel sales; however, he and several other retailers were relieved that early results from back-to-school sales on other items were at least satisfactory.

Atlanta: Most District merchants reported that traffic and sales decreased in July and August. Retailers continued to keep inventory levels low and the outlook was less positive than in previous months. District automobile dealers indicated that sales increased from a year ago.

Chicago: Consumer spending increased from the previous reporting period. Retail sales excluding autos were up in August influenced by state sales tax holidays and heavy discounting on back-to-school items like clothing. Contacts noted that higher and lower-end retailers fared well, with middle-end retailers continuing to see customers trading down to lower priced alternatives.

St. Louis: Retail sales reports from contacts in July and early August were mixed. Compared with a year ago, about 37 percent of the retailers saw increases in sales, while 42 percent saw decreases and 21 percent saw no changes. About 32 percent of the respondents noted that sales levels met their expectations, 47 percent reported that sales were below expectations, and 21 percent reported that sales were above expectations. Higher-priced items continued to be weak sellers.

Minneapolis: Retail spending increased moderately. A major Minneapolis-based retailer reported that same-store sales in July were up 2 percent compared with a year earlier, and a Minnesota-based restaurant chain reported that recent sales increased moderately compared with a year ago. July sales at two Minneapolis area malls were above year-ago levels, and mall traffic seemed to hold steady during August. A retailer in Montana noted that sales for appliances and electronics were up about 10 percent compared with a year ago. In southwestern Montana, a furniture store reported that recent sales increased; however, sales at a lumber and home improvement retailer were down.

KC: Consumer spending rose modestly from the previous survey, and contacts expected further growth in the months ahead. Retail sales edged higher and were above year-ago levels at a majority of stores and malls. Purchases of energy-saving appliances and clearance items were reported as strong at several stores, while sales of luxury items such as jewelry and dining room sets were generally characterized as weak.

Dallas: Retailers noted that growth has slowed recently, but sales are up on a year-over-year basis. Customers continue to focus on non-discretionary items while shunning big-ticket purchases. Eleventh District sales trended slightly above the nation over the reporting period, a change from the previous report. Outlooks suggest that while sales growth may be slower for the remainder of the year; overall 2010 sales should show positive single-digit growth.

San Francisco: Retail sales were mixed. Traditional department stores and discount retail chains alike reported further sales increases for small household items, with generally balanced inventories noted. By contrast, sellers of major appliances and furniture reported a slowdown and "difficult" conditions in July and August.


There are a few trends that emerge from the above points.

1.) Consumers are very price conscious.

2.) While consumers appear willing to spend, they are opening their wallets very cautiously.

3.) This is a necessities market -- consumers are probably replacing things that have worn out and are avoiding making big purchases.

Consider these macro charts:


Overall PCEs are continuing to climb and are nearly at highs seen at the end of the last recession.


Services comprise about 65% of PCEs. Their stalling for the better part of a year was obviously a negative development. However, they are now increasing.


Non-durable goods account for about 22% of PCEs. This category of spending has stalled over the last few months.


Durable goods -- which account for about 12% of PCEs have also stalled.

The topping out in durable and non-durable explains the real retail sales picture:


Notice for the last few months we've seen a weaker month to month number.

Let's take a look at auto sales:

NY: Auto dealers in the Rochester area report that sales of new autos were down roughly 10 percent from a year ago in July and down 15 to 20 percent in the first half of August, while Buffalo-area dealers report a 5 percent year-over-year increase in July and project a moderate decline in August. Still, contacts in both areas describe the current sales pace as fairly good, with the 12-month comparisons depressed by last summer's "Cash for clunkers" program. Dealers report that both retail and floor-plan credit conditions have continued to improve.

Philadelphia: Third District auto dealers reported roughly steady sales during July and August at a rate somewhat above the year-ago pace. Dealers expect sales to continue to run at about the current rate for the rest of the year. However, some dealers said manufacturers' incentives are supporting sales of current model-year vehicles, and sales could slip when that supply is depleted and replaced by new model-year vehicles.

Cleveland: Auto dealers saw new vehicle sales strengthen from mid-July through mid-August, when compared with the previous 30 days. Reports also showed improving sales on a year-over-year basis. Expectations call for vehicle purchases to stabilize at current levels in the upcoming months. Many dealers continue to say that their inventories are at low levels. Used vehicle purchases are beginning to soften

Richmond: Big-ticket sales remained weak, according to several contacts. A car dealer in the Tidewater area of Virginia and another in the South Carolina Piedmont indicated that their dealerships were seeing gradual improvement. However, contacts at other dealerships reported a slowdown in sales.

Atlanta: District automobile dealers indicated that sales increased from a year ago.

Chicago: Auto sales rose in July as increased incentives spurred demand, but sales leveled off in August. Dealers continued to report that inventories were lower than desired, particularly for the most popular Ford, GM, and Chrysler models.

St. Louis: Car dealers in the District reported that, compared with last year, sales in July and early August were up, on average. About 44 percent of the car dealers surveyed saw increases in sales, while 32 percent saw decreases and 24 percent saw no changes. Just under half of the car dealers noted that used car sales had increased relative to new car sales, while 12 percent reported the opposite. Also, 20 percent reported more acceptances of finance applications, but 12 percent reported more rejections.

Minneapolis: Vehicle sales were up slightly in North Dakota, according to a representative of an auto dealers association. The owner of a Minnesota domestic auto dealer said that August sales were up from a year ago, but corporate customers were more cautious about purchases.

KC: Auto sales also increased slightly from the previous period, and nearly all dealers were optimistic about future sales. Auto inventories continued to decline, and some dealers were concerned about meeting expected demand as a result.

Dallas: Automobile demand held steady over the reporting period. Contacts said inventories are at appropriate levels and manufacturers are incrementally increasing production. Expectations are for continued modest improvement.

San Fran: Sales of new domestic and imported automobiles improved near the beginning of the reporting period but slowed subsequently. Used vehicle sales improved marginally, while dealers faced a limited supply that kept inventories tight.


The general trend appears to be slightly positive. Consider this chart:


Car sales have a pretty easy year over year comparison, as last years sales were heavily impacted by the cash for clunkers program. Sales have increased from last year's bottom, but have moved sideways for the last few months.

Wednesday, September 8, 2010

Yesterday's Market


I want to start with the bond market today, because the bond market has been a huge beneficiary of an increased concern on the part of investors. Back in May when the Greek crisis started, investors flocked to bonds. Since then, they've been in a strong rally. However, that may be starting to crack.


For the first time in five months. IEF prices have broken below a trend line (a). In addition,


Prices have fallen below the 20 day EMA. Also note the 10 day EMA is approaching the 20 day EMA (but, it's not there yet).

The problem comes from the longer end of the curve -- the TLTs. And the real question is what is the real trend line.


The above trend line makes sense, as there are three major touches (pointed out with arrows). But,


Another trend is also possible. However, there is a really long time between touches and there is a huge area that is not touching the line at all (which I have circled).

So -- which line is the real trend line? Well, this is where the correct answer is both and neither. Simply put, there are reasons to argue both are valid trend lines.


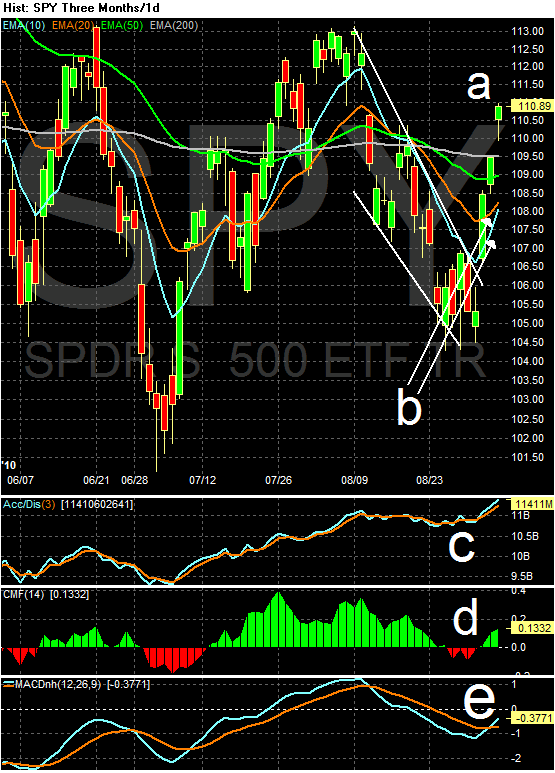
Prices on the SPYs have been above the 200 day EMA for three days now (a). However, they have done so on weak volume (b).


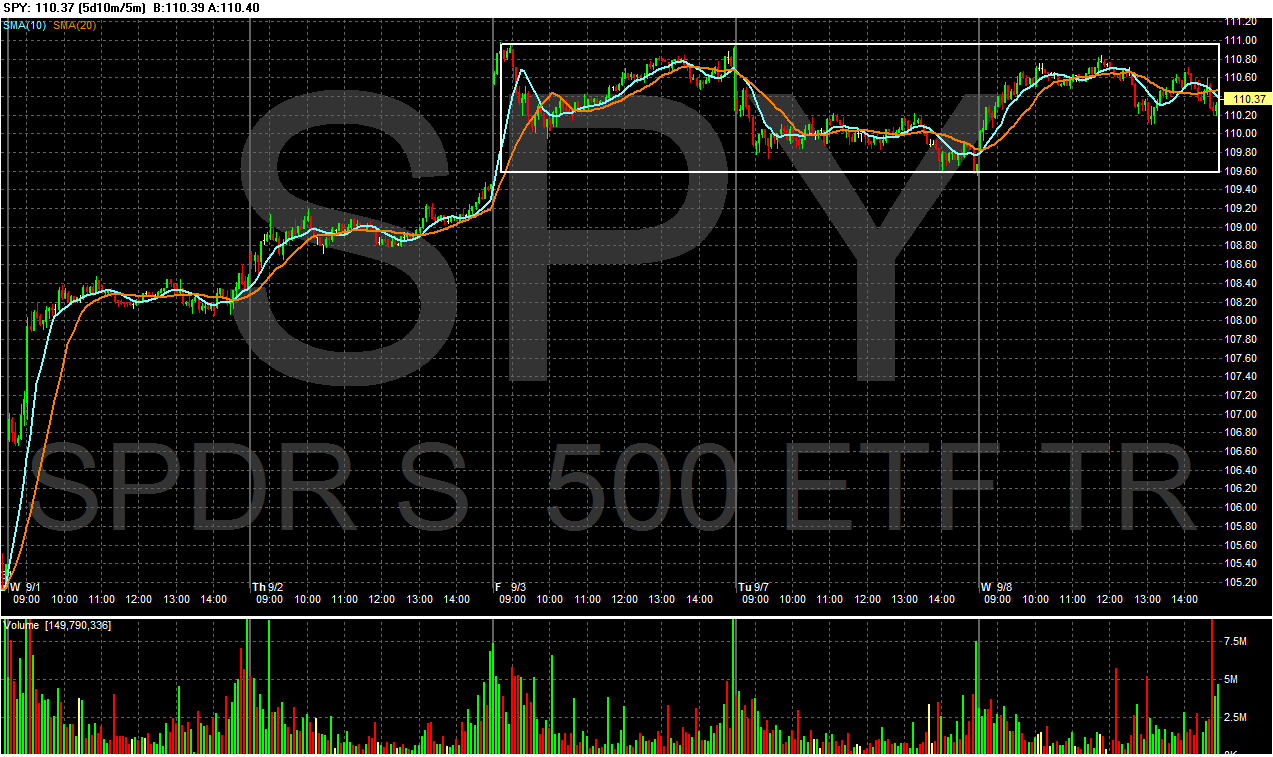
Over the last three trading sessions, we really have a very tight trading range.


Gold continues its upward climb with trend line (B) still intact and a very positive EMA picture (C). However, once again its in a very stubborn resistance area (A) and it is losing a touch of momentum (D). Gold needs to convincingly move through the (A) area and then retest lows to make a real move higher at this point.


Oil is still stuck between areas A and b Right now, prices are in a tight range in the lower 70s (C).

The Two-Track Economy


From the WSJ:

Among the 30 companies in the Dow Jones Industrial Average, the 10 that get the largest share of their sales abroad are expected to see revenues grow by an average of 8.3% over the next year, industry analysts say. By contrast, the 10 that do the least business outside the U.S. are likely to show average revenue gains of just 1.6%.

.....

The divergence between domestic and foreign-oriented business affects the larger U.S. economy in a number of ways. At a time when unemployment remains stubbornly high, many export-oriented manufacturers are struggling to find skilled workers, while jobs that once served as a safety net for American workers, like retailing jobs, have few openings.

If the trend continues it could also drive an even larger wedge between the fortunes of highly educated workers and those with less education.

Rather than simply meeting rising demand abroad by stepping up their exports from the U.S., companies are increasingly moving production to where they sell their products—especially in developing markets, where labor costs are far lower.

This expansion abroad doesn't create any "routine" jobs at home, like working on an assembly line, says Ann Harrison, an economist at the University of California, Berkeley. But workers engaged in more specialized areas, such as research and development, which aren't as easy to move abroad, tend to benefit.

"The workers in the U.S. who are designing the goods, who are coming up with the marketing campaigns—those workers are better off," Ms. Harrison says.

This article highlights a couple of very interesting points.

1.) Over the last few weeks, we've seen strong growth rates printed in foreign economies. Brazil is growing at an 8.9% rate. Germany is also growing along with China. These markets are where the multi-national companies are. However, the US is growing slowly, making it a far less attractive market. Both New Deal Democrat and I have argued the US economy is now the global caboose. These figures bear that out.

2.) Consider this chart from Calculated Risk


Click for a larger image.

Notice that higher educational levels have a lower unemployment rate. Expect this trend to continue, especially as the US becomes less and less of a muscle jobs economy and more of a thinking jobs economy.

I recently made a presentation to my dissertation class where I made the following point: use your dissertation to create a unique, niche specialty for yourself, such that you will be one of the only people in the market to have that specialty. Then use your dissertation to publicize yourself. That is the way the US economy is moving; it is therefore imperative for the economy to invest heavily in education and make it affordable.

3.) There is a lot of political hay made of outsourcing. Some of this in understandable; moving jobs to a new location while having those jobs leave the US is obviously a politically painful situation. However, there is also the issue that as foreign markets develop and become mature, businesses simply move their operations to new locations to build markets in those new locations. Like it or not, that is how business works.


Stimulating China?

- by New Deal democrat

Every now and then you can sum up part the economic situation in one picture, and the below graph imo does exactly that with regard to the impact of the US's economic stimulus packages. It is from Railfax, the service I cite every Friday for the previous week's rail traffic.

Recently Railfax added a new feature that allows you to see traffic over a specified time (and a few other goodies that I haven't quite figured out yet). The below graph is the entire last 10 years, broken up between baseline (blue), cyclical traffic that goes up or down with the economy (green), and intermodal containers (orange) which is an excellent proxy for imports:


The first, obvious point is that rail traffic is seasonal, increasing through the delivery of goods for the holiday season, with a cliff-diving decline immediately after.

Secondly, notice how imports increased much more strongly than cyclical goods during the "Bush boom."

Finally, notice how after the collapse of the "Great Recession," cyclical goods traffic has only come partway back, while imports have surged, almost equalling their volume during the peak of the last economic expansion.

It appears clear that a fair amount of the US stimulus package "leaked" to goods suppliers in Asia. So we got some of the benefit of our stimulus, and in addition to their own stimulus package, China got the rest.

Imho the above graph shows exactly how the chronic trade deficit is the most pernicious structural economic difficulty facing this country.

Why Aren't Firms Hiring?


Consider the following two graphs:


Capacity utilization is just now returning to the lowest level of the previous recession. In other words, there is a ton of excess capacity that needs to come on line before firms start hiring en masse.


Hours worked are still incredibly low and have plenty of upside room as well.

Simply put, there is still a ton of excess capacity in the system.

Tuesday, September 7, 2010

Yesterday's Market


Yesterday, the IEF moved back above the long-term trend line.


Prices gapped higher at the open (a), then consolidated gains (b). Prices saw two more quick moves higher (c and e) followed by consolidation (d and f).


The IWMs better show the real price action in the quity markets yesterday. Prices gapped lower at the open (a), then moved lower printing some very negative bars (b). Prices then consolidated gains at previous price levels (c). Prices dipped below these levels (d) then moved a bit higher but found resistance at the 50 minute EMA (e). Prices then moved lower and closed near the lows of the day on increasing volume (f).


Sugar is still in a strong uptrend. The EMAs are very bullish with the shorter EMAs moving higher and all moving higher. In addition, prices are making new highs with strong bars (A).


Coffee is making new highs as well. Prices have broken through resistance and printed strong bars in the process (A). The EMAs are strong and the MACD has given a buy signal (C).


Copper is still moving higher. After forming a pennant pattern (A), prices broke out and moved to the higher (B). However, they are again consolidating in a downward sloping pennant pattern (C). The EMAs, however, are bullish (D), but the MACD is leveling off (E).

Slim Chance of a Double Dip Recession

My latest column at the NY Times/538 Blog.

Infrastructure Spending Is Not A Boondoggle


One of the biggest problems in talking about the importance of and the need for infrastructure spending is that people who argue against it almost never look at maps. Let's paint a hypothetical picture. There are two cities, A and B. Both cities have complementary economies -- that is, the economy of A provides goods and services that would increase the productivity of economy B and/or vice versa. Or, suppose we have the far more likely case where both economies complement various parts of the other. How are goods and services going too move between these two cities? The standard Libertarian answer to this question is to let private industry do it. However, in a country as large as the US that would require trillions of dollars -- an amount of money far out of reach of even the largest companies.

To draw this example into the real world, here is a map of Texas' (my home state) rail lines:


Click for a larger image.

Texas is littered with small towns not directly on a rail line. How are they supposed to get goods delivered to them? The same situation obviously exists with every other state. Towns not along major rail lines need good roads to receive goods and services.

In addition, not all goods and services move by rail. For those that move by truck, it makes tremendous sense to make sure the roads are in good repair, which lowers transportation costs by lowering damage caused by poor roads. For example (and completely hypothetically), suppose a well-maintained road only causes 1 tire blow-out every week per 50 miles of road whereas a poorly maintained road causes 5 blow-outs per week. Each accident obviously increases the cost of maintaining that particular vehicle effected. But it also adds to other companies' transportation costs by increasing traffic which lengthens delivery times, increases gas consumption for vehicles caught in the traffic jam and adds to wear and tear on other vehicles stuck in traffic.

And that is just roads. There are plenty of other areas that need help. A 2008 Popular Mechanics article highlighted the following areas where the US could increase infrastructure investment: levees, electricity grid, US ports, and the lock system. For example, consider these statistics from that article:

One-quarter of the 599,893 bridges in the United States have structural problems or outdated designs. The country can do more than rebuild these bridges—we can make them better, using high-performance concrete, steel and composites; automated monitoring systems to watch for deterioration; and smarter designs. Similar technologies can also be employed on highways, tunnels and other structures.

.....

About 28.9 million shipping containers passed through crowded U.S. ports last year, and gridlock is mounting. Containers entering the country languished on docks an average of seven days. Adopting the “agile port system” now being developed with help from federal agencies would boost efficiency. When the concept was tested at Washington’s Port of Tacoma, it cut cargo delays in half.


And the problem has not gotten better over the last two years. According to the American Society of Civil Engineers report card of American's Infrastructure, we received a D; Every area of US infrastructure received near failing grades.

Aviation D
Bridges C
Dams D
Drinking Water D-
Energy D+
Hazardous Waste D
Inland Waterways D-
Levees D-
Public Parks and Recreation C-
Rail C-
Roads D-
Schools D
Solid Waste C+
Transit D
Wastewater D-
America's Infrastructure GPA: D

Last week I argued that the combined infrastructure need and the high rate of unemployment among blue collar workers presents the most logical dovetailing of public need with problem solving in a generation. Employing these people does not mean they would be "spitting at the moon;" they would be increasing the efficiency of the US economy. To this, a commenter noted:

The projects are no[t] economically viable. They don't create any new wealth. When the old bridges are torn down (many still work just fine) and new ones are built, hundreds of billions of dollars would have been spent and all that will need to be paid back with interest, and the much of the spending would have drifted out of the US in the form of imports and higher commodity prices.

Better policy options would be the elimination of the corporate tax for all domestic manufacturing operations and the elimination of the payroll tax altogether (social security will be paid for in the short term from the general fund).


First, no one is advocating tearing down functioning bridges; according to all reports there are plenty of bridges that are in terrible repair that would be the natural beneficiaries of the policy. In addition, the US economy has lost about 2 million construction jobs during the recession and about another 2 million manufacturing jobs over the last 2-3 years. These people are currently receiving unemployment benefits. What is wrong with creating jobs for them that pay goods wages (and thereby increasing aggregate demand) which also increase the nation's overall economic efficiency by improving the quality of out national transportation system?

Consider these benefits of the highway system, outlined in the report on the 40th anniversary of the highway system:


The interstate highway system made less expensive land more accessible to the nation's transportation system and encouraged development.

The travel time reliability of shipment by interstate highway has made "just in time" delivery more feasible, reducing warehousing costs and adding to manufacturing efficiency.

By broadening the geographical range and options of shoppers, the interstate highway system has increased retail competition, resulting in larger selections and lower consumer prices.

By improving inter-regional access, the interstate highway system has helped to create a genuinely national domestic market with companies able to supply their products to much larger geographical areas, and less expensively.


Consider the following points about my home state, Texas, from a business point of view:

# 32% of Texas’ major roads are in poor or mediocre condition.
# 47% of Texas’ major urban highways are congested.
# Vehicle travel on Texas’ highways increased 50% from 1990 to 2007.


What if 0% of major roads were in poor or mediocre condition and 0% of highways were congested? Think about the business advantage that would present. Lowered maintenance costs from fewer road caused accidents and lowered delivery costs from less traffic would go straight to the bottom line of all private companies utilizing the roads.

The primary argument against this type of spending is cost. However, consider this. The 10-year Treasury is currently trading at 2.62%. Even if the 10-year spikes 200 basis points in the next 6 months, we're still looking at a 4.62%. Considering the length of time these improvements will be in existence, there is no way the internal rate of return won't at least be 4.62% on an annual basis -- and probably higher when you consider the multiplier effect of jobs, lower delivery times, increased productivity etc...

After considering the need to move goods throughout the country as efficiently as possible, the above commenter couldn't be more wrong. If the US gets to the point where the only transportation line connecting two cities is a dirt road, the US will be in extreme trouble. And that's where the "infrastructure is not economically viable" crowd is leading the country.

For more on the idea of public goods, see this article at Mark Thoma's blog.

Yesterday's Market


This was the big news last week. The IEFs finally broke their 5 month uptrend. If this holds, it will be bullish for the stock market.


Notice that prices fell below the 10 and 20 day EMA, and now have the 50 day EMA or a retest of the trend line as targets.


Last week's move came in three waves. There was an opening gap on Wednesday, followed by a second leg down. Thursday morning there was a slight gap down with prices moving sideways for the rest of the day, and Friday saw an incredibly large gap lower with a quick rebound (but still a big loss) on the day.


The technical indicators are not giving as a strong confirmation of the trend break yet. First, the A/D line (a) is not moving lower but the CMF is approaching o (b), indicating some downward momentum in the trend. The MACD (c) has given a definite sell signal.


Last week we saw prices finally break through the 200 day EMA (a). We also have the shorter EMAs turning higher. However, we still have a long way to go before the EMAs become truly bullish. The A/D and CMF lines (c and d) are very interesting. According to the A/D line, we didn't see a massive exodus from the market -- that is, we didn't see any money leave the market; the same amount of dollars are still chasing the same amount of stocks. The CMF lines (d) indicates a bit of money left the market, but we did not see a mass exodus. The MACD has given a buy signal.


Notice the SPY prices are now back in a trading range.


Corn prices have broken through upside resistance (A), printing a very strong bar (B). The EMAs are incredibly bullish with the shorter above the longer and all moving higher (C). Also note the MACD is moving higher as well (D).


After consolidating (A), wheat prices are now moving higher (B). Also note the EMAs are now turning more bullish (D). The shorter EMAs -- which were moving sideways -- are now moving a bit higher. Finally, keep an eye on the MACD (C), as it might give a buy signal soon.

Friday, September 3, 2010

Weekend Weimar and Beagle

Grill cleaning at the Bonddad household.

See you on Tuesday, not Monday.


Weekly Indicators: Honor Labor Edition

- by New Deal democrat

On Labor Day weekend, let us remember and vow to assist the 8 million workers who have been thrown out of their jobs since the beginning of the Great Recession, and to continue to press for policies thaat will get them all back to work. Bonddad had an extremely good idea earlier this week.

In the meantime, this morning we found out that, excluding the census, there were +60,000 jobs added in August. As I said last week, the critical part of this report I wanted to see was whether weakness would be confined to the two areas of expired stimulus - housing construction / real estate and state and local employment; or whether it was spreading out into other area. The answer is, the report was better on that score than I could have hoped. Government losses, ex-census, were only 7,000. Construction gained jobs (due to the ending of a strike), but was otherwise flat. The gains were relatively small, but they were broad-based. The household survey showed a gain of +290,000, for a gain of 1,438,000 so far this year - double that of the establishment survey. The report validated looking at the American Staffing Association Index, as 392,000 of the 763,000 jobs gained in the establishment survey so far this year have been temp jobs. Hours worked in manufacturing were up +0.1, which will add +0.07 to the LEI. One downside was the increase in U6 from 16.5% to 16.7%.

Other monthly data reported this week was either flat: auto sales, personal income, the ISM manufacturing index (a positive surprise though); or higher: personal spending, factory orders, pending home sales (also a positive surprise). So were August same store sales, up 3.2%. The savings rate declined, but that is good for the near term for growth. Construction spending continued to decline.

Now here's a look at high frequency weekly indicators:
The Mortgage Bankers' Association reported that "the Refinance Index increased 2.8 percent from the previous week and is at its highest level since May 1, 2009.... The seasonally adjusted Purchase Index increased 1.8 percent from one week earlier." The Purchase index continues to move generally sideways after bottoming. Refinancing is becoming a real story, having almost relentlessly risen since rates cratered 4 months ago, and is beginning to approach its highs from ! 1/2 years ago. Household debt is being delevered dramatically. This is a good sign for the future.

The ICSC reported same store sales for the week ending August 29 rose 2.8% vs. a year earlier, and also barely up +0.1% from the prior week. Shoppertrak, on the other hand, reported that "retail sales increased 5.4 percent for the week ending August 28 while sales slipped 4.6 percent versus the previous week ending August 21." A brief side note: there is a commenter who continues to repeat Mish's claim of survivor bias in same store sales. Aside from the fact that we have debunked this claim as to the census bureau data, readers may wish to ponder why the ICSC raw number tanked when Walmart pulled out of the survey.

Gas prices decreased $.02 to $2.68 a gallon, testing new lows since Oil peaked in April. At 9.386 million barrels consumed a day vs. 9.478 the same week last August, this is the first week in a while in YoY decline -- but 2009's number was an outlier, so I am not giving this much weight.

The BLS reported 472,000 new jobless claims, the second week back in its 8 month range. This time of year is the lowest "seasonal" layoff period, meaning unexpected layoffs get greater weight. With the census mainly unwound, and local school years having started, will we see declines in the weeks ahead?

Railfax once again showed substantial growth vs. last year in all 4 sectors: Cyclical, intermodal, baseline, and total traffic all continued to move significantly up, and intermodal traffic remains at new highs. Rail traffic seems to be an excellent real-time indicator of the economy, and has suggested that the downturn foreseen in the LEI beginning in April has already been happening. Rail traffic may now be telling us that the downturn in the private sector at least may be abating.

The American Staffing Association reported that for the week ending August 22, temporary and contract employment remained even at its two year high of 95.0.

M1 increased +1.3% in the last week, about 2.0% month over month, and up 5.0% YoY, so “real M1” is up 3.7%. M2 increased 0.15% in the last week, +0.5% month over month, and up 2.7% YoY, so “real M2” is up 1.4%. Real M1 remains a positive sign, while real M2 continues to counsel caution.

Weekly BAA commercial bond rates continued to drop, .05% more last week to 5.51%. If there are creditworthiness issues arising due to an anticipated "double-dip", they certainly aren't showing up here! BTW, this is confirmed by the fact the DJ Bond Index continues to make new weekly highs.

The Daily Treasury Statement ended August at $135.5 B vs. $126.4 B a year ago, a gain of $9.1 B or 7.4%%. For the last 20 reporting days, we are up ~4% vs. a year ago..

Bottom line: For the second week in a row, almost all of the weekly indicators were positive. Since April there have been a lot of weeks when the bear ate us, so we can be thankful that for a couple of weeks now, we have eaten the bear instead.
---

P.S.: A brief programming note. Although we are "closed" for the holiday, I may paste a tome on outsourcing and productivity if I don't party or sleep too much!

Whether you are a Doomer or a Happytalking Corporate Shill, enjoy your long weekend.

Mish has lost all credibility re State Sales Tax Receipts

- by New Deal democrat

I last blogged about Mish's accidental bottom ticking in early July, saying that The Emperor of Doom wears no Clothes, shredding his claim that retail sales gains were a mirage because, allegedly, state sales tax returns were still declining. Here's what he said then:
Month in and month out we hear the same nonsense about retail sales. I will believe it when I see state sales tax collections support the claims.
....
states have been reporting declining sales tax collections for the entire year.
Unfortunately for Mish's claim, checking state sales tax collection reports showed that in the second quarter almost all of them were increasing!

In rebuttal to a comment our reader Constant Learner attempted to leave on his blog, Mish cited an article from July 2009 w/r/t tax increases in many states that rose earlier in 2009. Any of those increases already in effect in May 2009 are equally applicable to both years and support the data I cited. He also cited a California article that references the many tax increases that took place beginning in April 2009. Again these are applicable to both years and so support my point.

Well, as Bonddad reported earlier this week, the Rockefeller Institute came out with its initial report on second quarter state revenues. Mish duly quoted them as follows (my emphasis):

Sales tax collections increased by 5.9 percent in the second quarter of 2010 compared to the same quarter of 2009, but were still 5.4 percent lower than two years ago. With 42 of 45 sales-tax states reporting so far, only seven states reported declines in sales tax collections compared with the same quarter last year.
To which Mish replied (without any reference to supporting data):
Much of the improvement in sales taxes is a result of tax hikes, not increased sales. Those effects will soon wear off in year-over-year comparisons
Note btw that Mish doesn't say tax increases are responsible for all of the improvement, just an undefined "much" of it.
So let's review:

1. Mish says that "I will believe [increases in retail sales data] when I see state sales tax collections support the claims."
2. The Rockefeller Institute reports that sales tax collections increased.
3. Mish discounts the Rockefeller Institute report, without citation to contrary data.

Mish has lost all credibility when it comes to state sales tax receipts.

And by the way, contrary to his last sentence, July state sales tax receipts don't help him out either. Here they are:

New York:
sales tax receipts up 7.7%
total tax receipts up 6.8%

Indiana
Indiana up 10% YoY in June

Texas:
Texas up 7.6% YoY

Tennessee"
Tennessee July up 5.94% YoY

Alabama
Alabama up 1.31%

Georgia:
Georgia up 2.4%
4.7% total tax revenues

California:
Calif up 1.2% YoY June (UPDATE: July up almost 20%)

Florida:
FL up 2.6% YoY in July

Ohio:
Ohio up 9.6% in July

New Jersey's data was unavailable.

Since both of the articles Mish cited two months ago dealt with tax increases that predated the second half of 2009, they don't apply, as previous tax hikes wouldn't affect YoY July numbers. I eagerly await Mish's attempt to discover tax hikes in those states that occurred after last July.

The Employment Report, Part II

From the BLS:

The duration of employment numbers were interesting:

Less than 5 weeks: -79,000
5-14 weeks: + 575,000
15-26 weeks: + 84,000
27 + weeks: -323,000

The increase in the 5-14 weeks is probably caused by the recent increase in initial unemployment claims. The decrease in the 27 + weeks in also interesting. However, at the current pace of job creation this months decrease will eventually move higher as the people who increased the 5-14 weeks number move out the time line.

In addition, we have the following revisions:

The change in total nonfarm payroll employment for June was revised from -221,000 to -175,000, and the change for July was revised from -131,000 to -54,000.


The pace of job creation was better than thought the last two months.

Average weekly hours stayed the same at 34.2
Average hourly earnings increased 6 cents
Average weekly earnings increased $2.05
The index of average weekly hours remained the same at 92.4

There is nothing in these numbers to get excited about. As I mentioned in the previous post, on a scale of 1-10 this is a 3.5.

The Employment Report, Part 1

From the BLS:

Nonfarm payroll employment changed little (-54,000) in August, and the unemployment rate was about unchanged at 9.6 percent, the U.S. Bureau of LaborStatistics reported today. Government employment fell, as 114,000 temporaryworkers hired for the decennial census completed their work. Private-sector payroll employment continued to trend up modestly (+67,000)


Let's start with the household survey.

The civilian, non-institutional population increased by 209,000. This is the denominator of several important macro statistics.

The civilian labor force increased 550,0000, for an increase in the labor force participation rate of .1%, increasing from 64.6% to 64.7%.

The number of unemployed increased 261,000, leading to an increase in the unemployment rate of .1%, increasing the level from 9.5% to 9.6%.

The number of employed increased by 290,000, for an increase of the employment to population ration of .1% or a rise from 58.4% to 58.5%.

The increase in the labor force tells us the more people moved back into the labor force. There are far too many reasons for this to ascribe a good or bad label to it.

It is important to remember that with the workforce getting older, we will start to see a decrease in the employment to population ratio and the labor force participation rate.

Let's move onto the establishment survey.

Total private hiring increased 61,000, 107,000 and 67,000 over the last three months. This is not an inspiring series of numbers and indicates that employers are extremely cautious about something.

Goods producing job gains stood at 0 as increases in mining and construction were offset by decreases in manufacturing. The decreases in manufacturing are consistent with the lower numbers we have been seeing in various regional manufacturing surveys over the last few months.

The service sector was responsible for all of the gains in the work force, accounting for 67,000 jobs. The bulk of these jobs came in the professional service category (+20,000) and education and health care services (+45,000). This number has printed at 60,000 and 70,000 for the preceding two months -- again, a very uninspiring series of numbers.

Government employees are responsible for the bulk of all the job losses for the last three months, as this category of employment has decreased by 236,000, 161,000 and 121,000 for the last three months, respectively.

On a scale of 1-10, I'd give this about 3.5. The private sector is hiring, but just barely. Manufacturing -- which led us out of the recovery -- is slowing and the service sector is having difficulty picking up the slack.

Yesterday's Market


Yesterday, prices gapped slightly higher at the open (a), and rode the EMAs a bit higher before consolidating gains in a downward sloping triangle (b). After breaking out of the triangle (c), prices rose again before consolidating again (d), and then rising into the close on increasing volume (e). This is the second day in a row that prices have closed near their daily highs.


Prices have moved through the 10, 20 and 50 day EMA, and are now right below the 200 day EMA.


Treasuries are right at critical support. A close below this level with downside follow-through would be very bullish for the stock market.


Yesterday prices gapped lower at the open (a) moved lower but with the MACD moving sideways a reversal shouldn't have been a surprise. Prices bottomed, rose a bit but in reality traded in a very tight range for the rest of the day.

Both the equity and bond markets are waiting for tomorrow's employment report. Both stand at important technical levels, ready to make important moves in either direction.


Oil had a strong rally yesterday (A). There were three strong advances (C) followed by areas of consolidation (B).


Gold continues its upward advance (A). Notice the bullish orientation of the EMAs (B) with the shorter above the longer and all moving higher. In addition, the MACD is still bullish (C). However, prices are nearing key areas of resistance (D).

Thursday, September 2, 2010

Quarterly Banking Profile, Part II

Let's turn our attention to loan quality:
Insured institutions added $40.3 billion in provisions to their loan-loss allowances in the second quarter. While still high by historic standards, this is the smallest total since the industry set aside $37.2 billion in first quarter 2008 and is $27.1 billion (40.2 percent) less than the industry’s provisions in second quarter 2009. Fewer than half of all institutions (41.3 percent) reported year-over-year reductions in quarterly loss provisions. Only 40 percent of community banks (institutions with less than $1 billion in assets) reported year-over-year declines. Reductions were more prevalent among larger institutions. More than half (56.2 percent) of institutions with assets greater than $1 billion had lower provisions in the second quarter.


The FDIC divides banks according to asset size, focusing on the lines between above and below $1 billion. Notice that over 50% of largest institutions had lowered loan-loss reserves. This is a good development as the US banking system is fairly concentrated. However, only 40% of smaller banks reported a drop in the loan-loss reserve, indicating this part of the industry is still under pressure.

Net charge-offs totaled $49 billion in the second quarter, a $214-million (0.4 percent) decline from a year earlier and the first year-over-year decline since fourth quarter 2006. Charge-offs were lower than a year ago in most major loan categories except for credit cards and real estate loans secured by nonfarm nonresidential properties. Charge-offs on loans to commercial and industrial (C&I) borrowers were $3.1 billion (37.0 percent) lower than a year ago, while charge-offs on real estate construction and development (C&D) loans were $2.7 billion (34.6 percent) lower. Charge-offs of one-to-four family residential mortgage loans were down by $1.4 billion (16.0 percent). Credit card charge-offs were $8.6 billion (86 percent) higher than in second quarter 2009. Most, if not all, of this increase was attributable to the inclusion of charge-offs on securitized credit card balances, which were not included in reported charge-offs in previous years. The change in reporting was the result of the application of FASB 166 and 167. In contrast, the $1.8 billion (107.2 percent) year-over-year increase in charge-offs of nonfarm nonresidential real estate loans reflected further deterioration in commercial real estate portfolios. Almost half (49.1 percent) of insured institutions with more than $1 billion in assets reported lower net charge-offs, while only 43.6 percent of community banks reported year-over-year declines.


The decline in charge-offs is also extremely good news, as is the breadth of the lowered charge-offs. This indicates improvement in the general loan picture.

The amount of loans and leases that were noncurrent (90 days or more past due or in nonaccrual status) declined by $19.6 billion (4.8 percent) during the second quarter. This is the first quarterly decline in noncurrent loans since first quarter 2006. Noncurrent levels declined in most major loan categories during the quarter. The sole exception was nonfarm nonresidential real estate loans, where noncurrents increased by $547 million (1.2 percent), the smallest quarterly increase in three years. The largest reduction in noncurrent loans in the quarter occurred in real estate C&D loans, where noncurrents fell by $5.9 billion (8.3 percent). This is the third consecutive quarter that noncurrent C&D loans have declined. Noncurrent C&I loans also declined for a third straight quarter, falling by $2.7 billion (7.3 percent), while noncurrent residential mortgage loans declined by $4.7 billion (2.5 percent) and noncurrent credit cards fell by $4.2 billion (19 percent). Slightly fewer than half of all institutions (48.9 percent) reported declines in their noncurrent loan balances during the quarter. Noncurrent loan balances fell by 5.3 percent at institutions with more than $1 billion in assets and rose by 0.3 percent at community banks.


This
decline in non-current loans -- both its occurrence and the breadth of its occurrence -- is very good news. It is important to caution this is the first decline we're seen in a few years, so some caution going forward is warranted (one quarter does not make a trend).
Total loan-loss reserves of insured institutions fell for the first time since fourth quarter 2006, declining by $11.8 billion (4.5 percent), as net charge-offs of $49 billion exceeded loss provisions of $40.3 billion. Almost two out of three institutions (61.7 percent) increased their loss reserves in the second quarter, but a number of large banks reduced their loss provisions, producing net declines in their reserve balances. In particular, some institutions that converted equity capital into reserves in the first quarter in accordance with the requirements of FASB 166 and 167 reported lower provisioning in the second quarter. Although the industry’s ratio of reserves to total loans fell from 3.50 percent to 3.40 percent during the quarter, it is still the second-highest level for this ratio in the 63 years for which data are available. The industry’s “coverage ratio” of reserves to noncurrent loans improved for a second consecutive quarter, from 64.9 percent to 65.1 percent, as the reduction in noncurrent loans slightly outpaced the decline in loss reserves.


Again -- these are are healthy developments.

Here are the relevant charts:

Notice the pace of quarterly charge-offs appears to be topping -- we've seen more or less the same level for the last 5 quarters.


Charge - offs are higher than loan loss provisons


The drop -- so far -- is only one quarter of data coming from a very high level. While this is an encouraging development, we need a few more quarters of data before declaring victory.


Non-current rates on residential mortgages appear to be topping, although at high rates.


These levels are sky high.


The non-current rate for larger institutions is dropping, but was also at a higher rate than that for smaller institutions. Also note the rate for smaller institutions also appears to be toppin.