Friday, November 16, 2012

Weekend Weimar, Beagle and Pitbull

It's that time of the week again. I'll be back on Monday and NDD will be here tomorrow.  Until then:


Yen Finally Looking to Move Lower

On Wednesday, I wrote the following about the yen:

The weekly yen chart shows that prices are at important levels.  After printing negative GDP, it's standard practice for the underlying currency to weaken.  However, the yen is also a key currency that is a primary safety trade and carry trade play.  As such, there's a decent bid for it. 

The yen has now moved lower.  Consider these charts:


On the daily ETF, the 122 price level was providing important technical support.  Prices moved through that level yesterday.  Also note that prices are now below the 200 day EMA, as are the shorter EMAs.  In addition, the EMAs are now bearishly aligned.


The weekly chart has printed a very strong candle on higher volume. 

Considering Japan is now facing its fifth recession in the last 15 years, they need correspondingly cheaper currency.  It looks like they're finally getting it.


Morning Market Analysis; Europe Barely Hanging On

The charts below of major European equity indexes have a great deal in common, which is why I'm presenting them together with a common introduction.  All have had some type of rally over the last six months.  In addition all are now either barely hanging on technically or moving lower. 


The German ETF rallied from a nit above 18.5 to 23.5 over the August to September time frame. PRices consolidated afterward and are now moving below the technically important level of 22.5.  The next logical stop is the 200 day EMA.


The Italian market rallied sharply during the summer, but is now barely hanging on at the 12 price level, which is also right at the 200 day EMA.


The Spanish ETF is right at the 200 day EMA as well, which is also a technically important price level.


The French market has been consolidating between 21 and 22.5.  Like the other charts, the 200 day EMA is looming large on this chart.


The British market has already broken trend and is resting on the 200 day EMA.  A break here would be a big technical development that would likely start the other averages moving lower.


Thursday, November 15, 2012

Weekly unemployment claims: don't panic, it's Hurricane Sandy


- by New Deal democrat

Initial unemployment claims jumped about 80,000 last week to 439,000. This is almost certainly an outlier due to Hurricane Sandy, which disrupted both the NYC and Philadelphia metro areas with a combined population of about 30 million people, or almost 10% of the entire country's population.

The exact same thing happened after Hurricane Katrina, which struck at the end of August in 2005. Here's the graph of initial claims starting with January 1, 2004:


See that spike of about 120,000 late in 2005? Those are the first two full weeks in September, right after Katrina. After that claims returned to their more typical readings.

This spike of 80,000 isn't quite so bad. If after a couple of weeks it hasn't returned below 380,000, then I'd be concerned. This week's increase isn't worth worrying about.

Germany's Weakening Economy

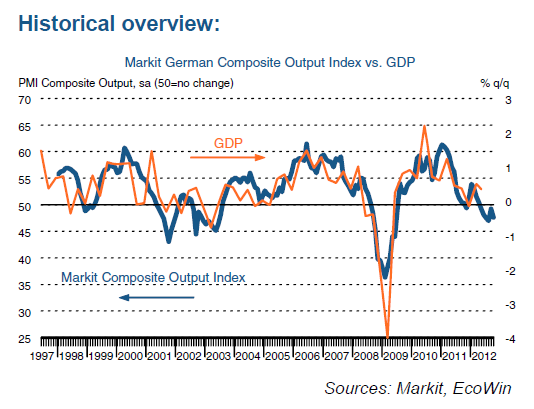
While most of Europe has been hit by the slowdown, Germany for the most part appears to have weathered the storm pretty well.  Until the last month, that is.  Recent statistics indicate the European stalwart is being bit by a slowdown.


The manufacturing PMI issued by Markit has been in contraction for most of 2020.  And while this number rebounded a bit over the year, the recent readings have been lower.  New orders are down, and new export orders dropped sharply.  Backorder work also decreased, indicating manufacturers may start running out of things to do, leading to layoffs.


And now, the services sector is following the manufacturing sector into contraction territory.   While the overall reading has only registered a negative number over the last three months, new orders have been dropping for 7.  Like the manufacturing sector, employers are focusing on their backlog of orders, which has fallen in each month since March.

Finally, consider falling industrial production:

A month-on-month fall in German industrial output, driven by a weakening manufacturing sector, and a sharp cut in European Commission growth forecasts on Wednesday exacerbated fears that the eurozone’s biggest economy is slipping closer to stagnation.

The seasonally adjusted 1.8 per cent month-on-month fall in industrial production was worse than expected and followed other data published by the German economy ministry on Tuesday that showed factory orders fell 3.3 per cent in September.

Here are the charts from the German Statistics Bureau:


Overall production has been stable for the last year, but we haven't seen a strong advance.  On the good side, there hasn't been a strong decrease, either, which considering the overall EU situation is pretty good.


The overall new orders number is also not encouraging.


Morning Market Analysis


It's best to view the three major equity markets (Russell, NASDAQ and S&P 500) in their totality to get a wider view of potential market direction.  The combination of the three charts shows that a sell-off is clearly underway and shows no hint of slowing.  The Russell and QQQs are both through all major fib levels with declining momentum.  While the SPYs have one ore Fib level for support, momentum is clearly to the downside.  In addition, both the Russell and NASDAQ are now below the 200 day EMA.


The weekly copper chart (top chart) is still in a triangle consolidation pattern, although prices are now approached critical support levels.  The 43 price level is critical to this chart; a move lower would obviously be bearish for this individual market, but for the economy as a whole.  The broader industrial metals market (lower chart) is in the same technical boat; prices are trading near multi-year lows.


The oil market is still consolidating in a downward sloping pennant pattern.


Wednesday, November 14, 2012

Japan's Big Problem

There have been several long articles printed over the last few weeks about Japan's economy, all of which focus on the fact that they are about to enter their fifth recession in the last 15 years.  More importantly, consider this chart of nominal GDP

As the country hasn't had any inflation in over 10 years, so the nominal number is actually pretty representative of their economy as a whole.

Put another way -- the Japanese economy hasn't meaningfully grown in nearly 20 years. 

Why Aren't Central Banks Cutting Rates?

Last week saw a flurry of central bank action in Australia, the United Kingdom, the EU, Malaysia and South Korea.  Yet,  none of these banks lowered their respective rates.  True, some of these banks (the UK for example) have no room to lower rates.  And others (the EU) are counting on a broader set of programs to help the economy.  But considering the overall economic environment, this overall lack of action seems a bit perplexing.  Let's delve deeper into the respective policy statements from each bank (such that some are) to get an idea for what these institutions are thinking.

South Korea:

The Reserve Bank of South Korea saw a global economy that was weak, stating "The Committee expects the pace of global economic recovery to be very modest going forward and judges the downside risks to growth to be large, owing chiefly to the euro area fiscal crisis and to the fiscal consolidation issue in the US."  Domestically, the environment was just good enough.  Growth was fair, employment was rising a bit and inflation was tame.  However, "the Committee
anticipates that the negative output gap in the domestic economy will persist for a considerable time, due mostly to the prolongation of the euro area fiscal crisis and to the delay in recovery of the global economy." 

Overall, the bank kept rates at 2.75%.

Australia:

Internationally, the RBA saw a slightly brighter picture.  While the EU is clearly in a recession, the growth in the US and China is fair, albeit fragile.  While the domestic resource economy is strong, it's expected to peak next year -- and at a lower rate than anticipated.  Other areas of domestic demand are soft and the labor market is softening a bit.  Inflation is right at expected levels.

The bank kept rates steady at 3.25%.

Malaysia:

While international growth is weak, regional economies are expected to continue growth thanks to domestic demand.  The Malaysian economy will be supported by strong infrastructure spending and domestic demand.  Inflation is contained for now because of weakening global demand.

The bank kept rates at 3%.

UK:

"UK output has barely grown for a year and a half and is estimated to have fallen in both of the past two quarters.  The pace of expansion in most of the United Kingdom’s main export markets also appears to have slowed.  Business indicators point to a continuation of that weakness in the near term, both at home and abroad.  In spite of the progress made at the latest European Council, concerns remain about the indebtedness and competitiveness of several euro-area economies, and that is weighing on confidence here.  The correspondingly weaker outlook for UK output growth means that the margin of economic slack is likely to be greater and more persistent."

EU:

EU growth remains weak.  However, the statement highlighted short-term inflationary spikes largely caused by oil prices.  "On the basis of current futures prices for oil, inflation rates could remain at elevated levels, before declining to below 2% again in the course of next year."  Additionally, Draghi began the press conference by talking about inflation, indicating this may be a reason for not lowering rates further.  According to the Financial Times' Analysis, Draghi is attempting to use his inaction as a way to force governments to take action.  

Rates are currently at .75% and were not lowered.

So -- why no movement by any of these banks?

Two -- the UK and the UE -- have little downside room to maneuver in.   Rate cuts by these banks would largely be symbolic.  Additionally, both banks are hoping that non-interest rate measures would replace their inability to lower rates.  The other banks appear to be thinking that things are just good enough for now, thereby allowing them to keep their powder dry in the event of further weakness.


Bonddad Linkfest

  1. Ryan says urban vote is the reason for their loss (NYT)
  2. Republican leadership fight (NYT)
  3. Obama lays out second term agenda (WaPo)
  4. Youth support gay marriage, immigration reform and legalizing pot (WaPo)
  5. GOP needs to get immigration reform done now (WaPo)
  6. Japanese IP drops 8.1% YOY (METI)
  7. Russian GDP up 2.9% YOY (BB)
  8. UK prices up 2.7% in October (ONS)
  9. BOE lowers growth (FT)
  10. Brazil's container traffic points to slow growth (FT)
  11. What's going on? (BP)
  12. US retail sales down .3% (Census)
  13. Federal Reserve Minutes (FRB)

Morning Market Analysis


After bottoming from mid-September to Mid-October, the dollar has been creeping higher.  Now, prices are inching above the 200 day EMA.  Accompanying this move have is a rising MACD.  However, notice the CMF is hovering right around the 0 level, indicating the money flow is weakening.  The dollar is catching a bid from the safety trade caused by the weakening EU situation.


The Chinese market, which was in a two month uptrend, has broken trend and is now at support established in early August and September.  notice the uptick in volume over the sell-off, indicating traders are getting out of the market, at least for the short term.  In addition to price support the 50 day EMA will provide short-term support.


The daily chart of the Mexican market (top chart) shows that prices have broken trend and are now trading at levels established in July and August.  But the weekly chart shows that these levels have far more important technical significance, as they have been hit on several occasions over the last few years.  A move below these levels would make the 50 week EMA the logical technical target.


The weekly yen chart shows that prices are at important levels.  After printing negative GDP, it's standard practice for the underlying currency to weaken.  However, the yen is also a key currency that is a primary safety trade and carry trade play.  As such, there's a decent bid for it. 

Tuesday, November 13, 2012

Bonddad Linkfest

  1. Pelosi considers stepping down (WaPo)
  2. Presidential cabinet speculation (WaPo)
  3. EU recession threatens growth (Marketwatch) 
  4. Home Depot bears as housing market improves (Reuters)
  5. Shrinking Japan asks for more time (Reuters)
  6. Treasuries see US falling over fiscal cliff (BB)
  7. Japanese Consumers closing wallets (BB)
  8. The limits of orthodox monetary policy (Money Supply) 
  9. Global business confidence lowest since 2009 (Sober Look)
  10.  Positive housing news (Sober Look)

Corporate Bond Market Still Strong

As an aside, I wrote this piece on Sunday, so the charts do not include price action from Monday or Tuseday.  However, as most charts deal with weekly price movements, this really isn't a problem.

From the Financial Times: 

Investor inflows into bond funds have crossed the $400bn mark this year, underscoring the ravenous appetite for fixed income among pension funds and insurers. 

Bond funds tracked by EPFR Global, a data provider, attracted almost $10bn in the week ending November 7, extending what is a record-breaking year for the asset class. High yield, US and mortgage-backed bond fund inflows have all hit records, and emerging market bond funds are on track to do so. 

“With seven weeks of the year remaining bond funds are collectively well into record setting territory when it comes to attracting fresh money,” the data provider noted in its report. 

Some asset managers and strategists warn that there could be a bubble brewing in bond markets, as yields are pushed continually lower by the hunger for fixed income. 


Above are weekly charts for the Vanguard short (top chart), intermediate (middle) and long term (bottom) ETFs.  Notice they are all very strong. 

What Does the Fiscal Cliff Look Like?

From the Financial Times


The top chart shows the total amount of five areas while the bottom part shows the GDP impact of each. 

Morning Market Analysis


The homebuilders 1 hour chart (top chart) shows that prices formed a double top at the beginning of the month, but have been falling since.  The dialy chart (bottom chart) shows that prices have fallen through resistance around the 26 price level and continue to move lower.  Near term support is at the 50 day EMA and 24.5/25 price level.


Industrial metals -- which fell for most of October -- have bottomed around the 18 price level which provided technical resistance at the beginning of August.  Prices have been moving sideways for most of the month.  However, notice the buy signal we see on the MACD.


The daily chart of the Japanese ETF (top chart) shows prices have fallen through support.  But also not eh very weak MACD reading and inter-twined structure of the EMAs.  The weekly chart (lower chart) shows that prices are still consolidating in a broader downward sloping wedge.


The weekly chart of the Australian market (top chart) shows that prices have broken through resistance, but have lost upward momentum.  The daily chart (bottom chart) shows that prices are still moving higher, but at a decrease pace.  However, notice the weakening MACD picture, which shows that momentum is dropping. 

Monday, November 12, 2012

Bonddad Linkfest

  1. The GOP's electoral map problem (WaPo) 
  2. Senate begins talks on immigration reform (WaPo)
  3. Japanese economy shrinks .9% (Marketwatch)
  4. Japan nears fifth recession in 15 years (FT)
  5. US to overtake Saudi Arabia in oil production by 2020 (Marketwatch)
  6. Soybeans break technical support (Agweb)
  7. Corn and soybean production increased by USDA report (Agweb)
  8. India proposing to cut more red tape (FT)
  9. Anatomy of the fiscal cliff (FT)

Conservatives Reality Problem

From Forbes:

I don’t think it’s a coincidence that Team Romney’s polling cluelessness comes after years of conservatives demonizing pointy-headed academics, including scientists. On subjects like evolution, global warming, the biology of human conception, and even macroeconomics, conservatives have been increasingly bold about rejecting the consensus of scientific experts in favor of ideologically self-serving pronouncements. That attitude may have contributed to their loss of the White House in 2012. It will be much more costly for the country as a whole if it doesn’t change before the GOP next captures the White House.

.....

I think global warming is a more complex issue than some people on the left acknowledge. But rather than accepting the basic scientific reality of climate change and making the case that the costs of action outweigh the benefits, many conservatives have taken the cruder tack of simply attacking the entire enterprise of mainstream climate science as a hoax.

On macroeconomics, a broad spectrum of economists, ranging from John Maynard Keynes to Milton Friedman, supports the basic premise that recessions are caused by shortfalls in aggregate demand. Economists across the political spectrum agree that the government ought to take action counteract major aggregate demand shortfalls. There is, of course, a lot of disagreement about the details. Friedman argued that the Fed should be responsible for macroeconomic stabilization, while Keynes emphasized deficit spending.

There's a reason I continually pick on John Taylor's continual comparison of this expansion with the Reagan expansion: he should know better.  As a Stanford PHD and well respected economist, his statements should conform to provable reality.  Yet he continually argues that an expansion rooted in interest rate policy is directly comparable to a post financial crisis expansion when nothing could be further from the truth.  And his continual insistence on making the comparison should lower his position in public discourse such that he is no longer counseled for his advice.

This leads to a general problem with the conservative movement in general: facts which run counter to their beliefs are "created by liberals" and are therefore ignored.  The latest example of this is the CBOs study that tax cuts don't lead to economic growth.  This has been accepted in the economic world for some time.  Yet, Republicans complained and, as a result, the CBO withdrew the study to avoid controversy.  This is just the latest example. 

I've tried debating conservatives and frankly have now thrown in the towel.  The reason is simple: they live in an alternate universe where austerity and tax cuts lead to monumental growth, global warming is a liberal conspiracy and creationism is a valid scientific theory.  None of these things is even remotely true, yet you'd think each was in fact standard dogma.

Barry over at the BP had the best take on this:

5 Don’t live in a bubble. Large swaths of the conservative movement seem to live in a world of their own creation. The balkanization of media outlets allow people to read only that which they agree with. This selective perception and confirmation bias creates a self-reinforcing alternative universe. Facts don’t matter; data and science are irrelevant. You only hear exactly what it is you want to hear. 

Outlets like Fox News and pundits like George Will and Dick Morris were forecasting a Mitt Romney landslide. Don’t like the polling data? Create a site called “UnskewedPolls.com” to provide numbers you do like. As it turned out, UnskewedPolls was the least accurate polling aggregator this election cycle. If you spend most of your time rationalizing why the polls are inaccurate and the media are biased, you will probably be surprised at what happens next. As smart investors know, this sort of bias can be very expensive.

 It's great that this problem with reality is finally coming to bear.  Smashing it will, in the long run, greatly benefit our national discourse.  


Market Internals Are Looking Weaker

Consider the following charts of sector ETFs:


The weekly technology sector has broken a year-long trend line.  It also tried to break out of resistance over the last few months, only to fall back.  The MACD is declining and printed a weaker peak on the break-out and the CMF is declining and nearing 0.


The daily chart of the financial sector (top chart) shows that prices have broken trend.  Prices are now below the 10 and 20 day EMA (which are now both moving lower) as well as the 50 day EMA.  The CMF is weak.  On the weekly chart (bottom chart) notice that after breaking through resistance, prices have failed to rally higher.  In addition, last week sow a large bar printed on strong volume.

 
The consumer discretionary sector has broken trend as well, with a weaker MACD reading.  Last week saw a moderate volume spike.


The consumer staples sector's weekly chart is showing prices drop through support as well.  Prices are also below the shorter EMAs with an MACD that has given a sell signal and a weaker CMF.


The energy ETF -- which has been consolidating for over a year -- broke through resistance about tow months ago. However, the rally has failed and now prices are back within the pre-existing consolidation range.

The points from all the above charts is that no major market sector is rallying right now.


Morning Market Analysis

Last week, we saw the continued sell-off in the equities market.  After the election, the market turned its attention to a combination of the deteriorating situation in Europe and the fiscal cliff discussion in the US.  There is also concern about a somewhat lackluster earnings season.  As the equities market sold-off, we see money flow into the bond market in a classic flight to safety move.  


The 30 minute SPY chart (top chart) shows the 140.5 support level which prices broke on Wednesday.  The daily chart (bottom chart) shows that prices are still targeting the 200 day EMA in this sell-off.  Also note the continuing negative technical environment -- a declining MACD, negative CMF and declining EMAs.  Finally, notice the increased volume on the sell-off indicating the intensity of the decline is increasing.


Notice that two parts of the treasury curve have now broken through resistance and are moving higher.  All the remains is for the IEIs (3-7 year; top chart) to follow suit.  All three charts now have buy signals from the MACDs  and rising price strength.