Thursday, November 15, 2012
Morning Market Analysis
It's best to view the three major equity markets (Russell, NASDAQ and S&P 500) in their totality to get a wider view of potential market direction. The combination of the three charts shows that a sell-off is clearly underway and shows no hint of slowing. The Russell and QQQs are both through all major fib levels with declining momentum. While the SPYs have one ore Fib level for support, momentum is clearly to the downside. In addition, both the Russell and NASDAQ are now below the 200 day EMA.
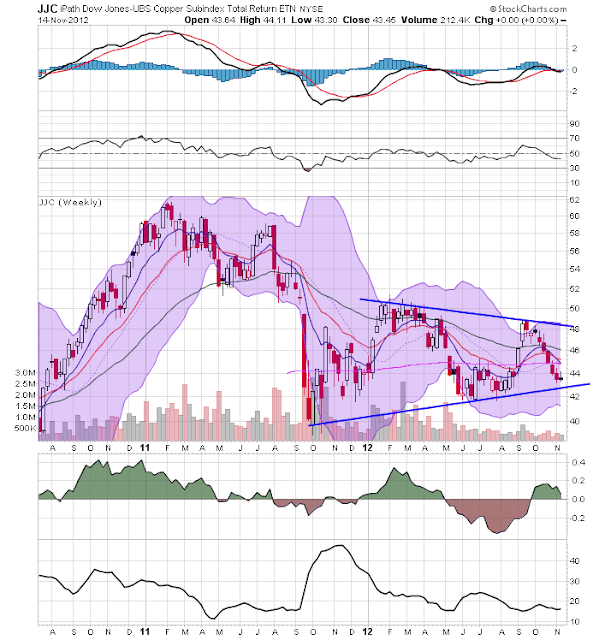
The weekly copper chart (top chart) is still in a triangle consolidation pattern, although prices are now approached critical support levels. The 43 price level is critical to this chart; a move lower would obviously be bearish for this individual market, but for the economy as a whole. The broader industrial metals market (lower chart) is in the same technical boat; prices are trading near multi-year lows.
The oil market is still consolidating in a downward sloping pennant pattern.


