Thursday, May 26, 2011

Mr. Luskin, PLEASE GO GALT

I detest Donald Luskin. He is intellectually lazy and shallow; his commentary is nothing more than oft repeated catch-phrases. Most importantly, if someone offered him the same amount of money to say the exact opposite thing I'm sure he would.

His new book is called "I Am John Galt." For those of you who are unfamiliar with what this means, here's a bit of background:

John Galt is a fictional character in Ayn Rand's novel Atlas Shrugged (1957). Although he does not appear in person until the last third of the novel, he is the subject of its often-repeated question "Who is John Galt?" and of the quest to discover the answer.

As the plot unfolds, Galt is acknowledged to be a creator, philosopher, and inventor who symbolizes the power and glory of the human mind. He serves as an idealistic counterpoint to the social and economic structure depicted in the novel. The depiction portrays a society based on oppressive bureaucratic functionaries and a culture that embraces stifling mediocrity and egalitarianism, which the novel associates with socialistic idealism. In the novel's ideology, the industrialists of America were a metaphorical Atlas of Greek mythology, holding up the Earth, whom Galt persuades to "shrug," by refusing to lend their productive genius to the regime any longer.

So -- the world becomes so oppressive that the people who created vast wealth stop contributing to it.

Mr. Luskin -- and I say this with all sincerity -- please go Galt! Stop writing stop appearing on TV, stop consulting -- please just go away. Take your ball and go home.

Greg Mankiw's Interesting Idea

Which is for the Fed to consider using the cost of labor as the preferred measure to determine Fed interest rate action.
This paper assumes that a central bank commits itself to maintaining an inflation target and then asks what measure of the inflation rate the central bank should use if it wants to maximize economic stability. The paper first formalizes this problem and examines its microeconomic foundations. It then shows how the weight of a sector in the stability price index depends on the sector’s characteristics, including size, cyclical sensitivity, sluggishness of price adjustment, and magnitude of sectoral shocks. When a numerical illustration of the problem is calibrated to U.S. data, one tentative conclusion is that a central bank that wants to achieve maximum stability of economic activity should use a price index that gives substantial weight to the level of nominal wages.
He also includes this chart:


I think it's an interesting idea.

The primary argument against this idea is it will penalize people for getting pay increases. However, remember that pay increases occur at the macro level for two reason: very low unemployment, which gives the job seeker more bargaining power when seeking a job, and high inflation, which forces people to ask for a raise to pay for the cost of living increases. In either case, there is obvious inflationary pressure in the economy that may require Fed action.

Wednesday, May 25, 2011

Thursday Oil Market Analysis

Last week, I wrote the following about the oil market:
So, a move below 96 is a good shorting opportunity. I would wait to go long at levels above 104; there is simply too much traffic below that level to get through to go long before that point.
Nothing has changed in my analysis this week:


Prices are using the 200 day EMA for technical support. The 20 and 50 day EMAs are moving lower, while the 10 day EMA has just moved sideways. Pay particular attention to the MACD, which appears to be ready to give a buy signal.

While I gave 96 as a shorting level least week, this week I would make it the 200 day EMA. In addition, I would still wait until prices moved about the 104 price level as this would get them above technical resistance and through the EMAs.

Richmond Fed Contracts

From the Richmond Fed:

Manufacturing activity in the central Atlantic region paused in May, after expanding during the previous seven months, according to the Richmond Fed's latest survey. The index of overall activity was pushed into negative territory by weak readings for shipments and new orders, while employment growth held steady. Other indicators suggested additional softness. District contacts reported that capacity utilization turned negative and backlogs fell further, while delivery times grew more slowly. In addition, manufacturers reported an uptick in finished goods inventory growth.

Despite the recent decline in activity, manufacturers were generally optimistic about their future prospects in May. Survey contacts at an increasing number of firms looked for solid growth in shipments, new orders, capacity utilization and capital expenditures over the next six months.

This is further evidence of a broader manufacturing slowdown taking place.

Consider this news in conjunction with the following:

Sentiment remains sour, with increased chatter of an economic “slow patch” addling investors. Late yesterday, Applied Materials added to that discussion when it reported robust second-quarter earnings — and then warned of sluggishness up ahead. Its shares fell 2% after-hours.

Technology stocks, like Applied Materials, have struggled throughout May amid a rising chorus of slowing business activity. Even storied Apple is flagging, its shares down 6% in the past month.

There’s a gnawing sense that folks faced with still-expensive gasoline aren’t splurging on fancy gadgets, or much of anything. Johnson Redbook reported Tuesday that retail sales fell 2.6% in the first three weeks of May compared with the previous month.

Reflecting the fretting about the economy, J.P. Morgan downgraded its second-quarter growth expectations to 2.5% from 3.2%. The main culprit: weaker auto production, largely due to supply disruptions caused by the March Japanese earthquake/tsunami/nuclear disaster.

Will Home Prices Fall Any Further?

There's been a great debate/discussion in the economic blogsphere between David Altig at Marcoblog, Barry Ritholtz and Calculated Risk about housing prices. The topic is simple: how much farther (if anywhere) do home prices have to fall? First, let me post the various graphs from the previously linked posts to show on what everyone is basing their argument.

From Barry:
Link

This was followed by a post from another economist named Paul Kasirel, who put up this graph:


He explained his analysis thusly:

“The chart below illustrates why I think owner-occupied housing on a national basis is cheap. The “yield” on owner-occupied housing continues to be above the cost of financing a home purchase. This is actually a rare occurrence. Of course, if the market value of owner-occupied housing were to fall more, all else the same, the purchase of a house would become even more attractive.”

In other words, the cost of buying a home is cheaper then the amount of get you get for the home. In other words, there is a bullish spread between the purchase cost and return on investment.

Barry continued with this point:

Might home sales pick up again in a couple of months? Perhaps, but I doubt it. I simply do not see any compelling reason for the marginal home buyer to make that purchase. By September, we will be fighting seasonal factors. The exception is the key bubble bust regions, where foreclosures are driving prices as much as 50% off the peak prices.

But I am unconvinced about prices in general. My problem with imputed rent is that it is not independent of demand for home purchases; Imputed rents interact with home prices, credit availability, pricing trends, employment, etc.

Indeed, one can easily imagine a scenario where: 1) Home prices are thought of trending lower; 2) Credit is tight; 3) Employment is weak; 4) Wages are flat. This would create an environment of relatively soft demand for home purchases (sending their prices lower) At the same time, this would increase demand for rental units.

Calculated Risk added these two graphs:


And David Altig added this:

Simply going with the "where is a majority of the data" pointing approach (a remarkably unscientific approach), there is far more data pointing to the idea that the market is near the price bottom. Let me add two more charts:


While still very low, new home sales have leveled out for the last two years.

Existing homes sales have a median rate of around a 5 million annual rate (+/- 150,000 or so) -- even when you include the dislocations from the first time home buyer tax credit.

So, we have the following.

1.) A majority of information related to home prices indicates we're pretty close to a bottom

2.) The sales pace for both new and existing homes -- while low for new and while pretty low for existing -- has been at a pretty consistent pace, even when you include the tax credit distortions.

Going forward, I think prices are cheap enough to continue to bring buyers into the market. But, I don't think there will be a big pop in demand because of the overall macro situation. So, I think the current sales pace will continue barring an unforeseen shock and the prices may fall a bit more (say 10%-15%) but that if we're not at the bottom, we're pretty close.

Tuesday, May 24, 2011

Wednesday Commodity Round-Up

Today, I again want to look at copper, but largely because of an article from yesterday's WSJ:

Dr. Copper is feeling under the weather. But will his ailment prove fatal?

The charts don't look good for the metal widely regarded as having a Ph.D. in economic forecasting. Monday's 3.1% fall in the Comex front-month copper contract, to under $4 a pound, pushed it back below the 200-day moving average, a closely watched support level. Worse, the shorter-term, 50-day moving average has been dropping pretty steadily since late February. The dreaded "death cross" looms, when the short-term average drops below the long-term one, portending sustained weakness.

Any prognosis must rely on more than charts, however. Copper's last death cross, just under a year ago, didn't bury the metal. By September, the 50-day average had moved back above the 200-day indicator, as copper entered a seven month bull run. By mid-February, the copper price had risen 54% and surpassed its 2008 peak at the height of the precrisis commodities boom.

That last run upward, however, coincided with a couple of things. First, the Federal Reserve's second round of quantitative easing, or QE, drove U.S. real interest rates decisively lower. By weakening the dollar and reducing the opportunity cost of holding nonyielding assets, this made metals a relatively attractive investment. Second, Chinese inventories of copper were restocked during the second half of 2010, according to Deutsche Bank estimates.

Copper's overall importance to the economy as a whole makes it a very important commodity -- and one who's price needs to be monitored.

The longer term (1 year) chart shows several pieces of important information. First, prices are right at the 200 day EMA. Secondly, prices have formed a down up down pattern that shows a fairly disciplined sell-off. This indicates there is no panic selling going on.

The shorter chart shows that all the shorter EMAs are all moving lower with the shorter below the longer. Prices are also right around the 200 day EMA, indicating there is a question about whether the market is going to move into bearish territory or remain bullish. Although the MACd has given a buy signal, it is still giving an overall weak reading, indicating there is little strong upward momentum right now.

Overall, this is a fairly weak chart, but it also shows a pretty disciplined sell-off, indicating the liquidation is pretty orderly. This looks very much like a "wait and see if the economy slows considerably" move.


Bank loans finally make a bottom

- by New Deal democrat

One of the refrains from the last few years has been that "Banks need to write off hundreds of billions of dollars of bad loans so that their balance sheets can be repaired and they can afford to loan money again" and until they started to increase loans, there could be no recovery.

Responses that banks loans always turned after a recovery was well underway:


fell on deaf ears. After all, that was just another "pretty graph."

Well, it appears that bank loans have finally made a bottom. This is the weekly graph of total loans and leases at commercial banks:


For the first time since the economy fell off a cliff in late 2008, total bank loans are at a new 13 week high (the 3/31/10 vertical scrape is due to a change in definitions). This 3 month period is the longest that bank loans have been flat since that time as well.

Commercial and industrial loans made their bottom last year. No guarantees, but it appears that total bank loans have finally made a bottom. Pretty graphs (which are just a convenient way to show data) kick Doomer a** again.

The Pied Piper of Doom is still a math-challenged buffoon

- by New Deal democrat

The Pied Piper of Doom claims he doesn't make "predictions," so to be fair, the following statement he makes this morning isn't a "prediction." It's a prediction:
[T]he fact of the matter is, barring some miraculous act of God in coming months, around half of all U.S. homeowners with mortgages (or, approximately 35% of ALL American homeowners—that’s somewhere in the neighborhood of 60-70+ million present and former members of the U.S. middle class) will be underwater (owing more on their homes than they’re worth) by the end of 2011. (Zillow’s telling us the number’s around 28%-29% as of Q4 ’10 and/or Q1 ’11; Rasmussen notes that more than half of the mortgageholders in the U.S. think they owe more on their homes than they’re worth, right now.... I believe we’re somewhere in-between, but well on our way to 50% of all mortgageholders being underwater, by some point later in the year.
[my emphasis]

If you actually bother to read Zillow's release they say that


More than 28 percent of U.S. homeowners with mortgages owed more than their properties were worth in the first quarter as values fell the most since 2008 ....

Homeowners with negative equity increased from 22 percent a year earlier as home prices slumped 8.2 percent over the past 12 months ....

Home prices were 33 percent below the July 2006 peak in February, according to the S&P/Case-Shiller Composite 20-City Home Price Index ....

The number of homes with negative equity rose to 16.2 million in the first quarter from 13.1 million a year earlier, Zillow said.
Experts quotes in the article expected housing prices to fall as much as 11% for the entire year of 2011, which is almost half over.

Let's do the math: according to Zillow, the ratio of underwater mortgaged households to decline in prices from peak was 22%:25%. Now it is 28%:33%. This is actually a fairly stable relationship of ~8:10, where 8/10% of homeowners go underwater for every 1% decline in prices off peak.

According to the Pied Piper of Doom, another 22% of homeowners are going to be underwater in their mortgages by the end of this year! (28% +22% = 50%). If the above ratio continues to hold, that means the Pied Piper of Doom is calling for a decline of another 25% in prices from peak in just the next 7 months!

This is patently ridiculous, and is triple or more the decline called for by the experts cited in the very article he highlights.

Meanwhile, in April Las Vegas had the highest number of house sales in five years.

P.S.: I know some readers don't like my ripping this particular blogger, but I reserve the right to go after him just as I go after Mish or Zero Hedge or any other math-challenged Doomer; and I know that some other readers also read him, still believing against all evidence that he has some credibility as a forecaster.

High Commodity Prices and the Slowdown

I believe one of the reasons for the current slowdown is high commodity prices. And while oil an gas get all the attention, I believe that food prices share a fair amount of the blame for the latest slowdown. As I noted a little over a week ago, the latest retail sales figures show that food spending is still increasing at the expense of other retail consumption.

So -- let's take a look at the long-term charts of the three grains -- wheat, corn and soybeans -- to see where we are in the price cycle.


Corn is near all-time highs.


Soybeans are near an all time high, but haven't made a strong advance this year and are currently consolidating.

Wheat is off from highs, and hasn't made a strong move higher all year.

However, consider this from Bloomberg:


Funds cut their bets on higher commodity prices by 15 percent in a week after the worst rout in two years, reducing positions in everything from copper to oil on mounting concern that global growth is slowing.

The funds held a net 1.23 million contracts across 18 U.S. commodity futures as of May 10, the lowest since July, data from the U.S. Commodity Futures Trading Commission show. The net-long position in crude oil slumped 13 percent in a week, while for copper it fell 59 percent and in silver 23 percent.


The Standard & Poor’s GSCI Index of 24 commodities fell 11 percent in the week ended May 6, the biggest drop since December 2008, as investors fretted about the end of monetary stimulus in the U.S., higher interest rates worldwide and Europe’s sovereign debt crises. At least two dozen nations and the European Central Bank raised rates this year, data compiled by Bloomberg show.


The “pressures that have been building in emerging markets in terms of inflation and rapid interest rate hikes, coupled with the end of the quantitative easing program in the U.S. plus what’s going on in Europe, we have a lot of uncertainty around the extension of aid to Greece, you put all that together, that doesn’t paint a very rosy picture,” said Francisco Blanch from Bank of America-Merrill Lynch.


“It’s not the end of the commodity bull market but it could take some of the steam off for a few months,” the bank’s global head of commodity research said in an interview with Susan Li on Bloomberg Television’s “First Up.”


Monday, May 23, 2011

Treasury Tuesdays

Last week I wrote the following about the Treasury market:
My analysis of the Treasury market has not changed. The market is moving higher, but keep the stops tight. Also remember that yields are dropping, and we're getting near levels when yields shouldn't be moving much lower without a change in the fundamentals. I'd still use 2.75 on the 10 year as the absolute lowest yields can go in the current environment.
Let's go to the charts:


On the longer term chart, notice that prices are now above key resistance areas and have a fair amount of room to run higher.


The shorter chart shows that with the exception of a dip to the 20 day EMA, prices remain in a strong uptrend. All the EMAs are moving higher and the shorter EMAs are above the longer EMAs. Prices are using the EMAs for support rather than resistance -- another sign of a rally.


The underlying techncals are pretty strong, with the A/D moving higher and the CMF confirming the inflow of money into the market. There is some weakness with the MACD, as it might be close to giving a sell signal.

The Treasury market is benefiting from concern about the stock market and the EU situation. Interestingly enough, there does not appear to be any concern on the part of bond traders regarding the budget situation in Washington. However, as I mentioned last week, remember that on the other side of price is yield. I would use 2.75% as the possible low on the yield front, but that's simply a decent round number to use.

It's important to remember that on the fundamental front, the Treasury market is the primary market to invest in right now. As such, it's benefiting from the increased concern about the economy and the EU situation.


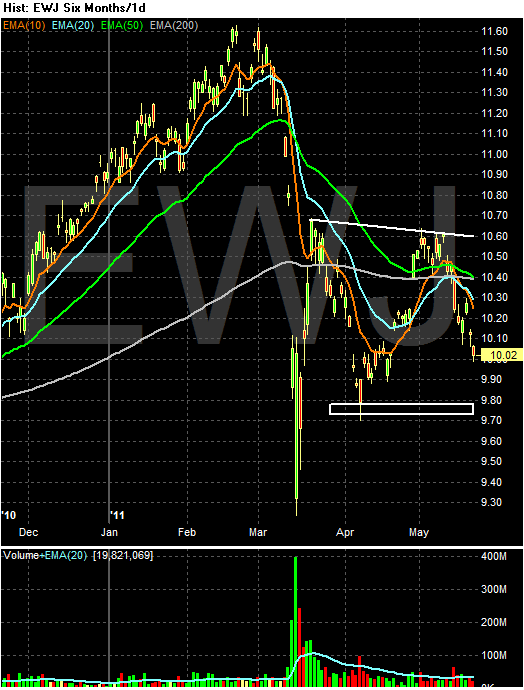
The Japan Effect


The huge drop down is obviously the earthquake. Since the, the market has been trading sideways. We have a triangle top forming, but the lower line of the consolidation pattern is still emerging -- and could go below support at the 9.8 area as well.

The point of this chart is to remind us that Japan is still digging out from an earthquake. This process will take some time. Additionally, Japan's economy wasn't doing that well to begin with.

Will There Be A Second Half Rebound?

Both NDD and I see a slowdown occurring right now. The question for both of us now is, will the economy snap back? Consider this articles reasoning as a possible answer to that question:


Stocks, commodities and other risky investments have sold off in recent weeks amid worries about slowing global economic growth. But the relatively tame downturn in stocks is evidence that many investors expect the rally to resume in the coming months.

These investors don't expect the market to match its powerful rally in the first four months of the year, when the Dow Jones Industrial Average was up 10%. Instead, they are betting that the economy will rebound from a sluggish patch and nudge markets higher at a more restrained pace.

The expected catalysts for the rebound are lower energy prices, caused in part by the slowdown itself, and gradual improvement the U.S. job market. In addition, corporate earnings and balance sheets remain healthy, which should provide support for both the economy and a floor for stock prices.

The optimism does have a deja vu feel about it. Call it the myth of the second half. Every year, no matter how the market does at the start, investors convince themselves their losses will be erased or their gains magnified by a strong second half.

.....

"The markets are asking the question as we see growth slowing, 'do we trace that into growth becoming negative or into growth slowing and then accelerating?' " says Noah Weisberger, head of macro equity strategy at Goldman Sachs Group. "Our core view remains that we reaccelerate, but until that becomes clear the markets may be worried."

Mr. Weisberger says slowdowns in the middle of economic recoveries are common, and Goldman has broken them down into three parts: deceleration, stabilization and reacceleration. Right now, the economy is still decelerating from its strong snapback at the start of the recovery. Mr. Weisberger is waiting for the shift from deceleration to stabilization, at which point Goldman will recommend that investors make riskier bets.

Until then, investors should be braced for whippy trading at least through midyear and acknowledge that riskier investments could fall further before recovering. The modest downturn in the face of bad news may itself make the market more jittery. The Dow Industrials are down just 2.3% in May even though they just finished their worst three-week stretch since last August.

The article hinges most of its argument on lower gas prices. This is in line with Professor Hamilton's research on the topic. However, prices will have to drop for a significant length of time -- that is, they must drop long enough to change consumer behavior.

State Revenues continue to surprise positively - and it's still not enough

- by New Deal democrat

Most state budgetary years run from June 30 to June 30, so we are rapidly approaching the moment of truth where we find out how badly states are harmed by the ending of federal assistance. Two months ago when I last looked at this issue, we only had data through the end of last year. It appeared that state budgetary problems, while bad, would not be quite as bad as originally feared. Now we have the final data through last December, preliminary data for the first quarter of this year, and at least some raw information about April. So let's revisit the situation.

The Rockefeller Institute released its quarterly report one month ago, saying:
State tax revenues grew by 7.8 percent in the fourth quarter of 2010, compared to the fourth quarter of 2009, according to Rockefeller Institute research and Census Bureau data. This is the fourth consecutive quarter that states reported growth in collections on a year-over-year basis. Forty-two states reported tax revenue growth during the fourth quarter, with nine showing double-digit growth.
Preliminary figures for January and February 2011 indicate further strength in state tax revenues this year. Overall collections in 45 early-reporting states showed growth of 9.5 percent compared to the same months of 2010, and 7.5 percent compared to the same months of 2009.
Based on the seasonally and inflation adjusted chart of real state revenues I prepared for my last article, which showed the first calendar quarter of last year 12.6% off the peak, and two years ago 12.8% off the peak, the January - March quarter of this year was around 3.1% to 5.3% below state revenues' April - June 2008 peak.

Newspaper articles from the last month strongly suggest that the positive surprise in revenue growth continues.

For example, in Kentucky,
The office of the state budget director reported ... that April's General Fund tax revenue grew by nearly 8 percent compared to year ago figures. That means total revenues for the month were $844 million - compared to $782 million in April 2010. Tax receipts have grown 5.6 percent for the first 10 months of the current fiscal year.
....
Road Fund tax revenues for April were $116 million, a 7.6 percent increase over April 2010 figures. Year-to-date tax receipts for fiscal year 2011 have increased by nearly 12 percent over last year.

“We are seeing improvement in the major taxes," Lassiter said. "The most recent interim outlook predicts collections to exceed the official estimate by approximately $95.7 million

In California,
State officials are reporting an unexpected $2-billion surge in tax receipts that will help lawmakers close the remaining $15-billion budget deficit, and the Capitol is humming with hope that more is coming.

In Massachusetts.
The Commonwealth of Massachusetts hauled in April tax receipts that were $580 million above expected estimates, according to a Massachusetts Department of Revenue announcement today.
....
Collections for April 2011 totaled $2.505 billion, up 43.4 percent from the same period last year.

In New Jersey,
David J. Rosen, chief budget officer for the nonpartisan Office of Legislative Services (OLS), told the Assembly Budget Committee yesterday morning that state tax revenues would be $913 million higher than Gov. Chris Christie anticipated in his March budget message. The surplus, he explained, comes courtesy of a huge two-year surge in income tax revenues, which would more than make up for a decline in corporate tax revenues in fiscal years 2011 and 2012.

In Nebraska,
economic forecasters on Thursday said they see improvements in the state's economy.
And they made their optimism official, projecting an increase in the overall amount of revenue the state will bring in the rest of this year and in the 2011-13 budget years.

Some of the board's positive outlook came from what the state Department of Revenue said it has seen since April 18 in individual income tax growth.

But there are other defining factors that the six members of the Nebraska Economic Forecasting Advisory Board considered in projecting an $82.5 million increase in revenue for this fiscal year, and a $146.5 million net gain to the state's bottom line in the two years after.

Even in Texas,
Lawmakers will have an additional $1.2 billion to spend during the next two years, Comptroller Susan Combs told state leaders Tuesday.
The revised revenue estimate will ease pressure on legislators working to craft a budget compromise before the session adjourns May 30. But it’s not nearly enough to eliminate dramatic cuts and layoffs across all levels of state government caused by a revenue shortfall that was initially projected to be $15 billion — or $27 billion when calculating the costs of maintaining services for a growing population.

Most of the higher revenue estimate comes from a dramatic rise in sales tax receipts during the past year. The high price of oil also has helped fill the state coffers.

Rather than simply parrot secondhand accounts, here is a chart of how April 2011 general fund revenues compared with one year ago and the peak three years ago for eight specific states I began following in 2009:

StateRevenue April 2011Revenue April 2010 % DifferenceRevenue April 2008% Difference
New York 6,948.4 5,341.6+30.1% 8,782.2 -20.9%
Indiana 1,673.3 1,684.7 -0.4%1,961.4 -14.7%
Tennessee 1,264.2 1,243.0 +1.7% 1391.9 -9.2%
Alabama 827.6 682.0+21.3% 840.7 -1.6%
Georgia 1,371.7 1,340.5 +2.3% 1,761.2 -22.1%
California 10,355.8 10,100.4 +2.5%16,231.9 -36.2%
Florida 2,612.2 2,516.6 +3.7% 2,358.5 +10.8%
Ohio 2,342.9* 1,988.2*+17.8%not available n/a

[*Unlike the other states, Ohio includes federal budget assistance in revenues statements. For purposes of consistency, these have been subtracted.]

The bottom line: state tax revenues continue to surprise to the upside. But it still won't be enough to avoid some real financial spending crises in a few particularly hard-hit states such as California and New York, where steep declines in personal income tax collections are responsible for almost the entire shortfall compared with 2008. Florida's gain over 2008 is no error - it has no personal income tax.

Sunday, May 22, 2011

Equity Week in Review and Preview of the Upcoming Week/Month

Last week, I wrote the following about the market:
In short, none of the other markets are giving us any hope for an upside break-out. I would treat the equity markets as currently consolidating we they wait to see what the overall economic direction is.
This week I've grown far more cautious and concerned about the market. First, defensive sectors are now outperforming more aggressive areas of the market. For the last week, health care (XLV), consumer staples (XLP) and utilities (XLU) advanced over other, more aggressive ETFs. The same is true over the last 30 days (I'll be touching on this issue later today in more detail). In addition, consider these longer charts of the averages:


The IWMs -- the riskiest of the largest averages -- have broken a long-term trend line. Remember, this average led the market higher over the last year or so.


There are two possible long-term trend lines with the SPYs. The lowest connects the lowest shadows of the two candles while the second, slightly higher line connects the low point of the bodies. Either way, the chart indicates the SPYs are in very touchy technical ground and need to be monitored closely.


The QQQs -- much like the SPYs -- are also at very touchy technical levels.

Let's take a closer look at some of the averages:


The SPYs have broken a shorter-term trend line. In addition, the 10 and 20 day EMAs are now moving sideways as opposed to higher, indicating slower upward momentum. The A/D and CMF lines show a lack of volume moving into the average and the MACD has given a sell signal and has continued to decline. Right now, the primary line of support is the 50 day EMA.


The IWMs have many features similar to the SPYs. However, take special note of the EMA picture, as the 10 day EMA has moved below the 20 day EMA. Also note that both the shorter EMAs are now moving lower rather than sideways.

In short, the technicals of the market are now signaling more caution signs. Important, long-term trend lines have either been broached or are currently very close to being broken. Underlying technicals (A/D, CMF, MACD) are weakening. This mirrors the issues with the fundamental economy right now, which is also showing signs of weakness. In short, I would not be looking for any long opportunities right now. If you've made money over the last few months, I'd take some profits off the table. And I'd also be looking for a shorting opportunity if it presented itself.

Saturday, May 21, 2011

Weekly Indicators: the slowdown confirmed edition

- by New deal democrat

This past week brought a spate of poor numbers, highlighted by the decline of -0.3 in the April LEI, only the second decline in 2 years. Housing permits and starts declined, as did existing home sales. Industrial production and capacity utilization also were flat or declined. The Empire State and Philly regional manufacturing reports were also substantially weaker (although both still showed expansion).

Turning to the high-frequency weekly indicators:

Oil finished above $99 a barrel on Friday. It still remains slightly above 4% of GDP. Gas at the pump leveled off for the third week at $3.96 a gallon. Gasoline usage at 9048 M gallons was 0.5% lower than last year's 9092. This YoY comparison has been negative for the last ten weeks in a row, but this week was relatively speaking the best comparison in close to two months.

The BLS reported that Initial jobless claims last week were 409,000. The four week average is now 439, 000. This is the highest 4 week average in half a year, although I expect it to abate in two weeks when the 478,000 weekly number rotates out of the average.

Railfax was up 3.6% YoY. The Baseline traffic 4 week moving average is up 1.07% from a year ago. Cyclical traffic is up 3.55%. Intermodal traffic (a proxy for imports and exports) is 5.11% compared with a year ago. On a 4 week moving average basis, YoY traffic percentage growth is at its low ebb for the last year. On a weekly basis, carloads are up 16,200 or up 2.2%, almost all of it intermodal traffic.

The Mortgage Bankers' Association reported a decrease of 3.2% in seasonally adjusted mortgage applications last week. It was only 1.7% lower than this week last year. Refinancing increased 13.2%, reflecting a decline in mortgage rates. The purchase series has been generally flat for close to one full year - compared with its previous relentless decline, a good thing. This graph from Mortgage News Daily shows that for the first time since the housing bubble burst, we may start to see positive YoY comparisons:


The American Staffing Association Index rose to 94, its second straight week of advancing after 12 weeks at the 90-92 levels. This advance is much like 2007 - slow growth, but not stalled.

The ICSC reported that same store sales for the week of May 14 increased 3.2% YoY, but declined -2.0% week over week. Shoppertrak reported a 8.3% YoY increase for the week ending May 14, and a WoW decrease of 6.8%, reversing last week's pre Mother's day gain. Weekly retail sales numbers have been a bright spot all year, generally showing the consumer not rolling over due to gas prices.

Weekly BAA commercial bond rates increased .01% to 5.83%. This yields of 10 year treasury bond, to the contrary, decreased 0.4% to 3.20%. There is a tinge of fear of deflation in the treasuries, and the slight increase in commercial rates is the first hint of any relative distress in the corporate market.

Adjusting +1.07% due to the 2011 tax compromise, the Daily Treasury Statement showed that for the first 14 days of May 2011, $98.2 B was collected vs. $95.1 B a year ago, for an increase of $3.1 B YoY. For the last 20 days, $130.4 B was collected vs. $127.0 B a year ago, for an increase of $3.4 B, or 2.7%. Use this series with extra caution because the adjustment for the withholding tax compromise is only a best guess, and may be significantly incorrect. Nevertheless the YoY gains have been very tepid in the last month.

M1 was down 0.1% w/w, up 1.7% M/M, and up 12.2% YoY, so Real M1 is up 9.1%. M2 was down 0.1% w/w, up 0.7% M/M and up 5.0% YoY, so Real M2 is up 1.9%. Although Real M1 is still strongly in the "green zone" where it has been since before the end of the "great recession," Real M2 has faded back into the "yellow zone" below 2.5%.

This week's data continued to show YoY weakness in most data. The slowdown is here. The price of Oil and the amount of fiscal fiscal constriction will determine the severity and length of the weakness.

Friday, May 20, 2011

You Are Here

This is the excerpt from the latest Fed Minutes about the current position of the economy:

The information reviewed at the April 26–27 meeting indicated, on balance, that economic activity expanded at a moderate pace in recent months, and labor market conditions continued to improve gradually. Headline consumer price inflation was boosted by large increases in food and energy prices, but measures of underlying inflation were still subdued and longer-run inflation expectations remained stable.

Private nonfarm payroll employment increased again in March, and the gains in hiring for the first quarter as a whole were somewhat above the pace seen in the fourth quarter. A number of indicators of job openings and hiring plans improved in February and March. Although initial claims for unemployment insurance were flat, on net, from early March through the middle of April, they remained lower than earlier in the year. The unemployment rate edged down further to 8.8 percent in March, while the labor force participation rate was unchanged. However, both long-duration unemployment and the share of workers employed part time for economic reasons were still very high.

Industrial production in the manufacturing sector expanded at a robust pace in February and March. The manufacturing capacity utilization rate moved up further, though it continued to be a good bit lower than its longer-run average. Most forward-looking indicators of industrial activity, such as the new orders indexes in the national and regional manufacturing surveys, remained at levels consistent with solid gains in production in the near term. However, motor vehicle assemblies were expected to step down in the second quarter from their level in March, reflecting emerging shortages of specialized components imported from Japan.

The rise in consumer spending appeared to have slowed to a moderate rate in the first quarter from the stronger pace posted in the fourth quarter of last year. Total real personal consumption expenditures picked up in February after being about unchanged in January. Nominal retail sales, excluding purchases at motor vehicles and parts outlets, posted a sizable gain in March, but sales of new light motor vehicles declined somewhat. Real disposable income edged down in February following an increase in January that reflected the temporary reduction in payroll taxes. In addition, consumer sentiment declined noticeably in March and remained relatively downbeat in early April.

Activity in the housing market remained very weak, as the large overhang of foreclosed and distressed properties continued to restrain new construction. Starts and permits of new single-family homes inched down, on net, in February and March, and they have been essentially flat since around the middle of last year. Demand for housing also continued to be depressed. Sales of new and existing homes moved lower, on net, in February and March, while measures of home prices slid further in February.

Real business investment in equipment and software (E&S) appeared to have increased more robustly in the first quarter than in the fourth quarter of last year. Nominal shipments of nondefense capital goods rose in February and March, and businesses' purchases of new vehicles trended higher. New orders of nondefense capital goods continued to run ahead of shipments in February and March, and this expanding backlog of unfilled orders pointed to further increases in shipments in subsequent months. In addition, survey measures of business conditions and sentiment in recent months were consistent with continued robust gains in E&S spending. In contrast, business outlays for nonresidential construction remained extremely weak in February, restrained by high vacancy rates, low prices for office and commercial properties, and tight credit conditions for commercial real estate lending.

Real nonfarm inventory investment appeared to have moved up to a moderate pace in the first quarter after slowing sharply in the preceding quarter. Motor vehicle inventories were drawn down more slowly in the first quarter than in the fourth quarter, while data through February suggested that the pace of stockbuilding outside of motor vehicles had picked up a bit. Book-value inventory-to-sales ratios in February were in line with their pre-recession norms, and survey data in March provided little evidence that businesses perceived that their inventories were too high.

The available data on government spending indicated that real federal purchases fell in the first quarter, led by a reduction in defense outlays. Real expenditures by state and local governments also appeared to have declined, as outlays for construction projects decreased further in February to a level well below that in the fourth quarter, and state and local employment continued to contract in March.

The U.S. international trade deficit narrowed slightly in February after widening sharply in January. Following a solid increase in January, exports fell back some in February, with declines widespread across categories. Imports also declined in February after posting large gains in January. On average, the trade deficit in January and February was wider than in the fourth quarter.

Overall U.S. consumer price inflation moved up further in February and March, as increases in the prices of energy and food commodities continued to be passed through to the retail level. More recently, survey data through the middle of April pointed to additional increases in retail gasoline prices, while increases in the prices of food commodities appeared to have moderated somewhat. Excluding food and energy, core consumer price inflation remained relatively subdued. Although core consumer price inflation over the first three months of the year stepped up somewhat, the 12-month change in the core consumer price index through March was essentially the same as it was a year earlier. Near-term inflation expectations from the Thomson Reuters/University of Michigan Surveys of Consumers remained elevated in early April. But longer-term inflation expectations moved down in early April--reversing their uptick in March--and stayed within the range that has prevailed over the past several years.

Available measures of labor compensation suggested that wage increases continued to be restrained by the presence of a large margin of slack in the labor market. Average hourly earnings for all employees were flat in March, and their average rate of increase over the preceding 12 months remained low.

The pace of recovery abroad appeared to have strengthened earlier this year, but the disaster in Japan raised uncertainties about foreign activity in the near term. In the euro area, production expanded at a solid pace, though indicators of consumer spending weakened. While measures of economic activity in Germany posted strong gains, economic conditions in Greece and Portugal deteriorated further. The damage caused by the earthquake and tsunami in Japan appeared to be sharply curtailing Japanese economic activity and posed concerns about disruptions to supply chains and production in other economies. Emerging market economies (EMEs) continued to expand rapidly. Rising prices of oil and other commodities boosted inflation in foreign economies. However, core inflation remained subdued in most of the advanced foreign economies, and inflation in the EMEs seemed to have declined as food price inflation slowed.

The Two Current Economic Issues

After reading a large amount of data, there appear to be two economic issues domestically that are indicators of the slowdown.

1.) Manufacturing. We're seeing one month slowdown readings from a variety of regional Fed indexes. We've seen weaker readings from Dallas, Richmond and Kansas City. This month, we've seen drops in Philadelphia and New York's readings. These readings are confirmed by the latest industrial production number from the Federal Reserve, which took a big hit from auto production decreases caused by Japan's earthquake.

2.) Initial unemployment claims: these spiked to very uncomfortable levels over the last few weeks, but have since dropped back to just over 400,000. We've heard continually that the increase was caused by one-time, seasonal factors. The latest drop adds some credibility to these thesis, but we're still not out of the woods.

I mention these points, because the latest leading indicators dropped by .3, with the drop caused by lower readings from a majority of the sectors.

Right now the incoming date continues to be mixed; the caution flag is still waving.

Thursday, May 19, 2011

Friday Dollar Analysis

Two weeks ago, I wrote the following about the dollar:

The dollar may be in a position for a technical rebound. Last week there was very little action lower, with prices instead moving in a rounding pattern. There has been a large volume spike over the last week, which may be the sign of a selling climax. Also note the gap higher today and the very strong candle print. There was a strong fundamental reason for the change of direction: dovish statements from the ECB regarding interest rates. I'm suspecting that some of today's action was also some short covering.

.....

The idea of a rebound trade does not mean that the fundamental downward trend that is in place is in any danger of being broken. Prices have still moved through important long-term support levels indicating a strong move lower is already taking place. What is happening is a simple "profit taking" of the shorts. Given the underlying interest rate and fundamental issues underlying each currency, I don't see any reason to the dollar is in danger of a strong rally at this point. But, if you're shorting the market, I would consider taking some profits off the table right now.

Then blogger went down, so I didn't post anything last week. Let's take a look at the chart to see what has transpired since then.


Basically, I felt the chart indicated we would see a technical trade with the dollar bouncing higher, but little change to the overall, underlying trend. So far, that is what has happened. The dollar caught a safety bid as concern over the EU situation made the dollar a more attractive asset. Prices have bounced up and hit resistance at the 50 day EMA and have moved a touch lower since.

The EMAs are sending the following signal. The shorter EMAs (the 10 and 20) are moving higher and the 10 has moved through the 20. Also note the 50 day EMA is now moving sideways. There is a fair chance we will see one of the shorter EMAs cross the 50 over the next few weeks. These are preliminary signals of a change, but one that is not confirmed yet.

However, take note of the longer trend:


The longer trend is still lower; the recent bump is (so far) a blip in the longer trend.

My general feeling about the dollar is the following:

Right now, we're in the middle of a technical bounce higher so far has not disrupted the overall trend. A strong move above the 50 day EMA over the next week or so will change that. In addition, if we see important technical crossings (the 10 or 20 moving over the 50) a re-evaluation will be necessary as well. However, if you played the technical bounce, I'd take money off the table now and wait to see how the market plays out. Ultimately, I'd still be looking for a longer shorting opportunity.

It's a long g****m tunnel

- by New Deal democrat

I realize I'm supposed to be a happy-talking, recovery-cheerleading, corporate shill, but I see no reason whatsoever to disagree with Atrios, this morning:
There are so many economic data releases, and they're all a bit noisy, so you can see good or bad news if you want. Still I think a reasonable distillation of it all is that even if the light at the end of the tunnel is just around the corner - though it may not be - it's a long goddamn tunnel. The unemployment rate is too damn high.
My biggest concern is that jobs and real household income will not even make it back to their pre-great-recession levels before the next one hits.

P.S.: Of course, Bonddad let the cat out of the bag this morning. We're really just econo-dorks.

My Favorite Blogs

We originally posted this last Thursday. But then blogger went down and we lost the post. As such, we're reposting this because there are some people who both NDD and I feel should be getting a wider readership and we would like to do our part to get it to them.

I don't think I've ever done this -- write a blog about what blogs we read on a regular basis. But I read a ton (which is one of the reasons I became a lawyer) so it seems appropriate to mention the blogs/analysts whose work I read on a regular basis as a grand hat tip.

Economists View: Professor Thoma posts a large amount of very thought provoking information on all things economic. More importantly, he does not post a few paragraphs, instead adding longer pieces that provide a fair amount of substance to a topic. I should also add he has been very helpful in making recommendations about economic books to read on certain areas.

DeLong: First -- he's a prolific writer, so there is almost always something of interest. But most importantly, he's one of the few economic writers who has actually read most economic thought (Say, Keynes, Mill etc..). In other words, he is pretty much the only person on the web who understands most of the arguments been advanced by all sides. At minimum this provides a great service to the web, but it also goes to show that there is a dearth of this type of understanding within the economics community. Finally -- fs there a topic that Brad DeLong does not know something about?

Carpe Diem: Dr. Perry posts some very pertinent fact based information regarding the economy. Ever the optimist, it's frankly good to have someone on the web who does see the good news that is around us (and yes, there is some). I should add -- there are times when he zooms into zombie like political commentary which I skip over.

Tim Duy's Fed Watch: I first learned about this site from Mark Thoma's site. Duy provides some great insight into what the Fed's public statements indicate about its internal thinking process. This is very informative, as I simply don't have the time to read all the public statements from the various Fed offices and presidents. Duy's writing is always sharp and very well organized.

StreetLight: Kash also posts at Angry Bear. Kash writes some of the best commentary on the web. His writing is lucid; his explanations clear. His recent analysis regarding the strength of US manufacturing was particularly good, although his work in general is top notch.

Afraid to Trade: Corey is without a doubt one of the best technical analysts on the web today. He never over plays his hand, but carefully weighs the chart data in a very even handed and fair manner. Additionally, he's a really nice guy who deserves all of his success.

Slope of Hope: Tim knight was one of the people (or perhaps the only person) behind the website Prophet.net -- which was literally the best technical website on the web. After he (or they) sold Prophet, he opened up this website. Tim posts charts and very good market analysis, along with individual trade ideas.

EconLog: I don't get the Libertarian perspective at all. But these guys explain it well. Their writing is clear and concise, beautifully organized and well-presented.

Sites to avoid: anything political that tries to write on economics. Just as an example from both sides of the aisle; the idiots at Powerline still argue that Thomas Sowell should be awarded a Presidential medal -- even though Sowell still argues for the application of Say's law despite this little event called the Great Depression making that argument more than moot. Daily Kos is dominated by the perma bear mentality which has completely missed the successful rebound of US manufacturing (which has accounted for about half of the growth during this recovery) and the recovery in its entirely.

Russ Winter is a another data hound, who has written some very good articles on China over the last about 6 months. He went behind a data wall a little bit ago, but has (thankfully) re-emerged.

A Dash of Insight -- run by Jeff Miller -- is another great site. First -- we thought we were the nerdiest blog on the net. Miller is very data driven and does a remarkable job of stripping out personal and political bias in his analysis. He is also very even-handed as he goes through the data, presenting a remarkable fresh view of the economy and the markets.

I'm adding this in a rush, so

Matt Trivisono

Dshort

Modeled Behavior

The Japan Effect

Consider the following chart from Dr. Ed Yardini's blog:

And consider these effects from the WSJ:


  • U.S. auto production slowed in April. “For the first time in 10 months U.S. manufacturing output fell in April, on account of a fall in auto production as the natural disaster in Japan disrupted the supply of auto parts,” the global macro team at the World Bank reports in its daily digest of economic news. “The disruptions to the auto sector are expected to linger through the second quarter thus continuing to dampen the contribution of that sector to overall industrial production growth in the US through the second quarter.”
  • Singapore’s non-oil domestic exports in April were down 1.8% compared with a year earlier, compared with a 9.9% increase in March. “Exports appear to be facing headwinds from the supply-chain disruptions associated with the calamities and, likely also, the impact of elevated oil prices on disposable incomes in advanced economies,“ said Leif Eskesen, India and Asean economist at HSBC. “Going ahead, we are likely to see more soft readings over the next few months for the same reasons, although the Japan-related supply disruptions are expected to be temporary and dissipate during the second half of 2011.”
  • Of course, the effects are strongest closest to home: Japan reported Thursday its economy shrank in the first quarter at a seasonally adjusted annualized rate of 3.7%. Two consecutive quarters of economic contraction is the shorthand definition of a recession. “The further contraction in GDP in Q1 confirms that Japan is now in recession and we expect the decline in Q2 to be even bigger,” says Capital Economics. “The economy was weak before the Great East Japan Earthquake struck on 11th March and the full impact of that catastrophe has only just begun to be reflected in the GDP data.”

Expect these effects to continue through as least the end of the second quarter, and probably well into the third.

Wednesday, May 18, 2011

Thursday Oil Market Analysis

Last week I wrote the following about the oil market:

The 5-minute page shows the drop, the rally along a slightly upward trend line and then yesterday's move through the trend.

Yesterday I mentioned that I am now a bit cautious on commodities. The reason is there is now evidence that some of the faster growing economics (Brazil and India) are slowing down. China's inflation rate is now higher than desired, indicating the PBOC will continue raising rates. And gas demand in the US is dropping as a result of lower prices.

At the same time, we're not crashing, just slowing. While the US economy printed a slow 1Q, there are no signs of a double dip. As such, I still see a very tight supply/demand situation.

Right now, I have no read on the oil market and would avoid it; there are simply too many wildcards in the mix currently.


Let's take a look at the current daily chart to see if new information is available.


The chart shows the very sharp drop-off, but also shows a consolidation pattern. There is support in the 96-97 area. There is also a possible triangle consolidation pattern emerging. But I'm personally no comfortable with that analysis, thinking a sideways, rectangle consolidation with a top at the 104 handle is possible. In addition, the EMAs are printing a bearish picture: all are moving lower and the shorter are below the longer. For now, I think this takes the wind out of a consolidating triangle with prices moving higher argument.

So, a move below 96 is a good shorting opportunity. I would wait to go long at levels above 104; there is simply too much traffic below that level to get through to go long before that point.

Link

The Great Untold Manufacturing Success Story

Consider this chart from Kash over at the Streetlight Blog:


Manufacturing has been a very bright spot for the economy during this recovery. However, it has largely gone unnoticed for two reasons. The political left is wedded to the idea that "US manufacturing is dead" while the political right doesn't want to point out any success story in the economy.

Yet, here we are, with manufacturing doing very well.

A succinct summation of a so-so recovery

- by New Deal democrat

With yesterday's releases of housing permits and starts, and industrial production and capacity utilization (all of which came in negative, defying positive expectations), now is a good time to take an overall view of growth in goods and services production and consumption.

Real retail sales, a proxy for consumption, show a 70% recovery from recession trough to the last peak:


Industrial production, despite its poor reading yesterday and downward revisions of the several months previous, still shows almost a 60% recovery in manufacturing from the recession trough to the last peak:


But residential construction, as measured by housing permits (a component of the LEI) are still scraping along the bottom of the trough:


It is difficult to say the least to have a high-flying recovery with such an important component of expansion completely missing. And that doesn't even count the Austerian stupidity that is requiring even more cutbacks in government spending at both the federal and state levels. (Reminder: almost half of construction workers are unemployed, we need several $Trillions of work done to efficiency-producing infrastructure, we can borrow at the lowest interest rates in our lifetimes to fund it, and there is not the slightest interest in Versailles in doing so).

Tomorrow (hopefully) I'll update the states' fiscal pictures.

The Economic Slowdown, Part III; Gasoline, Food, and Consumer Spending

The US consumer is facing several headwinds: a weak employment market and high gas and food prices.

Let's start with a chart of gas prices:


Notice that gas prices have sharply increased over the last 2-3 months. As a result, we've seen a decrease in consumer gas demand:


The chart above indicates that consumer demand for gas is dropping at fairly strong rates, especially considering the importance of gas to the economy.

While gas prices get all the headlines, higher food prices also hit consumers. As I've noted before, high year over year increases in food prices are -- like energy prices -- precursers to recessions, as demonstrated by this chart:


However, I also want to stress that we are not seeing YOY food price increases that indicate recession. They are, however, starting to move higher at a noticeable rate. As a result, consumers are cutting spending on non-food and energy items. Consider this chart from the latest retail sales report:


Food and beverage purchases increased 1.2% and gas purchases increased 2.7%. Remember these figures are not inflation adjusted, so the increase also reflects higher prices. But also note the decreases in other, non-essential categories: furniture is down 1.1%, electronics are down 2.2%, sporting goods are down 1.9% and clothing is only up .3%.

Also note that the percent gains for the same non-food and gas categories in the preceding month are strong, indicating that gas prices are just now starting to bite consumer spending.

With gas prices still high and food prices also increasing, the consumer will continue to feel the pinch and adjust his behavior accordingly. This is in addition to a very weak employment market, which, according to the weekly initial claims, is getting worse, not better.

Wednesday Commodities Round-Up

Today, I'm going to focus on copper. Copper is usually considered a leading indicator, because it's used in more or less everything made in the economy.

On the one year chart, notice that prices have moved through the long, upward sloping trend line established in early June of last year. Prices and EMAs are also bearishly aligned, with the shorter EMAs all moving lower and the shorter EMAs below the longer EMAs. Prices are right below the 200 day EMA, the line between bull and bear markets.

LinkThe six month chart shows a measured, down up down pattern -- that is, prices moved lower, rebounded, and then moved lower by about the same amount again. The latest move shows a more aggressive move lower, especially recently. Also note that prices are now using the 10 day EMA as technical resistance rather than support.

The trend break on the longer term chart is especially reveling about the market direction. The trend was in place move nearly a year, meaning it was very important to the market. Prices are also below the 200 day EMA -- a bearish development. Finally, as I demonstrated yesterday, international markets are slowing. These are the same markets that are a primary reason for the large increase in raw material prices over the last few years. As these markets slow, demand will as well.

Tuesday, May 17, 2011

So Much For the Municipal Bond Collapse

From the WSJ:

Municipal bonds hit a positive milestone Monday, with yields on some bonds retreating to levels not seen since the market began selling off sharply in November.

Yields for a benchmark of triple-A 10-year municipal bonds fell to 2.62% on Monday, according to Thomson Reuters Municipal Market Data, their lowest level since Nov. 10, around the time the selloff began. Yields move opposite to price.

The rally in municipal bonds has been a welcome one for the $2.9 trillion market. As investor confidence in municipal bonds fell, mutual funds focusing on municipal bonds have seen 26 consecutive weeks of outflows totaling $35 billion, according to Lipper FMI, a unit of Thomson Reuters.

But as muni-bond indexes have been flat or higher for 24 consecutive trading days, back to April 12, net withdrawals declined to $95 million last week, according to Lipper, the smallest single-week outflow recorded in the past six months. At the same time, key derivatives indexes that track the cost of insuring municipal bonds have improved.

The rally hasn't aided longer-term 30-year muni bonds as much as shorter-dated bonds. Yields on 30-year bonds stood at 4.36% Monday, according to MMD, down from 4.85% in April and a peak this year of 5.08% in January. But it is still above the levels of early November. That could pose continued problems for states and municipalities seeking to fund longer-term projects.

Empire State Down, But Positive

From the NY Fed:

The Empire State Manufacturing Survey indicates that conditions for New York manufacturers improved in May, but at a slower pace than in April. The general business conditions index fell ten points to 11.9. The new orders index declined five points to 17.2, and the shipments index slipped three points to 25.8. The inventories index climbed to 10.8, its highest level in a year. The prices paid index rose to 69.9, its highest level since mid-2008, while the prices received index held firm at 28.0. Future indexes continued to convey a high level of optimism about the six-month outlook, although prices are widely expected to rise.

.....

The prices paid index rose sharply, indicating that price increases accelerated over the month. The index advanced twelve points to 69.9, its highest level since mid-2008, with roughly
70 percent of respondents reporting price increases, and none reporting price declines. This index has moved up a cumulative fifty points over the past six months. The prices received index, at 28.0, was one point higher than in April; its rise over the past six months has paralleled the upward trend in the prices paid index. The index for number of employees inched up to 24.7, indicating that employment levels expanded over the month, and the average workweek index rose thirteen points to 23.7, a multi-year high.


Last month we saw three regional manufacturing indexes drop, so this month's data is especially important. While this number is still positive, it did drop. In addition, the prices paid number is extremely high, indicating this is an issue. Higher input prices may put downward pressure on hiring plans.

However, the optimism index is also very high, telling us that owners think the current issues are not altogether damaging to the longer picture.