Showing posts with label Treasury Market. Show all posts

Tuesday, April 26, 2011

Treasury Tuesdays

Last week, I wrote the following about the Treasury market:

I'm treating the current action as a consolidation range and would wait to make a trading move until after prices convincingly choose a direction. For the IEFs, that would be a move above 94-94.5 or a move below 92. For the TLTs, it would be a move above 93.5 or a move below 90.

Very little has changed to alter that opinion about the market. Let's start by looking at the IEFs:


Last week, prices clustered right about the 200 day EMA. The 10, 20 and 50 day EMAs are all moving higher, but are in a very tight range and are right below the 200 day EMA.


Looking at the underlying technicals, we see the A/D and CMF showing a slightly negative bias, but nothing to show a massive exodus from the market. The MACD has given a buy signal, but the lines are right around 0, indicating the EMAs are just crossing into a positive correlation.


At the long end of the curve, notice prices are finding strong resistance at the 200 day EMA -- they have hugged the line for the entire week.

The long end of the curve is still contained by the 200 day EMA -- a technically important development. In addition, the Treasury market is still in a trading range. Until we see a convincing move in either direction, I would not be trading this market.

Tuesday, November 3, 2009

Treasury Tuesdays


From a broader perspective, here are the broad parameters of the Treasury market.

A.) In general, prices are trading between two broad trend lines.

B.) A mini-rally started at the beginning of August. Prices have now broken through the trend line.

C.) There is a third trend line providing both support and resistance.


Looking closer at this chart we see:

A.) The EMAs are bunched together indicating an overall lack of direction for the market.

B.) Prices fell through support yesterday.

Treasury's are caught between a rock and hard place right now. The issuance calendar is huge which should be sending prices lower in a big way. Yet yields remain low by historical standards and there have not been any problems digesting the issuance so far.

Tuesday, October 6, 2009

Treasury Tuesday's


A.) There is a long term trend line in place that goes back to mid-2007.

B.) There are secondary trend lines in place that go back to 2008.

C.) The MACD has given a buy signal

D.) Prices are strengthening relative to recent levels


A.) An upward trend line started in early August

B.) Prices moved through key resistance levels by gapping up on strong volume. This is about the strongest move an issue can make.

Notice the EMA orientation -- all the EMAs are moving higher, the shorter EMAs are above the longer EMAs and prices are above all the EMAs.

This is a very bullish chart.

Tuesday, August 18, 2009

Treasury Tuesdays


The Treasury market is caught between two strong currents. On the down side is the large amount of issuance the US government will have to make over the next few years. Excess supply means decreasing prices and increasing rates. At the same time, the Treasury market is still the traders safe haven when the market drops.

The safe haven bid was in full display yesterday as the market dropped hard. In addition, the Treasury had some very successful auctions last week which allayed fear that there would be decreasing demand for US Treasuries. As a result the market caught a strong bid which has driven prices through resistance levels.

Notice that prices have run into upside resistance at the lower 90s level two times over the last few months. that means we're in an important area. A move through this level would probably signal further upside moves.

Tuesday, August 11, 2009

Treasury Tuesdays


Click for a large image

The treasury market has three big problems: a rallying stock market, massive supply and an increased risk appetite. All of these are adding to the downward pressure on the Treasury market.

Prices are currently in a downward sloping channel with a decreasing RSI and MACD. Also note the very bearish orientation of the EMAs -- the shorter EMAs are below the longer EMAs and all the EMAs are moving lower.

Also note the riskier parts of the bond market are rising.


Click for a larger image

The investment grade bond market is rallying, as is


The junk bond market

Given the supply coming onto the market, I would not expect a rally in the Treasury market.

Tuesday, July 21, 2009

Treasury Tuesdays

Click on all images for a larger image


The IEFs rallied from roughly mid-June to mid-July. But the rally hit upside resistance at the 200 day EMA. This is an important technical point because the 200 day EMA separates bull and bear markets. After hitting the 200 day EMA prices moved lower. Now notice that prices are below all the EMAs and the shorter EMA (the 10 and 20) are moving lower as well. In short, the IEFs have moved into a bear market stance.


The TLTs rallied from mid-June to mid-July but have since fallen as well. While they didn't reach the 200 day EMA they did break the uptrend started in mid-June. Prices are now below all the EMAs and the shorter EMAs are heading lower. In additon, the shorter EMAs are now below the longer EMAs -- a very bearish orientation.

Tuesday, July 14, 2009

Treasury Tuesdays


The long-term chart shows the Treasury market was in a long-term rally starting in mid-2007. This was a direct result of the credit crunch, as investors sought safe assets during the turmoil. Now that things are mellowing a bit we've see a sell-off in the Treasury market. However, notice that while the RSI and MACD have been declining for most of the year they are both in a position for a technical rebound. In fact, the MACD is currently making a turn to a more bullish orientation.


The IEFs have rallied for about the last month or so. However, notice they are doing so on decreasing volume. This is usually a sign that the market is about to turn because it indicates the degree of excitement about the security is decreasing. However, we also have two technical indicators that are saying the market will move higher. Finally, prices are also above the 10, 20 and 50 day EMA, the 10 day EMA has crossed over the 50 day EMA and the 20 is about to follow. Aside from volume, this chart says we're going higher.

Tuesday, July 7, 2009

Treasury Tuesdays

Click on all images for a larger image


The longer end of the curve has been rallying for about a month. However, prices are just now starting to cross the upward sloping trend line. Also note that prices ran into upside resistance at the 50 day EMA. Also note the declining volume as the rally progressed -- which is not a good sign. However, the 10 and 20 day EMA are still rising and prices are still above the shorter EMAs.
The shorter end of the curve is (so far) consolidating gains below the the 50 day EMA. But like the TLTs, prices are getting squeezed between the shorter and longer EMAs, indicating something will have to give soon.

Tuesday, June 30, 2009

Treasury Tuesdays

Click on all images for a larger image


The Treasury market continues to rebound. Notice that prices have been rising since roughly mid-June. Also note that prices are above the 10 and 20 day EMA and are just below the 50. Also note the 10 day EMA is about to cross over the 20 day EMA -- another bullish signal. In addition,


The MACD is rising as is


The on balance volume -- indicating more people are moving into this security.

Tuesday, June 23, 2009

Treasury Tuesdays


First, it's important to note where we are in the bigger market cycle. Starting in mid-2007 when the financial sector really started to bleed, treasuries became a very popular investment. Notice the IEFs started to rally in mid-2007 until early 2008, then sold-off, then rose again at the end of last year. All of this was the result of the credit crunch. Simply put, investors started looking for safety and this is where they found it. Also notice the sell-off of the last few months has put prices near the middle of their 2008 trading range -- which occurred because of fear.


In last week's update, I speculated that the increased volume over the last few week's may be a selling climax and therefore the market may be rebounding. Higher volume is agood indicator of that, as is an extended more in one direction along with yields nearing 4%. Notice that prices appear to be forming a bottom -- or at least are leveling off before a further move lower (we won't know until prices move in one direction or the other).

There are some incredibly strong cross-currents in the Treasury market right now. On the down side we have a ton of issuance coming to market. There is also an inflation scare (which I believe is bunk). However, high yields during a low inflaiton environment is very attractive which is why I thought the 4% yield mark was very important.

Tuesday, June 16, 2009

Treasury Tuesdays

Is it time for a bond market rebound? Consider the following charts (click for a larger image):

Prices have been falling since the stock market started to rally. This is natural -- money is leaving the more conservative areas of the market and moving into riskier areas. However, also note the volume pick-up over the last few weeks. Is this a "selling climax" -- that is -- the last big move out of Treasuries before a move higher? Also consider...


The MACD has been dropping for some time and has now given a buy signal.

Tuesday, June 9, 2009

Treasury Tuesdays

Click on all images for a larger image


Let's start with a long-term view of the short end of the curve as represented by the SHYs. Notice this chart started to rally in mid-2007 -- right when we started to hear about financial problems. This part of the market continued to rally until early 2008 when it sold off only to rally again starting in mid-2008. Then it rallied until the end of last year when it started its current sell-off.

However, take a step back and simply notice that the last year and a half could be considered a standard reaction to extreme financial dislocation. That means the latest sell-off would be a return to normalcy.


Notice that much of what was written about the SHYs also applies to the IEFs. And again, that means the recent sell-off could be seen as a return to normalcy -- that is, we're getting back to a normal yield curve with non-"the world is falling apart" interest rates.


On the daily IEF chart, we are clearly in a bear markets. Prices have fallen through th e20 0day SMA, all the SMAs are moving lower, the shorter SMAs are below the longer SMAs and prices are below all the SMAs. Also note the 10 and 20 day SMAs have moved through the 200 day SMA and the 50 day SMA is about to move through the SMA.

Tuesday, June 2, 2009

Treasury Tuesdays

Click on all images for a larger image


There's been a fair amount of talk/analysis regarding the Treasury market's recent sell-off. The above chart is a 5-year chart of the IEFs (7-10 year treasury) which places the move far more in context.

Prices spiked in 2008 for a simple reason: the stock market was selling off. The SPYs went from 145 to 90 -- a drop of 38%. At times of panic, investors look for safety. This is what lead to the big move into Treasuries. In addition, at the end of last year and the beginning of this year there was continual talk of depressions and severe recessions. Also note the SPYs fell an additional 22% at the beginning of this year.

The recent Treasury sell-off started right around the time the stock market started to rally. In other words, what we're seeing in the Treasury market is a reallocation of assets from low risk to higher risk assets. Also note prices are still above the levels that existed in 2004-2007 when the economy was growing. This tells us that a further sell-off wouldn't be as large a problem as commentators are arguing.

Tuesday, May 26, 2009

Treasury Tuesdays


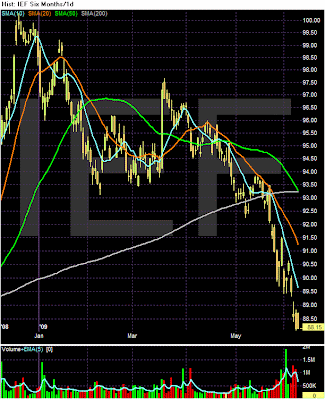
The Treasury Market rallied at the end of last year, but has since consolidated its gains and sold-off. Let's take a closer look at the sell-off.


Treasuries have been falling since about a week after the stock market started its early March rally. Since then prices have moved through all the SMAs. Now the chart has an incredibly bearish bent -- prices are below all the SMAs and the 10, 20 and 50 day SMAs are in their most bearish orientation possible (shorter below longer and all moving lower). Finally, prices are now below the 200 day SMA.

However, all is not lost in the bond market.


Money has been moving into the high yield market. Notice this chart of high-yield bonds started to rise about the same time as the stock market. Now it is in a very bullish posture -- prices are above all the SMAs (including the 200 day SMA), the 10, 20 and 50 day SMA are all moving higher, the shorter SMAs are above the longer SMAs and the 10 and 20 day SMA have moved above the 200 day SMA.


Like the high-yield market, the long-term corporate market also rose in conjunction with the stock market. Prices are above the 200 day SMA and are using the 20 day SMA for technical support right now. The 10, 20 and 50 day SMA are all moving higher and all three have also crossed over the 200 day SMA.

In other words, we've seen a reallocation funds within the bond market from Treasuries to longer dated corporate and junk issues.

Tuesday, May 19, 2009

Treasury Tuesdays

Click for a larger image


The Treasury market is now moving lower. Prices have broken through the lower line of a consolidation triangle and are flirting with the 200 day SMA. Prices rose from the sell-off but ran into upside resistance at the 20 day SMA. Also note the bearish orientation of the SMAs -- the shorter SMAs are below the longer SMAs and all the SMAs are moving lower.


The TLTs have a similar pattern except they broke through the 200 day SMA earlier. This illustrates a key point of market analysis: watch all four markets (equities, bonds, commodities and currencies) and watch the important subparts of each group. It may seem like a lot of information, but one you get use to it it can provide valuable insight into what is happening.

Tuesday, May 12, 2009

Treasury Tuesdays

Click on all images for a larger image


Last week, the Treasuries were right at the 200 day SMA. They are in the exact same place today. The primary different is

1.) Prices have dipped below the 200 day SMA and moved above the average since.

2.) All the SMAs are moving lower and the SMAs are now in a bearish position -- the shorter SMAs are below the longer SMAs, all the SMAs are moving lower and prices are below the 10, 20 and 50 day SMA.

So -- will the sell-off continue?


The on balance volume indicator tells us that people have been leaving the Treasury market since right before the end of last year. But


The MACD has been heading lower for awhile and is at an incredibly ow reading indicating we might be ripe for a reversal. In addition,


The RSI just crossed above a trend line. Aslo note the current reading shows increasing price strength.

The bottom line is there are good reasons for both directions right now. However, I would keep an eye on the stock market as it appears to be the primary driver right now. So long as stocks are moving higher I would expect the Treasury market to remain weak and vica versa.

Tuesday, May 5, 2009

Treasury Tuesdays


Click for a larger image

This is pretty much the final straw for me in arguing against the rally. Until now Treasuries have not sold off. However as the chart above clearly shows prices for the 7-10 year area of the market have fallen through support levels established from the consolidation pattern. Now the only technical indicator holding prices up is the 200 day SMA which is also the line between bull and bear markets. Finally, note that the SMAs are starting to form a bearish picture -- prices are below all the SMAs, the shorter SMAs are below the longer SMAs and all the SMAs are moving lower. This at a time when the Fed is buying Treasuries to prop up the market. That's pretty impressive.

I should add -- I still don't see the fundamental reason for this rally in stocks and sell-off in the bond market. There are still plenty of negative issues that have to be dealt with. But this is also a situation where you look at the chart in front of you, put blinders on and then continue trading.

Tuesday, April 28, 2009

Treasury Tuesdays


Click for a larger image

Little has changed with the IEF chart since last week; we are still in the middle of a triangle consolidation. Prices have been moving generally lower since mid-March, but the percentage drop is 2.76% which is hardly an exciting move. Note that prices and the SMAs are still in a tight range indicating a lack of conviction to move prices in either direction.


Click for a larger image

When prices are consolidating oscillators are better technical indicators. Therefore, it makes more sense to look at the stochastics right now. Notice that both the slow and fast stochastics are at the lower end of their technical range indicating a move higher from here is a bit more likely.

From a fundamental standpoint remember the following points:

1.) The Federal Reserve is buying Treasuries which will put a floor under prices.

2.) While the market has rallied since early March, Treasury prices have not had a huge drop-off. Considering the magnitude to the stock rally (over 25%) I would expect a sharper sell-off in Treasuries as traders reallocate funds. This isn't happening, adding further questions to the validity of the rally.

3.) The economic fundamentals are still extremely questionable. Despite the "green shoots are appearing" language we've heard, the fundamental picture is still murky at best.

Tuesday, April 21, 2009

Treasury Tuesdays


I posted the 6 month chart to show the IEFs are still consolidating in a triangle consolidation pattern. On the upside we have the Fed buying Treasury bonds which puts a de facto floor under prices. On the negative side we have (or perhaps had) a stock market rally that provided some downside pressure.


The three months chart shows that prices and SMAs are still in a tight range with no direction in either direction. The same factors that we had in the 6 month chart we have in the 3 month chart. The main issue is the Fed's buying Treasury bonds. So long as that program is in effect we have a floor under prices.

Tuesday, March 31, 2009

Treasury Tuesdays


The main issue in the Treasury market right now is the Fed's purchase of Treasury debt. That has placed a de facto floor underneath Treasury prices for the foreseeable future. The long bar (you can't miss it on this chart) occurred when the Treasury announced the plan. Since that announcement, prices have sold off to the 10 day SMA but are now using the 10 day SMA as technical support. In addition, the 10 day SMA has crossed over the 50 day SMA and the 20 day SMA has also crossed over the 50 day SMA.

It's important to remember that SMAs are coincidental indicators, meaning they occur at the same time as the event they are describing. If you want a moving average that is more predictive -- or at least more important relative to the current prices, use the exponential moving average:


Notice that on the EMA chart, the 10 and 20 day EMAs have already moved through the 50 day EMAs.