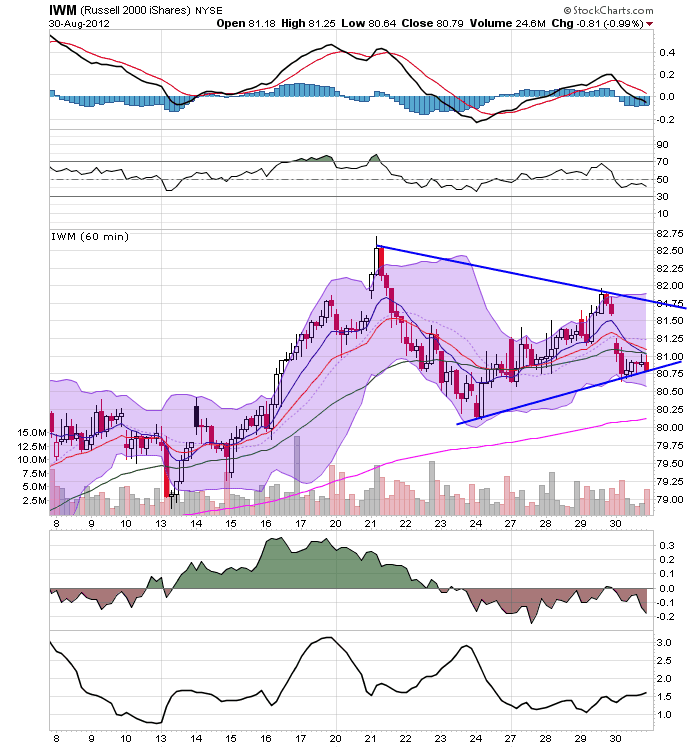


The above 60 minute charts show the US markets are consolidating. The IWMs (top chart) are in the middle of a symmetrical triangle consolidation. The QQQs (middle chart) have been in a tight trading range for the last two weeks. The SPYs (bottom char) are either in a triangle consolidation pattern for the last few weeks or a rectangle pattern for the last week.
Either way, traders are biding their time, waiting for ... something to move them one way or the other. However,

While the equity markets have been rallying, the transports have been stuck in a trading range between 88-94. This is flashing a big warning signal according to basic Dow theory.

The dollar remains at the 200 day EMA and at the lower end of its three month trading range.