Wednesday, June 5, 2019

The slowdown cometh UPDATED with link


 - by New Deal democrat

I submitted a long post on the above to Seeking Alpha. They haven’t put it up yet. When they do, I’ll link to it here.  UPDATE: Here’s the link.

Long story short: you all know that a year ago I forecast a slowdown by about mid-year this year. Everything except for portions of GDP and jobs has acted in accordance with that forecast.

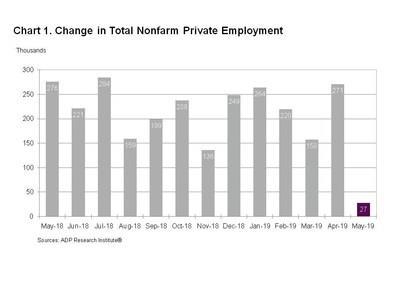
And, judging by this morning’s ADP jobs report for May:


the official jobs report may finally follow suit this Friday.

UPDATE: And Challenger Grey showed a large increase in layoffs during May:
U.S.-based employers announced plans to cut 58,577 jobs from their payrolls in May, up 46% from the 40,023 cuts announced in April, according to a report released Thursday from global outplacement and business and executive coaching firm Challenger, Gray & Christmas, Inc.
May’s cuts are up 86% from the same month last year, when 31,517 cuts were announced. So far this year, employers have announced 289,010 job cuts, 39% higher than the 207,977 cuts announced in the same period last year.

As usual, clicking on the link and reading should be informative for you, and help me out to the tune of a penny or two.

Tuesday, June 4, 2019

If your forecast relies solely upon housing, here is your problem


 - by New Deal democrat

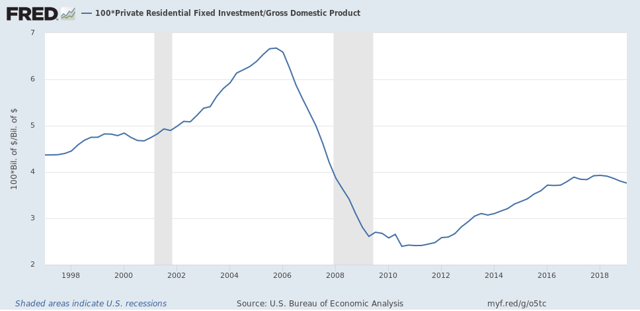
Back in 2006, Prof. Edward Leamer of UCLA made a splash with his paper, “Housing IS the Business Cycle,” delivered at Jackson Hole. It is an excellent paper, and one I have often made reference to. His preferred long leading metric, private residential fixed investment as a share of gross domestic product, is one I update every quarter and forms part of my array of long leading indicators.

Here’s what it looks like now, going back 20+ years: 


From late 2005 on, needless to say, it fell like a rock. But take a look at the late 1990s: it declined from a high of 4.84% in 1999 to 4.67%, or -0.17% - and then rose slightly - before the onset of the 2001 recession. 

Compare that with the past year: it has declined from 3.92% to 3.76%, or -0.16% - almost exactly the same decline as before the 2001 recession.

Now, there are other, steeper declines in this metric that did not give rise to recessions. But the point is, a decline almost identical to a decline in housing as we have seen since the end of 2017 has been consistent with a subsequent recession.

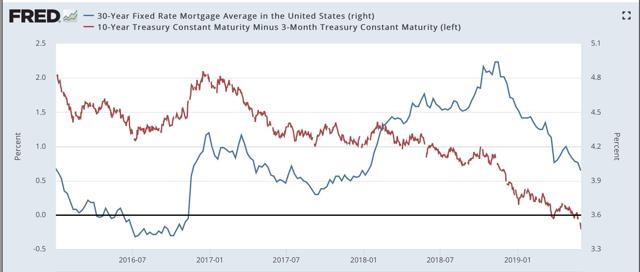
But, you say, mortgage rates have had a steep decline in the past six months, and indeed they have. Here’s a graph comparing mortgage rates (blue, right scale) with the 10 year minus 3 month treasury yield spread (red, left scale) since the beginning of 2016:


Mortgage rates have declined -0.95% from 4.94% last November through 3.99% last Friday, while the yield inversion as of the close yesterday was -0.29%.

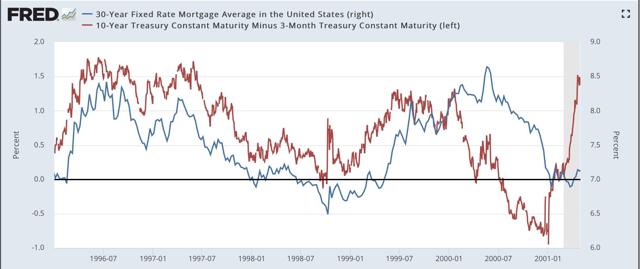
But that doesn’t solve the problem. Here’s the same graph from the late 1990s:


Mortgage rates declined -1.75% from 8.64% to 6.89% in 2000, while the yield curve inversion was roughly -0.75%.

In short, if all you are relying on is housing and mortgage rates for your forecast, then you completely missed the 2001 recession. And the status of housing, mortgage rates, and the yield curve looks very close now to what it did in 2000. In fact, the primary difference is in the yield curve, which hasn’t inverted so much or for so long a period of time.

This is why I make use of a model - actually, several concurrent models - that try to look at all the potential sources of an oncoming recession.

Monday, June 3, 2019

ISM manufacturing and residential construction spending trends continue


 - by New Deal democrat

May data has started out where April left off, with continuations of trends in both manufacturing and construction.

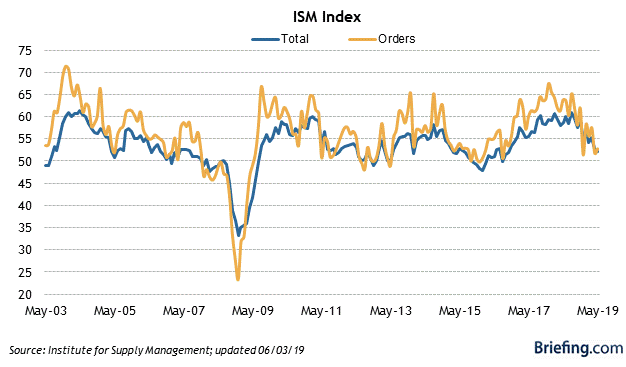
First, manufacturing: it is still expanding, but at a much lower rate than last summer’s red hot numbers. The overall ISM manufacturing index declined a bit to 52.1, but the leading new orders sub-index rose slightly from 51.7 to 52.7:


Looking forward to Friday’s employment report, the ISM employment sub-index also rose slightly from 52.4 to 53.7. This suggests that Friday will show an increase in the leading manufacturing jobs sector.

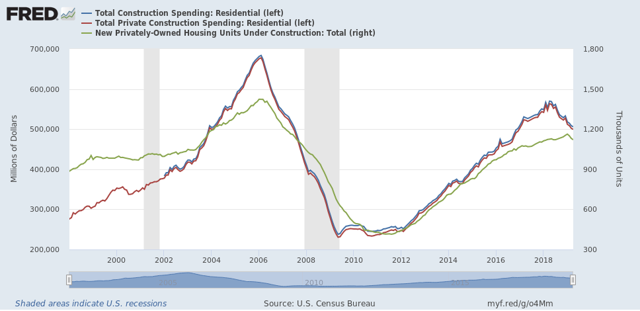
Turning to construction, reported for April, the leading sector of residential construction continued to decline. Below I show both total (blue) and private (red) residential construction:

While residential construction spending lags housing sales, permits, and starts, it is a much smoother series, and still leads the economy as a whole considerably. Also, the number of houses under construction tends to peak afterward (green in the graph above), and contemporaneously with that, residential construction employment begins to decline, as it did last month.

Thus I am expecting another decline in residential construction employment on Friday.

As I wrote two weeks ago, both the increase in jobless claims since Easter and the continued negative YoY readings in the American Staffing Index point to an increase in the unemployment rate and a decrease in temporary jobs in Friday’s report as well.

The sources of the next recession


 - by New Deal democrat

While we are waiting for the ISM May manufacturing survey and construction spending data to be released later this morning, both of which will give us important clues to Friday’s jobs report, let me write down some thoughts on the nerdy question I ruminated about this weekend: what is the most likely source of the next recession?

I should start by noting that I remain on “recession watch” for later this year, as in, a substantially heightened risk, due to enough of the long leading indicators turning negative by the end of last year. But my base case remains that there will be a slowdown without an actual recession, because those indicators haven’t gone down *enough* and some, like real M1 and some housing metrics, have already rebounded.

But I read a tweet over the weekend from a political source I respect, who essentially said, “housing’s fine, there will be no recession, end of story,” and, well, I was annoyed.

That’s because housing isn’t always the source of a recession, and occasionally, as in 2000-01, it doesn’t turn down very much at all. In fact, housing has turned down since the beginning of last year about as much as it turned down in 2000 - which didn’t prevent the 2001 recession, did it?

So what are other sources of recessions? Here’s my take:

1. Fiscal policies. Government imposes an ill-advised austerity. This was the main source of the deep 1938 recession, as the FDR Administration ended New Deal stimulus and pulled back on the reins. It’s pretty clear that austerity put a number of European countries back in recession earlier this decade. 

2. Interest rate policy. Big enough hikes in interest rates. This was the main source of the 1981-82 recession. Paul Volker’s Fed raised interest rates from 9% to 19% (!) in the year from July 1980 to July 1981. Lot’s of ordinarily leading indicators gave very little warning of the oncoming recession because of the speed and ferocity with which the Fed acted.

3. A price spike in a basic, non-substitutable commodity - like oil. This was the main source of the 1974 and 1979 recessions. In each case OPEC doubled the price of oil overnight, and in 1974 embargoed shipments to the US due to its support for Israel in the Yom Kippur war. The effect on both production and consumption of other goods and services was so immediate that many usually leading indicators didn’t even peak until after the recession began.

4. A producer-led recession, due to a hit to profits or the sustainability of production. This was the main source of the 2001 recession. When the dotcom bubble burst, lots of early internet and general tech companies went bust. Needless to say, production and employment both went down. Fortunately, in the wider economy producers weren’t leveraged very much, so the downturn was shallow.

So let’s turn back to our current situation. Do any of the four problems above exist?

Although the Fed has hiked rates by 2% or so over the last few years, and while yes that is a drag on the economy, in the grand scheme of things this isn’t very big. With inflation running at only 2% at the moment the Fed, if it chose, could lower rates without sacrificing either of its two mandates of price stability and full employment.  Also, there’s been no commodity spike — far from it, commodities are down over 10% in the past year (very much suggesting a slowdown in the *international* economy), and particularly no spike in the price of oil. Nor does it appear such a price spike is on the immediate horizon.

But Donald Trump’s tariffs and trade wars do fit into the first concern of fiscal policy. Even if one assumes the tariffs are a valid means to an appropriate end, they do come with a cost. That cost is paid by importers, and is shared between suppliers in the US, and their consumers. Suppliers, of course, will try to pass on the costs to consumers, but it is likely that there will be at least some decline in demand as a result, so suppliers are likely to bear at least some of the cost. I saw a note the other day that it is estimated that tariffs will add about $860 in costs to the average US household. That’s a little bit higher than a big hike in gas prices! 

And because producers must pay the import tariffs, and probably will not be able to pass on all of the cost, the remainder of the costs will come out of their profits. 

So sources of recession #1 and #4 are very much in play. But because the person in the US solely responsible for this - Donald Trump - is so impulsive and likes to deliberately create chaos, it is almost impossible to know ahead of time whether the impact will be enough to cause an actual economic downturn. 

On the other hand, since corporate profitability is very much at issue, using 2001 as our touchstone, paying extra-close attention to the producer side of the ledger via corporate revenues, profits, delinquencies and defaults, and credit and loan provision to companies looks like an excellent place to focus our attention. 

UPDATE: Two other comments. First, I don’t mean to imply that any of the recessions I discuss above were mono-causal. For example, it’s pretty clear that the spike in gas prices to $4.25/gallon in the first half of 2008 played an important role in the first half of that recession.

Second, I didn’t list over-leverage as a potential cause of a recession. Rather, leverage is what allows a bubble to exist. It does not *caue* a bubble to burst. Rather, once the downturn starts, the chaotic unwinding of leverage amplifies the downturn and causes it to spread via counterparty risk.
Saturday, June 1, 2019

Weekly Indicators for May 27 - 31 at Seeking Alpha


 - by New Deal democrat

My Weekly Indicators post is up at Seeking Alpha.

There was a touch of weakening across several timeframes. The economy is just weak enough that continuing trade and tariff tantrums could take a slowdown and do enough damage to make it a downturn.

As usual, clicking over and reading should be informative for you, and helps me just a little bit for the effort I put into the work.

Friday, May 31, 2019

Q1 corporate profits and real gross domestic income


- by New Deal democrat

Yesterday the second estimate of Q1 GDP came out, which means that corporate profits for Q1 were finally reported.

In my post earlier this week at Seeking Alpha, I wrote that corporate profits are of higher forecasting importance because of the contradiction in the signals being sent by the bond market vs. the housing market. So what light do they shed on the forecast for the next 12 months?

I wrote a follow-up post, and it is up on Seeking Alpha.  As usual, clicking over and reading should be informative for you, and helps to the tune of a couple of pennies for me.

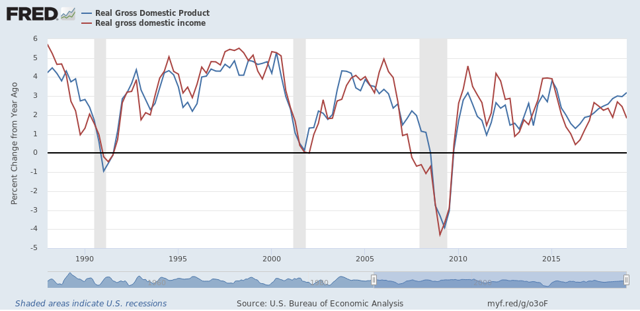
P.S.: As a bonus, another important Q1 metric, gross domestic income, was also reported in yesterday’s revision. There is some evidence that, when they diverge, GDI leads GDP. Here’s what that relationship looks like for the past 30 years:


Note 1989-90 and 2006-07. And finally, note that YoY real GDI growth has once again diverged sharply from real GDP, and is only up 1.8% through Q1.

Thursday, May 30, 2019

Initial jobless claims: still positive, but extra watchfulness justified


 - by New Deal democrat

Late last year, as initial jobless claims were rising off their September lows, I did some parsing of levels to watch for in terms of a change in the economic cycle.

Here’s the nut:
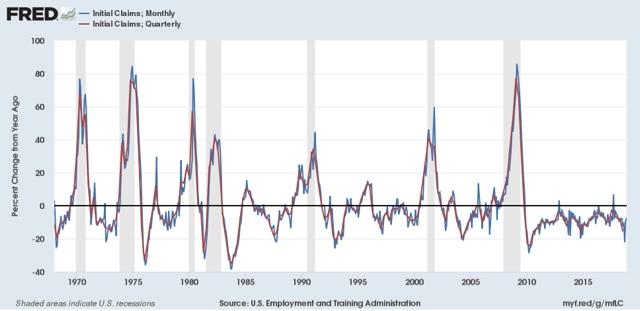
the simple fact is that there is almost always one or two periods a year where the four week moving average of jobless claims rises between 5% and 10%. About once every other year for the past 50+ years, it rises over 10%. Typically (not always!) it has risen by 15% or more over its low before a recession has begun. And a longer term moving average of initial claims YoY has, with one exception, turned higher before a recession has begun. 

A second way to parse signal from noise is to look at readings YoY.  With the sole exception of 1981, when the Fed was drastically raising rates, the number has always been higher YoY by the time a recession begin.
—-
So let me distill some signal from the initial claims noise: 

As to the four week average:
- at an increase of 10% in the four week average from its low, take notice
- an increase of 12.5% or more is a warning sign
- an increase of 15% or more almost certainly means a recession is close at hand

As to the YoY% change averaged monthly or quarterly:
- at a decrease of -2.5% or less, take notice
- a YoY increase is a warning sign, but there are many false positives

Here’s a graph illustrating that latter point:

——

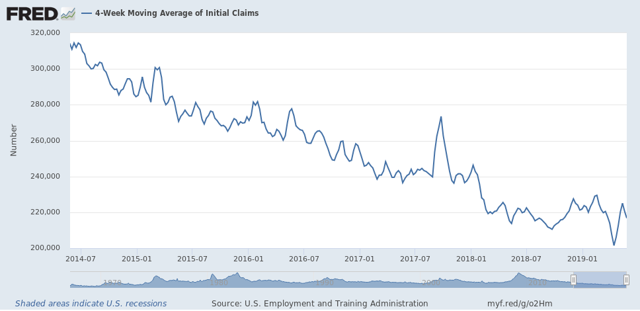
Now let’s turn to this week’s data. The four week moving average is 216,750, up 7.6% from its low of 201,500 in the weeks leading up to this year’s late Easter:


Although the levels are generally flat to slightly declining since February of last year, there’s no cause for concern here yet. 

The monthly YoY% change, however, is only -1.5%:


Since the beginning of this year, while remaining positive for the economy, the comparisons have been weakening - even with the 49 year lows in early April. We don’t have a warning sign at this point, but taking notice and being extra watchful is justified.

Wednesday, May 29, 2019

Resolving the contradiction between the yield curve and housing


 - by New Deal democrat

If you listen to the yield curve, it is screaming “recession!”  If you listen to new home sales, they are saying “no worries!”  One of them is wrong.

For the last couple of weeks, I have been going back over history in an effort to resolve the contradictory signals. One important portion of that work has been to focus on the non-financial leading indicators, and in particular, balancing the consumer stress indirectly measured by housing permits vs. the producer stress measured by corporate profits.

The outcome of  factoring corporate profits into the mix is telling. This work is up at Seeking Alpha. As usual, clicking over and reading helps reward me with a little $$$ for my efforts.

Tuesday, May 28, 2019

Trucking tops ailing rail (nerdy)


 - by New Deal democrat

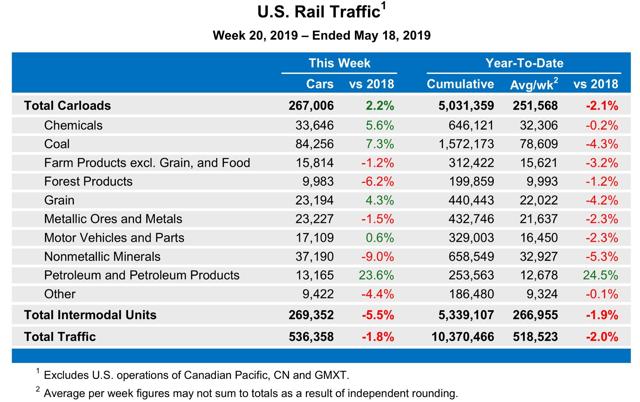
Since the beginning of this year, weekly rail volumes have usually been negative.  The full year to date volumes have also been negative YoY:


Since all manufactured goods have to be transported to market, if this is something confirmed in other transportation readings, it would clearly be recessionary - as in, a recession has already started.

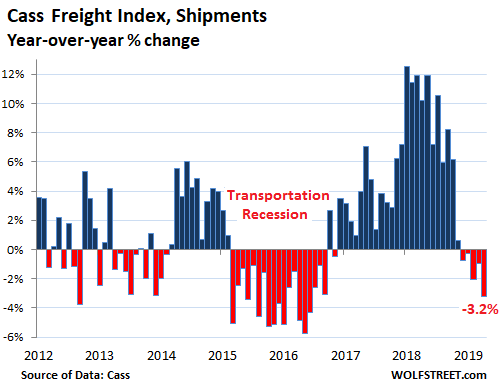
One alternative measure of the transportation sector is the Cass Freight Index. 


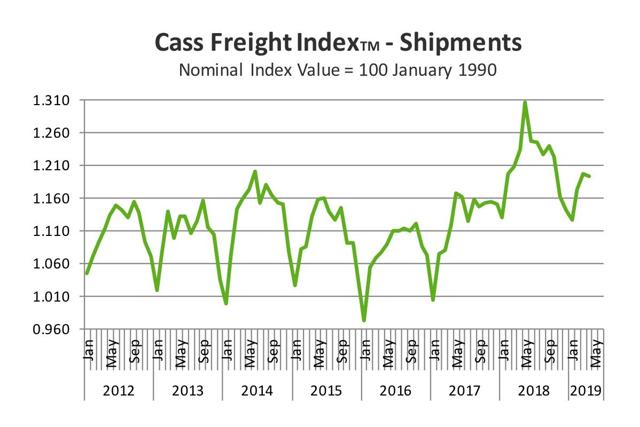
Although, interestingly, the primary reason for the downturn seems to be an anomalous surge that happened in late 2017 (due primarily to the hurricanes?) and went out of the YoY comparisons in late 2018, as shown in this next graph:


Note the seasonal downturn that typically starts to happen in about October, but never happened in 2017. As a result, on a 2 year basis, the Cass Index is up 7.0%.

Another issue with the Cass Index, however, is that it also measures international air and ocean shipping volumes for the U.S. So at least some of the downturn may be changes in international freight, perhaps due to Trump’s trade wars.

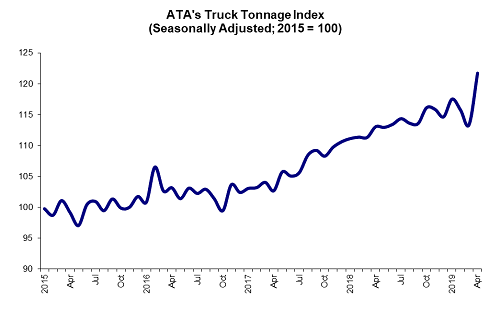
So I have been waiting for the April American Trucking Association Index. If domestic trucking is down as well as rail, that clearly looks recessionary. But if trucking is up while rail is down, that looks like a substitution, possibly due to competing costs, and/or possibly due to changed transportation patterns as western railroads suffer due to the widened Panama Canal increasing shipments directly to East and Gulf Coast ports.


 Here’s what it shows:


According to the ATA:

[the] seasonally adjusted (SA) For-Hire Truck Tonnage Index surged 7.4% in April after decreasing 2% in March. In April, the index equaled 121.8 (2015=100) compared with 113.4 in March. 
“The surge in truck tonnage in April is obviously good for trucking, but it is important to examine it in the context of the broader economy,” said ATA Chief Economist Bob Costello. “February and March were particularly weak months, as evidenced by the 3.5% dip in tonnage due to weather and other factors, so some of the gain was a catch-up effect. In addition, the Easter holiday was later than usual, likely pushing freight that would ordinarily be moved in March into April.” 
“I do not think the fundamentals underlying truck tonnage are as strong as April’s figure would indicate, but this may signal that any fears of a looming freight recession may have been overblown,” he said.
Even averaging April with March, however, the trucking index remains positive.

The bottom line is that the downturn in rail has not been confirmed by trucking, which continues in an uptrend.  This is real time evidence that while the economy may be softening, it’s not in an outright downturn.

Monday, May 27, 2019

Memorial Day 2019: let the enemy dead rest in peace


 - by New Deal democrat

Memorial Day was established as the day for both sides of the American Civil War to honor their dead. Today there will be many observances remembering those who made the ultimate sacrifice on behalf of the country. 

On a broader scale, the dignity - or not - with which a country allows the burial of its enemy’s ordinary soldiers and sailors also speaks to its values.

Here is the grave of two British soldiers killed at the Battle of Bunker Hill:


Here is the German war cemetery in LeCambe, Normandy, France:


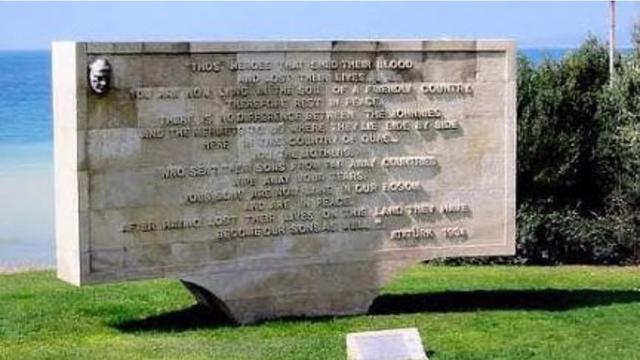
Here is the Anzac cemetery in Gallipoli, Turkey:


The plaque contained these words from Attaturk, the founder of modern Turkey:

“Those heroes that shed their blood and lost their lives…
You are now lying in the soil of a friendly country. Therefore Rest In Peace. There is no difference between the Johnnies and the Mehmets to us where they lie side by side here in this country of ours…
“You, the mothers, who sent their sons from faraway countries wipe away your tears; your sons are now lying in our bosom and are in peace, after having lost their lives on this land they have become our sons as well”

Or at least it used to. In June 2017 the current nationalist and Islamist leadership of Turkey had the plaque desecrated. Here is what it looks like now:


It is a bigger insult to the dead than if there had never been a plaque at all, and speaks poorly of the current regime in Turkey.

And, to return to the original purpose of Memorial Day, here is the graveyard of about 140 Confederates who died in a. POW camp in Madison, Wisconsin:


In the foreground is the plaque, “Confederate Rest,” speaks of “These valiant Confederate soldiers [who were] fighting under extremely difficult conditions” before being forced to surrender. Behind it is a larger monument as well as the individual graves. Here’s a photo of the monument:


The plaque was removed in 2017.

Overruling its Landmarks Commission, in 2018 Madison ordered the removal of the large monument as well, because on its base was the statement that it was erected by the Daughters of the Confederacy, and because it listed the names of the dead.

Whatever you think of the actions of Turkey you should also think of the actions of Madison, Wisconsin.

Sunday, May 26, 2019

The Western Hemisphere’s portion of the Arctic looks set for a record low


 - by New Deal democrat

Given Donald Trump’s view that global warming is a hoax, I am surprised that almost 2 1/2 years into his Presidency NOAA’s “Arctic Sea Ice” page is still with us. And since I am a nerd, during the spring and summer it is something I check.

In past years, sea ice melted much more in the Eurasian arctic at the extremities of the Gulf Stream than on the North American side. In contrast, the decline in ice cover in the North American sector of the Arctic is particularly advanced this year. Here’s what it looks like as of yesterday:

With the exception of Hudson’s Bay, it looks much more like the end of June for the past decade in that sector of the Arctic. In order, here are June 2018, 2017, and 2012


And for the Canadian Arctic (again aside for Hudson’s Bay), it isn’t even far behind mid-July of last year:
 

Of course, this pattern might not continue for the next several months. But if it does, we are probably going to set another record low for ice, at least for the Western Hemisphere’s portion of the Arctic. 

Saturday, May 25, 2019

Weekly Indicators for May 20 - 24 at Seeking Alpha


 - by New Deal democrat

My Weekly Indicators post is up at Seeking Alpha.

The big contradiction between what the yield curve is forecasting, and what most of the rest of the long leading indicators are forecasting, continues.  Meanwhile Trump’s tariff  “policies” are creating chaos in other sectors.

As usual, clicking over and reading should not only bring you up to date, but helps reward me with a penny or two for my work.

Friday, May 24, 2019

Economic indicator death match update: either bonds or housing sales are giving a false signal


 - by New Deal democrat

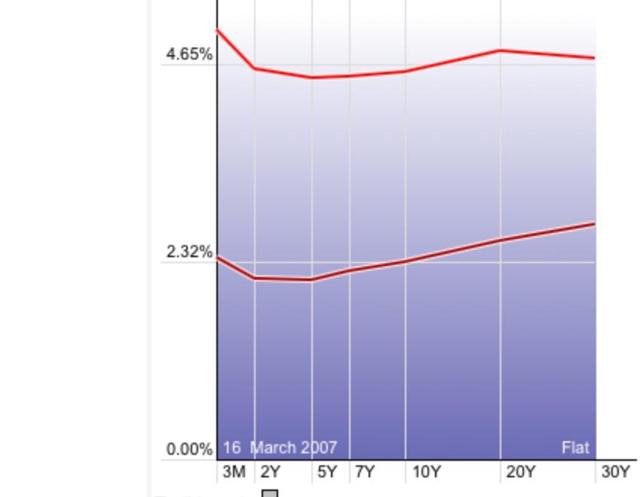
Yesterday featured the week’s sole important economic release: new home sales. But first, let’s update the inverted bond yield curve, which got more dramatic yesterday. The below graph compares the depth of the inversion yesterday (bottom) with March of 2007 (top):


With the sole exception of the 2 vs. 10 year spread, the yield curve is virtually screaming oncoming recession at this point.

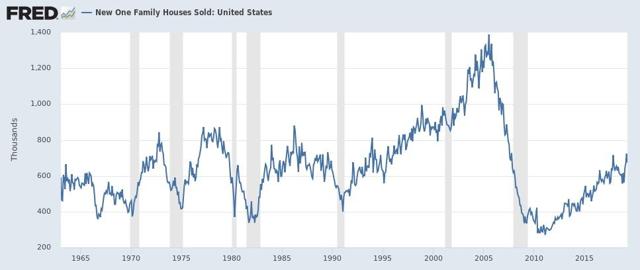
Now let’s turn to new home sales. As a refresher, new home sales are the most leading of any housing series, but they are extremely volatile and heavily revised. Yesterday they were reported down -6.9% m/m for April, but that wasn’t the important news, because March was revised higher to a new expansion high. As the below graph shows, only once in the past 50+ years have new home sales made their cycle low *before* the onset of recession - in 2000:


So, while it’s only one data series, just going by past history, yesterday’s report very likely negatives any recession in the near future, completely contradicting the bond yield curve.

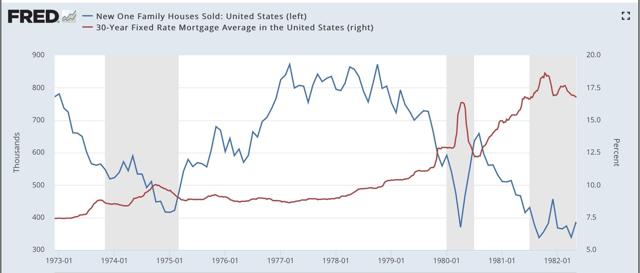
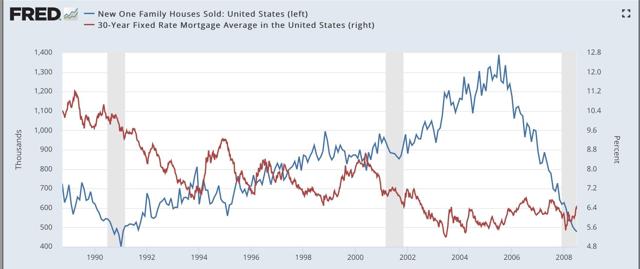
Of course, mortgage applications, and new home sales, have rebounded this year because interest rates have fallen from a peak of close to 5% last November to 4.1% this week. So in the below two graphs, I show new home sales (blue) vs. mortgage rates (red, right scale) since the latter series was started in 1971:


Mortgage rates didn’t decline at all prior to the 1980 recession, and declined only trivially in the month before the onset of the 1970 and 1981 recessions. They declined more significantly — -0.6%, -1.7%, and -0.8% — before the onset of the 1991, 2001, and 2008 recessions. In the cases of both the 1991 and 2008 recessions, housing still declined in part due to oil price shocks and in 2008 the unwinding of leverage in housing and the mortgage markets. The 2001 recession, by contrast, was a producer-led downturn, as the dotcom bubble imploded, so the mild upturn in housing was not enough to overcome it. Housing did turn down *during* the 2001 recession, as people got laid off, but did not match its 2000 low.

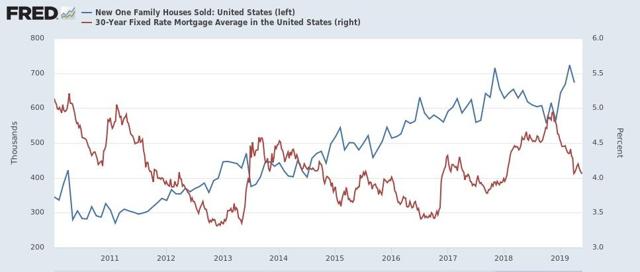
Now here is an update of the same data for this expansion:


The bounce in new home sales in the past several months has been much stronger than that of 2000.

The big fundamental question in the economy right now is whether the upturn in housing will be enough to overcome the downturn in corporate profits for the past two quarters.  In short, one of these two powerful economic indicators is giving a false signal.

Thursday, May 23, 2019

Initial claims, temporary staffing point to weaker May jobs report


 - by New Deal democrat

As I’ve noted a few times recently, I’m paying additional attention to the weekly jobless claims numbers, partly because I suspected that the late Easter this year resulted in some residual seasonality (which I think has been demonstrated), and partly because if my slowdown forecast is correct, it ought to start showing up there.

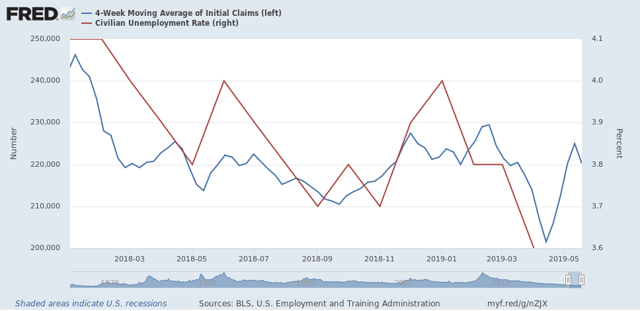
The initial claims report this morning covered the week during which the BLS surveyed employers for the May jobs report coming out in two weeks. In the four weeks that coincided with the April report, initial claims made new 49 year lows, averaging 201,500. In the past five weeks that will coincide with the May report, the average has been 221,500.

So, while this isn’t precisely on point, here’s a graph of the four week moving average of claims (blue, left scale) vs. the unemployment rate (red, right scale):


I don’t think it was a coincidence that the unemployment rate fell to a 50 year low during the four week period that initial claims made 49 year lows. And I strongly suspect that the June report will take that back, with an unemployment rate of 3.8% +/-0.1%.

If that happens, it will be significant, because a 3.8% unemployment rate would be exactly what the rate was 12 months previously. And a YoY unemployment rate that has not improved has only happened once during this expansion (September 2016, right before the election).

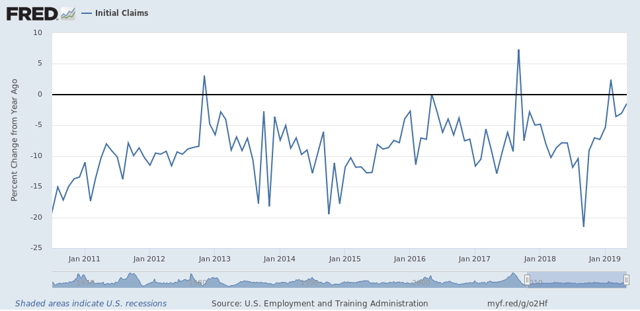
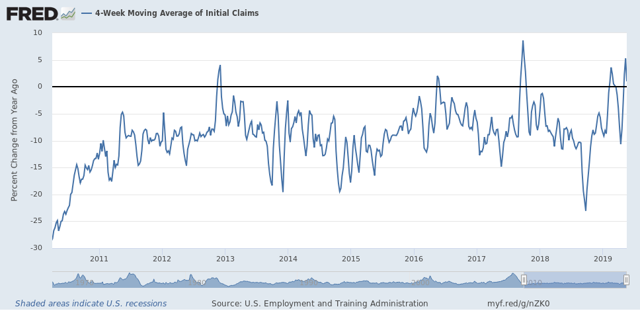
Further, at the moment initial claims are higher YoY:


Even if they continue at the 210-212,000 range for the next few weeks, that’s still only about a 4% improvement from a year ago. 

Bottom line: unless jobless claims continue to fall in the weeks ahead, they are consistent with a slowdown.

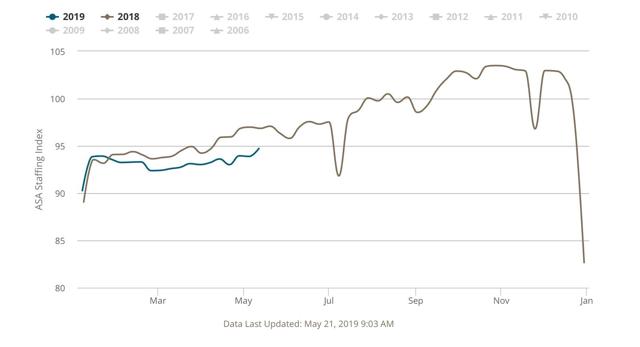
And while I’m at it, another leading sector - temporary jobs - continues to show weakness as reported in the weekly American Staffing Association’s Index:


The four week average of the index is -2.9% YoY, the worst showing since the 2015-16 slowdown.

I was surprised by the strong +12,000 temporary jobs number in the April jobs report. I am expecting either that to get revised downward, or a poorer comparison when May’s report comes out, or both.

In short, the weekly data so far this month is consistent with an oncoming slowdown in employment gains. We’ll see in two weeks.

Wednesday, May 22, 2019

A comment about the economy and the 2020 election


 - by New Deal democrat

Recently I’ve seen a bunch of takes to the effect that “the economy is doing great, and therefore it is likely that Donald Trump will be re-elected.” In my opinion that fear is overblown for three important reasons.

The fist, least noteworthy reason, is that there is still a lot of time between now and the election. As I noted Monday, many - but not all - models of the economy indicate that a recession is likely between now and then, for reasons having nothing to do with the age of the expansion. Needless to say, a recession in 2020 would not bode well for either Trump or the GOP. 

Secondly, consider what economic interventions Trump and the GOP have made since they inherited the economy from Obama. There have been three: 

1. They passed a tax cut that lopsidedly favored the wealthy and corporations, that has generated zero acclaim from the middle and working classes - and with the decrease in tax refunds, may have generated net negative feelings. 
2. Trump has started several trade wars that are proving unpopular, partly because they mainly have hurt portions of his own base, partly because they are  resulting in net higher prices to consumers that may be getting noticed, and partly because negatively affected businesses may start laying off workers.
3. Trump is held responsible for the government shutdown that resulted in a mini-recession.

In short, it’s not clear to say the least that the public at large would give Trump credit for an economy that he mainly inherited from Obama and as to which his known interventions have been received negatively.

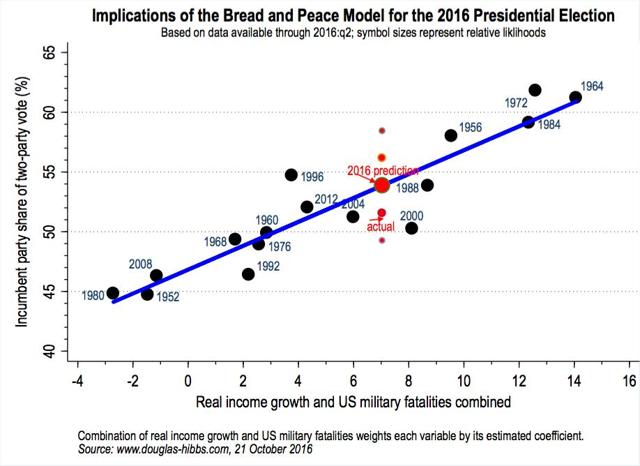
Finally, and most notably, the example of the Bush vs. Gore 2000 election strongly cuts against Trump. As I wrote in 2016, all of the fundamentals-based election models, such as the “bread and peace” model, or models based on the unemployment rate or on consumer income and spending, indicated that Gore should have won by nearly a landslide, on the order of 55%-45%, as shown in the graph below:


Instead, Gore won the popular vote by only 0.5%, despite being able to run on both peace and prosperity - the biggest outlier of the entire series going back to 1952. 

Two big factors held Gore back: first, the economic expansion had gone on for nearly 10 years, and at some point the public takes it for granted, or in other words, “so what have you done for me lately?” Second, as his Vice President, Gore was stained by Bill Clinton’s slimy personal life. 

Both of the factors that worked against Gore in 2000 are likely to work against Trump in 2020: if the economy remains in expansion, the public will probably take it for granted; and Trump’s pervasive sliminess, both public and private, will work against him. In short, Trump is likely to underperform compared with the fundamentals even more than did Gore.

While the example of 2016 certainly means that the 2020 election is another “all hands on deck” moment for Democrats, and nothing should be taken for granted, even if the economy remains in expansion as it is now I do not think that means Trump wins the election.

San Francisco Fed: ease of finding a new job is driving improved labor force participation


 - by New Deal democrat

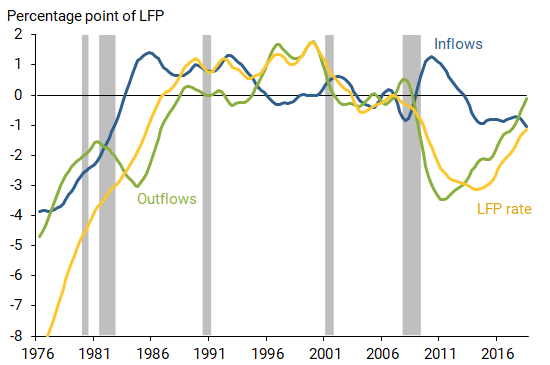
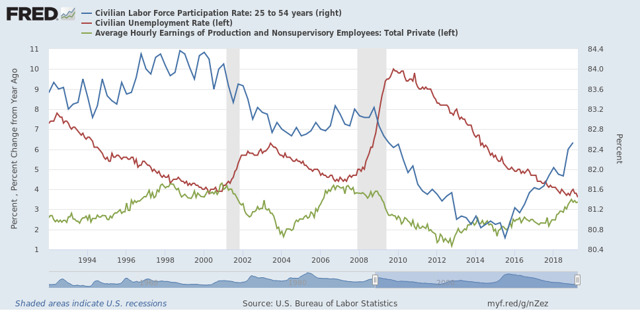
This is a surprising result that is worth noting: the San Francisco Fed found that the increase in prime age labor force participation in the past five years has not been due to new people being drawn into the labor force, but rather by a very large decrease in people leaving it: 


[Note: keep in mind that prior to the early 1990s, both inflows and outflows are increasing due to the secular trend of women entering the workforce.]

Why is this surprising? Because you would think that increased wages would draw people on the sidelines into the workforce. This is something I’ve looked at a few times in the past several years, and the pattern has been clear:

1. The unemployment rate declines
2. Once the unemployment rate declines enough, the decline in labor force participation decelerates, but nevertheless continues.
3. Average hourly wage growth starts to improve.
4. Labor force participation starts to increase.

Here’s a graph showing this relationship since 1994:


The San Francisco Fed says that the reason for the big decline in outflows has been the ease of finding a new job, although that appears to be speculation. It might be that improved wage growth is something that is noticeable to people already in the labor force, rather than those presently outside of it.

Anyway, a counter-intuitive result worth noting.

Tuesday, May 21, 2019

Yes, Virginia, the government shutdown really did cause a mini-recession


 - by New Deal democrat

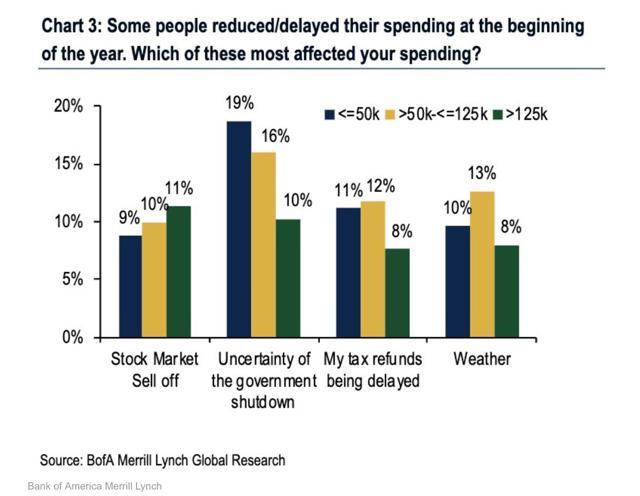
For the past several months, I have been pounding on the idea that the government shutdown, during which 800,000 jobholders were temporarily laid off without pay, had a much bigger impact on the economy than was originally thought.

This morning we get the following graph from Bank of America Merrill Lynch, which speaks for itself:


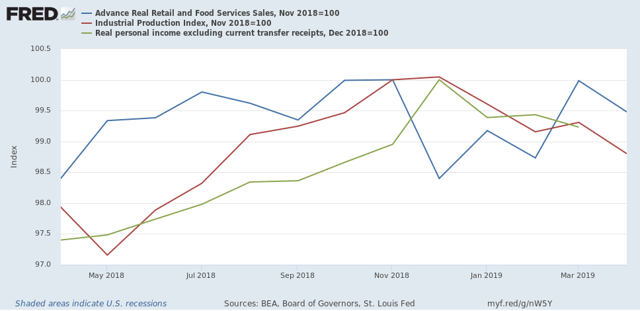
One of the most important insights from behavioral economics is that losses have an outsized effect on behavior compared to gains, usually on the order of 2 to 1. In the case of the government shutdown, about 0.5% of the workforce went without pay for about 45 days. Using the 2:1 ratio, that would translate into a -1% deadweight loss to the economy during that time. 

Of course, the workers got back pay when the government reopened - but if the 2:1 ratio holds, there wouldn’t be an equivalent “kick” from renewed spending. Which seems to have been the case, since the March +1.3% rebound in real retail sales didn’t make up for the -1.6% decline in December.

Monday, May 20, 2019

Twelve Big Picture bullet points on the economy


 - by New Deal democrat

It’s a really slow week for economic data. Really the only important report is new home sales, which will be released Thursday.

I’ve been working on a few things, but they are really information-dense and time-consuming to organize, and because they deal with how long leading indicators interact with one another, I’ll probably post them on Seeking Alpha.

So in the meantime, let me give you a few hopefully pithy Big Picture observations.

1. Virtually every economic model that relies upon the yield curve is forecasting recession to happen sometime in 2020.

2. The few economic models that don’t rely upon the yield curve suggest a recession *could* happen later this year.

3. If we use a “fundamentals” based model that doesn’t rely on financial conditions like interest rates (“real” corporate profits, housing, and cars), the important data is deteriorating, but not enough at this point to forecast recession vs. slowdown.

4. All of these models seem to have a shortcoming in that they rely too heavily on monetary and interest rate policy, and do not adequately account for fiscal policy, like stimulus. Thus all of them “forecast” a recession in 1966-67 that didn’t happen!

5. The reason no recession happened in 1966-67 was LBJ’s “guns and butter” fiscal policy of Vietnam War military spending + domestic Great Society spending, which increased the budget deficit by 500% (!) and helped keep industrial production from declining.

6. The stimulus passed by the Congress at the end of 2016 is much smaller, amounting to only a 50% increase in the deficit. It is also much smaller than either Reagan’s or W’s tax cut stimulus.

7. In any event, the stimulative effect is estimated to end by the end of this year.

8. Contrarily, Trump’s tariffs amount to large, regressive sales tax increases.

9. Which means that, if things don’t change, by next year fiscal policy will be a net drag on the economy.

10. The question remains whether the positive effect of lower mortgage rates can overcome that drag, and the drag of higher short term interest rates.

11. In the meantime, every metric I use indicates that job gains are set to decrease substantially starting more or less right now. The UCLA forecast puts this figure at about 160,000 a month for this year.

12. Needless to say, if a recession happens by the end of 2020, especially if Trump’s tariffs play an important role, fundamentals-based Presidential election models do not bode well for Trump or the GOP.

Sunday, May 19, 2019

Nancy Pelosi is an able tactician, but a poor strategist. She will not save the Republic


 - by New Deal democrat

A couple of years ago I read Andrew Roberts’ tome on Napoleon. As a schoolboy, Napoleon voraciously inhaled everything he could read about military conflict, including several then-recent books suggesting novel tactics. As a young general, he implemented those tactics to brilliant effect, winning almost every big battle he fought.

But if he was a masterful tactician, he was a so-so strategist. His strategy essentially consisted of:
1. Invade neighbor’s country.
2. Win all the big battles.
3. Occupy his capital.
4. Accept large indemnities, and territorial and political concessions, in return for going home.  

By the time he got to the last big continental power, Russia, Tsar Alexander and his generals had thoroughly analyzed Napoleon’s style. So they employed a colossal, masterful rope-a-dope strategy in which they retreated after every battle was started, denying him his decisive big victories while drawing him ever deeper into Russia’s heartland - ultimately 1000 miles. The tsar even allowed him to occupy Russia’s “old capital” of Moscow, and set it afire so that Napoleon could not use it to provision him during the winter. Then he simply ignored Napoleon’s entreaties to negotiate step #4. By the time Napoleon realized the tsar was simply going to refuse to capitulate, it was too late, and Napoleon lost over half a million men in the ensuing retreat through the brutal winter back to his nearest supply lines in Poland. Napoleon was fatally wounded, and Tsar Alexander’s men harried his retreat all the way back across Europe. Three years later, Russian troops occupied Paris.

Okay, so I’m not tarring Nancy Pelosi as making Napoleonic mistakes. But there is a comparison, because while Pelosi is a very able tactician, her excessive caution makes her a poor strategist.

Take the government shutdown. Common wisdom is, Pelosi won that battle. But look what was “accomplished:” in return for a government shutdown for about 45 days, with 800,000 federal workers furloughed without pay, causing an actual downturn in economic activity I’ve called a “mini-recession:”

 
here’s what Pelosi got. Instead of giving Trump $7 billion for his “wall,” she gave him $2 billion. Which by the way hasn’t been spent, and which caused him to declare a “state of emergency” which hasn’t even been passed on by a US District level Court yet. In other words, all of that for about 0.5% of the federal budget. In return for which, the President has so far gotten away with usurping a core area of Congressional responsibility.

Or, even more bluntly, a tactical victory but a strategic defeat.

Pelosi is playing the same tactical game when it comes to impeachment. According to the Chicago Tribune,
Pelosi has repeatedly warned that pursuing impeachment could hurt Democrats’ electoral chances in 2020.
 Instead, Democrats should focus on building their majority in the House and winning back the White House and a Senate majority in the 2020 election, Pelosi said. And where they can, Democrats should work with the Trump administration on policies, such as lowering prescription drug prices and investing in infrastructure, that will benefit the American people, she said.... 
“The urgency to protect the integrity of our democracy is there,” Pelosi said.The answer? “Just win big, baby,” the speaker said.
In other words, the answer to Donald Trump is a democratic victory in 2020 which will enable democrats to pass their agenda (how to deal with the Senate filibuster, assuming the democrats pick up 3 Senate seats, she doesn’t say).

Throughout her career, Pelosi has always accepted polls as gospel, and refused to see that action might *move* the polls. If the House were to impeach Trump, the publicity surrounding the hearings might create a bigger groundswell for conviction. And even if the Senate refused to convict, the groundwork would have been laid that actions such as Trump’s were unacceptable.

Instead, if Pelosi’s path is followed, in the meantime here’s what will have happened:


So, if Pelosi prevails, we will simply accept permanent damage to the US’s Constitutional fabric in return for the temporary ability to maybe get some things done in 2021. As someone else has pointed out, without Congressional action Mueller’s report reads like a blueprint for how to establish corrupt autocratic rule by, say, a President Tom Cotton. And, make no mistake, it will be followed.

Saturday, May 18, 2019

Weekly Indicators for May 13 - 17 at Seeking Alpha


 - by New Deal democrat

My Weekly Indicators post is up at Seeking Alpha.

The stock market’s “tariff tantrum” is driving down interest rates in bonds. We are in a time when government policy decisions - sometimes just passing tweets - are driving winners and losers in economic activity. And these can have immediate impact, disrupting the scheme of long leading -> short leading -> coincident indicators of the economy.

As usual, clicking over and reading helps reward me a tiny little bit for my efforts.