Wednesday, January 16, 2019

Notes on the government shutdown


 - by New Deal democrat

I have a post on the housing market pending at Seeking Alpha. If and when it goes up there, I will link to it here.
In the meantime, here are a few important notes on the shutdown.
I can’t find the quote now, but about a week ago it was floated that Trump could “save face” by declaring an emergency, starting to build the wall, and then allow the government to open. Then Trump indicated that if he declared a state of emergency, that wouldn’t mean that he would open the government even then. This is a win-lose capitulation transaction, and Trump is bound and determined to show dominance over the Democrats.
Aside from the fact that there is a large portion of the GOP that is taking advantage of this to “drown the government in a bathtub,” now that a Federal judge has turned down government workers’ “involuntary servitude” challenge, Trump has a ready-made force of de facto slaves that he can recall — or not — depending on whether he wants a particular government program to work or not: 
The nearly 50,000 furloughed federal employees are being brought back to work without pay — part of a group of about 800,000 federal workers who are not receiving paychecks during the shutdown, which is affecting dozens of federal agencies large and small. A federal judge on Tuesday rejected a bid by unions representing air traffic controllers and other federal workers to force the government to pay them if they are required to work.
Don’t hold your breath waiting for SEC workers or those necessary to issue food stamps to be recalled.
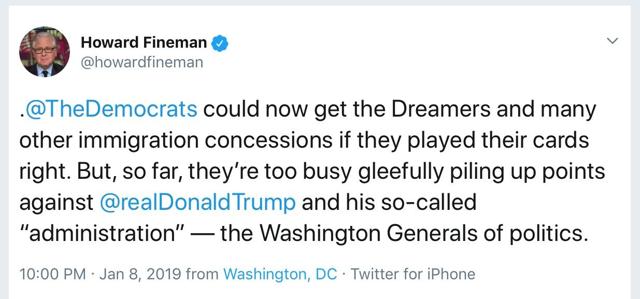
I’m not the only one who is questioning the Democrats’ (lack of?) strategy here, in failing to frame this as a horse-trading negotiation:

One way that the shutdown might end is if enough of the “essential” workers who aren’t being paid go out on strike:

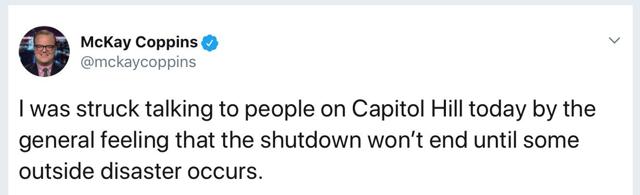
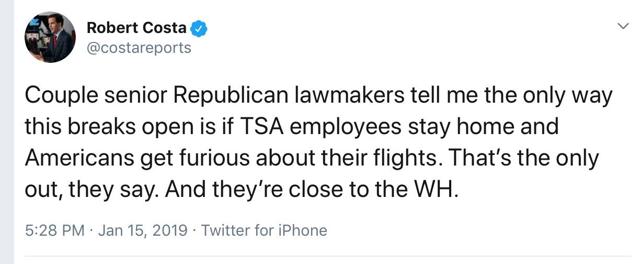
But apparently more and more insiders are coming to the same conclusion I came to a number of days ago. It will take a preventable disaster to force an end to the shutdown:
Meanwhile, the longer the shutdown goes on, the more likely it is that the economic slowdown that I’ve been writing about for months turns into a  recession:
Mr. Hassett said on Tuesday that the administration now calculates that the shutdown reduces quarterly economic growth by 0.13 percentage points for every week that it lasts — the cumulative effect of lost work from contractors and furloughed federal employees who are not getting paid and who are investing and spending less as a result. That means that the economy has already lost nearly half a percentage point of growth from the four-week shutdown. (Last year, economic growth for the first quarter totaled 2.2 percent.)

I’m guessing about 10 to 12 weeks of a shutdown would be enough to do the trick.

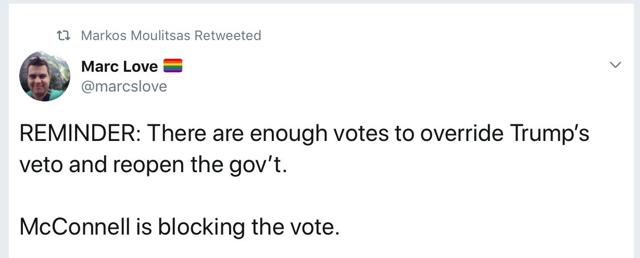
Finally, the focus on MItch McConnell is only half-right:

This is false. Unless Pelosi can round up over 50 GOPers in the House — and there’s no sign that she can — even a Senate bill passed 100-0 would not be enough to overcome a Trump veto.

Tuesday, January 15, 2019

The consumer nowcast and the short term forecast


 - by New Deal democrat

First, a quick site note. I am blogging from a new device, and since I am a fossil, that means the transition is far from smooth. In particular, posting of graphs is going to be minimal until I can get a new method working properly. Also, I’m going to be traveling later this week, so don’t be surprised if there is no content for a couple of days. Finally, because the “Blogger” platform is very 2000s, and not supported any more, don’t be shocked if the best way to deal with it turns out to be transitioning to a new website.

No new data economic today, but the Fed did publish data last week that allows me to update one of my “alternate” forecast methods, one that I first laid out over a decade ago: the consumer nowcast.

The way this works is to look at the economy from the viewpoint of the average American consumer. In order for the consumer economy to grow, at least one of the three below items must be happening:

1. Real income is growing.
2. A widely held asset class, in particular stocks or real estate, is appreciating (and thus available to be tapped into to free up cash.
3. Interest rates decline to new lows, allowing existing debt to be refinanced.

If none of these are happening, then a pullback in willingness to spend signals the onset of a recession.

Let’s take these in reverse order.

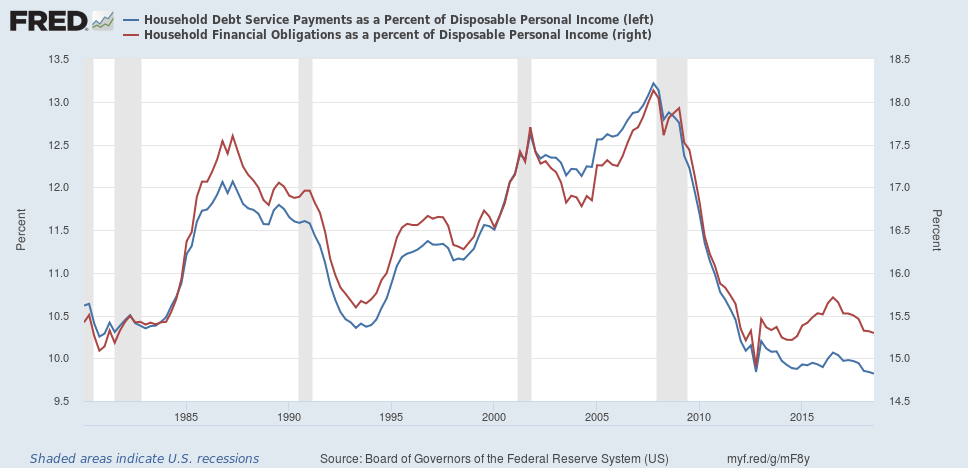
Last week the Fed released its household debt data, showing that household debt as a share of income peaked over two years ago. In Q3 2018 households became slightly more cautious compared with the quarter before:

Needless to say, stock prices last made a peak over 3 months ago. That source of cash has dried up.

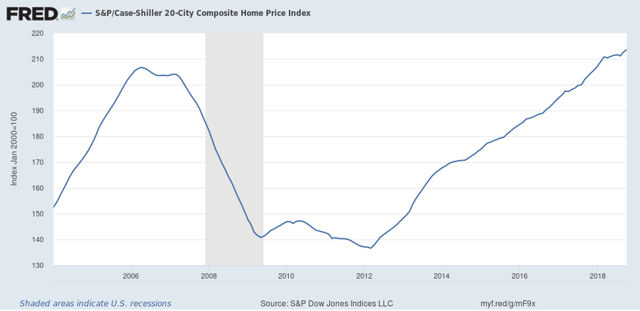
House prices, however, have continued to climb, according to the most recent Case-Shiller index, meaning that home equity withdrawal remains a potential source of spending money:

And perhaps most fundamentally, as I wrote about last week, real average and aggregate non-supervisory wages have continued to grow.

So the consumer nowcast is not signaling recession.

Meanwhile, as I wrote last week at Seeking Alpha, the short term forecast through mid-year is for no a slowdown but no recession, unless caused by poor public policy — like, say, a trade war, or maybe a government shutdown that causes businesses to postpone plans due to lack of transparency.

That sort of policy debacle isn’t going to first show up in the long leading indicators and take an entire year or more to filter through the economy. It will show up, more or less, all at once.

But I would still expect some warning from the short leading indicators, most notably from measures of manufacturing, temp hiring and layoffs.

As of now, neither temp hiring nor layoffs have backed off enough for any sort of warning. On the other hand, although it is just one data point of many, that the Empire State Manufacturing Index’s new orders measure fell to an 18 month low (although still positive at +4) at very least continues the trend of a big slowdown in the industrial sector.

Keep an eye on these three areas (new orders, temp hiring, and new jobless claims). If these turn outright negative, that will be a very strong sign that poor public policy is causing what otherwise would just be a slowdown to tip all the way into recession.

Monday, January 14, 2019

Flying blind


 - by New Deal democrat

The government shutdown is affecting some important economic indicators. All of the series published by the Census Bureau, including retail sales, manufacturers’ and wholesalers’ data, personal income and spending, new home sales and housing permits and starts, are not being published.  It appears that GDP is not going to be published by the BEA either.

In the past I have created work-arounds for a few economic series, in particular new jobless claims and industrial production, neither of which appear affected at this point, as the former is published by the Department of Labor, and the latter by the Fed.

If the government shutdown continues — and a long shutdown, until there is widespread pain or an avoidable disaster (like a plane crash or widespread food-borne disease outbreak) looks like the most likely scenario for now — I will attempt serviceable work-arounds for at least some of these series.

For starters, retail sales was scheduled to be released this Wednesday. Almost certainly that isn’t going to happen, so on Wednesday I’ll publish a guesstimate that hopefully will at least get the direction correct, and capture some of the strength or weakness of that direction.

But, make no mistake, not having access to reliable economic data isn’t just a drawback for me, it’s a cost to any enterprises attempting to make decisions. Some of those businesses are going to postpone making a decision — on hiring as well as spending — until they have more clarity. And the postponement of spending decisions means a drag on GDP and employment.

Unfortunately it appears that the spate of short shutdowns in the past several decades have caused Washington to “learn” that, at least in the short term, nothing too bad happens when government is closed. Thus, flying blind will continue until we crash into something.

Saturday, January 12, 2019

Weekly Indicators for January 6 - 10 at Seeking Alpha


 - by New Deal democrat

My Weekly Indicators post is up at Seeking Alpha.

Recent gyrations have changed both the short and long term forecast. Once again, it shows that the biggest problem is that most forecasters simply project existing trends forward.

As usual, reading the article should be informative for you, and helps reward me with a little pocket change for my efforts.

Friday, January 11, 2019

Real hourly and aggregate wage growth in 2018: very good, thanks to declining gas prices


 - by New Deal democrat

Now that December inflation has been reported as down -0.1%, with YoY consumer inflation a paltry +1.9%, let's update what that means for real wage growth in 2018.

Nominally, wages for nonsupervisory workers grew +0.4% in December. With inflation flat, that means real wages grew +0.5%: 


The good news is that real hourly wages are at their highest level in 45 years, having finally surpassed their levels from the late 1970s. The bad news is that they are nevertheless below their peak level in 1972-73!

On a YoY basis, real wages rose 1.4% for all of 2018:


Since 1999, the change in real wages has almost explusively been determined by the price of gas. Gas prices have fallen over -20% in the last three months, and that has made all the difference in real as opposed to nominal wages.

Finally, real aggregate wages (i.e., the total amount of wages, in real terms, paid to non-managerial workers) have now risen 27.9% from their bottom in October 2009:


The total advance during this expansion, while good, is nevertheless still exceeded by that of  the 1960s (+31.2% since the series began in 1964) and 1990s (+33.8%).

On the other hand, growth in real aggregate wages had averaged 2.5% in this expansion, varying from 1% to 8% depending on what has happened with gas prices:


In 2018, real aggregate wages grew +3.1%, the best level of the past 10 years.

In sum, the growth in both real and nominal wages was probably the best part of the economy in 2018 for average Americans.

Thursday, January 10, 2019

Gaming out the government shutdown


 - by New Deal democrat

There isn't any significant economic news today, and there have been some developments of note in the standoff about Trump's border "wall," so let me update my thoughts on this.

A week ago Sunday, I wrote that Pelosi should opt for a "maximalist" strategy of making affirmative demands for Democratic objectives, as well as taking GOP "hostages" like agricultural subsidies, as bargaining chips to use to come to a deal with Trump and the GOP, rather than an "accommodationist" strategy of simply opening the government as previously agreed to by the GOP (a deal that Trump had reneged on).

Well, Pelosi chose the "accommodationist" strategy, so where are we?

There are 4 possible outcomes:

1. Trump capitulates. This is only going to happen if large portions of Trump's own base abandon him, as they did with the child separations at the border.

2. Pelosi and the Dems capitulate. If negotiations are off the table, and Trump's base doesn't turn against him, this is the more likely outcome.

3. Trump, the GOP, and the Dems negotiate a deal.  This happens if all sides can claim "victory." Trump gets appropriations for something he can call a "wall," and Democrats get something - like the DREAM Act - they can call victory as well. Since Trump has a demonstrated history of reneging on deals after pocketing concessions, any proposed deal is going to have to get around this procedural issue.

4. The Dems and the GOP negotiate a veto-proof deal. If Trump's base does not turn on him, but Congressional GOPers fear for their re-election chances in 2020, there is at least a slim possibility that they could cut a deal that overrides a Trump veto.

Now let's review where we are.

As I anticipated, since Pelosi was unable to obtain a 2/3's majority in the House, Trump is standing pat, and so is McConnell, since he has nothing to gain by trying to override a veto unless the House will do so as well.

So at the moment we are stuck in a "win-lose" capitulation scenario, with both sides becoming more and more entrenched as each is aware that its base will be furious with capitulation. In movie terms, this is a game of chicken where both drivers are speeding towards a cliff.

Right now, actually going over the cliff looks like the most likely scenario. "Going over the cliff" means that more and more government services shut down, and more and more pain is inflicted on an ever-increasing number of people. The shutdown will continue until there is so much widespread pain inflicted on average Americans that they scream for both sides to make it end, without really caring who caves in.

The first and most likely place for pain to be felt is airline travel, which is already starting. As more TSA security either fail to show up or outright quit, air travel will become very unpleasant. Slowdowns by overstressed air traffic controllers and by pilots aren't unlikely either. But that is probably not enough.

The more likely sources of the widespread pain are either (more likely) tax refund checks and/or Social Security checks stop going out; or (less likely) a widespread outbreak of food-borne illness  due to lack of FDA inspections.

But let's be clear on something unpopular: if we do go over the cliff, it is because *all* of the parties, including the Democrats, are willing to see widespread pain inflicted on ordinary Americans, rather than be seen to be capitulating.  As an aside, let's also be clear that there is a large faction of the GOP -- what Digby and Atrios call "E Coli conservatives" - who are perfectly happy with this, since they favor a return to 1859 anyway, minus the messy slavery bit.

In this case, the plurality if not majority of people are not going to care about apportioning blame. They are going to want "both sides" to give something up to get the government open. That probably means that the Democrats get nothing affirmative, but the funding for Trump's "wall" is cut back.  This comes closest to scenario #2, although it does involves some capitulation by Trump as well.

I've seen some commentary that suggests Trump will declare an "emergency" and claim victory even if the move is immeidately torpedoed by Congress and/or tied up in the Curts. The issue I have with this theory is, I see no reason why Trump would sign any funding bills while the challenges are pending, unless portions of his base abandon him. So I don't see how we avoid the "going over the cliff" part.

Since the one condition under which Trump will blink is if enough of his own base abandons him on this issue, #4 is the least likely scenario, because in those circumstances, Trump himself will capitulate.

Scenario #3 - the scenario for which I advocated - is less likely than the "going over the cliff" scenario, but more likely than #4.  At the moment, the only people pursuing this are a handful of GOP Senators. Here's a tweet on this from yesterday. I've included the retweet by Markos Moulitsas so that you can be assured that I am not the only one guilty of purity apostasy:


The biggest problem with scenario #3 is that, in between the agreement and Trump's signature, Lou Dobbs, Sean Hannity, and Stephen Miller are sure to try to reach him and rail against compromise. To get around that, in the past I've suggested making use of -- with as much hoopla as possible --  the "President's Room" in the Capital Building, and ensuring that the House and Senate both approve the deal before the President leaves the room, all the while he has to be chaperoned by the likes of Sens. Schumer and Graham to distract him (Pro tip: Kim Jung Un showed the way to do this). The only other possibility is to insist that, e.g., the DREAM Act be passed and signed first, with its taking effect contingent on the second bill appropriating $$$ for a wall, also being passed.

But, unfortunately, to recapitulate my point, so long as we are in a win-lose game of capitulation chicken, a large chunk of Americans are going to have to suffer some real pain before this impasse gets resolved, and so long as the point is that of wall vs. no wall, Democrats are not going to gain anything affirmative out of it.
Wednesday, January 9, 2019

November JOLTS report shows surprising (relative) weakness


- by New Deal democrat

The JOLTS report on labor is noteworthy and helpful because it breaks down the jobs market into a more granular look at hiring, firing, and voluntary quits. Its drawback is that the data only goes back less than 20 years, so from the point of view of looking at the economic cycle, it has to be taken with a large dose of salt.

With that disclaimer out of the way, Monday's JOLTS report for November was surprisingly soft relative to the strength of the overall jobs gain for that month, as it show most of the series continuing to decline from their August peaks (in the case of hires, October):
  • Quits declined for the 3rd month in a row, and are about 7% off peak.
  • Hires declined were about 3% off their peak set one month ago.
  • Total separations are off 5% from August.
  • Job openings are a little less than 5% below August.
  • Layoffs and Discharges are up 7% from their recent low (a bad thing), and had one of their three worst months in the last year.

Let's update where the report might tell us we are in the cycle.

First, below is a graph, averaged quarterly through the third quarter, of the *rates* of hiring, quits, layoffs, and openings as a percentage of the labor force since the inception of the series (layoffs and discharges are inverted at the 3% level, so that higher readings show fewer layoffs than normal, and lower readings show more):


During the 2000s expansion:
  • Hires peaked first, from December 2004 through September 2005
  • Quits peaked next, in September 2005
  • Layoffs and Discharges peaked next, from October 2005 through September 2006
  • Openings peaked last, in Spril 2007
By contrast during and after the last recession:
  • Layoffs and Discharges troughed first, from January through April 2009
  • Hiring troughed next, in March and June 2009
  • Openings troughed next, in August 2009
  • Quits troughed last, in August 2009 and again in February 2010
Now here's what the four metrics look like on a monthly basis for the last five years: 


As indicated above, job openings, quits, and hires all surged higher through August of this year. In the three months since then there's been at least a temporary downturn.
.
Next, here's an update to the simple metric of "hiring leads firing," (actually, "total separations"). Here's the long term relationship since 2000 through Q3 of this year: 


Here is the monthly update for the past two years measured YoY:


In the 2000s business cycle, hiring and then firing both turned down well in advance of the recession. Time will tell whether the recent decline in separations is just noise, or the start of a more significant downtrend. If it is significant, that would be a break from the pattern in the 2000s expansion. 

Finally, let's compare job openings with actual hires and quits. As you probably recall, I am not a fan of job openings as "hard data." They can reflect trolling for resumes, and presumably reflect a desire to hire at the wage the employer prefers. In the below graph, the *rate* of each activity is normed to 100 at its August 2018 value, since that has been the recent peak:


When I first presented this graph, I noted that while the rate of job openings is at an all time high, the rate of actual hires has only just reached its normal rate during the several best years of the 2000s expansion, and is below its rate at the end of the 1990s expansion. 

Through August both hires and quits have accelerated, with hiring decisively above its level from the last expansion -- although, as you can see in the first graph above, the *rate* of hiring remains below that of the 2000s expansion. My take has been that employees have reacted to the employer taboo against raising wages by quitting at high rates to seek better jobs elsewhere. If the dam is finally breaking, we should see the hiring rate increase, and quit rate level off. Since hires are the only metric that have made a new high since August, and have declined the least since that high, this may be happening.  

In summary, the November JOLTS report showed an employment market backing off its best levels. Is this the start of a trend? While my expectation is that this will start to cool down during the first six months of this year as a slowdown begins to take hold, in the near term that is balanced by the simple fact that the JOLTS report for December when it is released next month is going to reflect the roughly 300,000 net jobs gained last month, and so is likely to be equally strong.

Tuesday, January 8, 2019

My forecast for H1 2018 ...


 - by New Deal democrat

... is up at Seeking Alpha.

I've been using the "K.I.S.S." method for nearly a decade, and it has been flawless so far.

As usual, clicking on the link and reading, in addition to hopefully being educational for you, helps reward me with a little $$$ for my efforts.

Monday, January 7, 2019

Good news from the employment report: workers are finally getting raises!


 - by New Deal democrat

When it comes to jobs, if there is one trend that really set apart 2018 from any prior year of this expansion, it is that ordinary workers are finally getting decent raises.

Let's start by looking at the monthly % change in average hourly wages for non-managerial workers for the entire duration of this expansion. Since this has averaged about +0.2%/month, I've subtracted that so that any month above 0 is an above average increase in nominal hourly pay for ordinary workers:


Look at the far right. In ten of the last twelve months, average hourly wages have increased by more than the norm for this expansion.

As a result, YoY nominal wage growth in the last two months has been a little over 3.3%:


Average hourly wage growth accelerated YoY during almost all of 2018. The prrevious high mark of this expansion before late 2017 had been +2.7% YoY.

It certainly appears that employers have finally gotten the message, and the "taboo against raising wages" has been broken -- for now.

Note that from the long term view, Happy Days are not quite Here Again. Here's a graph of the YoY% increase in nominal (blue) and real (red) average wages for non-managerial workers over the last 35 years:


Note that nominal wage have continued to fall, or at least falter, for at least several years after the end of each of the recessions during this period. There have been several reasons for that, but the bottom line is that the "underemployment rate" has to fall to a certain level to put any kind of floor under wage growth. After that nominal wages growth tends to increase until the next recession starts.

But, even with the recent very low unemployment and underemployment rates, nominal wages have still not grown at the 4%+ rates of the last several expansions.

Real, inflation-adjusted wages (red) are of course a whole other story. Since the turn of the Millennium these mainly have had to do with fluctuations in the price of gas. The big "pop" in real wages in 2014-15 was when gas prices declined from close to $4/gallon to under $2/gallon. In the last few months there has been a similar dynamic.

In December, nominal non-managerial wages grew +0.4%.  Because of the government shutdown, CPI may not be reported timely. But we can estimate, since gas prices declined over -10% in December alone. In the past, this has been associated with a decline in overall CPI from -0.3% to -0.5%. This suggests that real, inflation-adjusted wages probably grew at close to +0.8% in December, bringing the YoY gain for all of 2018 to about 2%.

This is almost unalloyed good news.

Saturday, January 5, 2019

Weekly Indicators for December 31 - January 4 at Seeking Alpha


 - by New Deal democrat

Forgot to do this earlier ....

My Weekly Indicator posts is up at Seeking Alpha.

The way that interest rates are behaving has a few surprising implications for other indicators.

Friday, January 4, 2019

December jobs report: 2018 goes out with a bang


 - by New Deal democrat


HEADLINES:
  • +312,000 jobs added
  • U3 unemployment rate rose +0.2% from 3.7% to 3.9% 
  • U6 underemployment rate unchanged at 7.6% 
Here are the headlines on wages and the broader measures of underemployment:

Wages and participation rates
  • Not in Labor Force, but Want a Job Now:  declined -70,000 from 5.397 million to 5.327 million   
  • Part time for economic reasons: declined - 124,000 from 4.781 million to 4.657 million 
  • Employment/population ratio ages 25-54: unchanged at 79.7% 
  • Average Hourly Earnings for Production and Nonsupervisory Personnel: rose $.09 from  $22.95 to $23.05, up +3.4% YoY.  (Note: you may be reading different information about wages elsewhere. They are citing average wages for all private workers. I use wages for nonsupervisory personnel, to come closer to the situation for ordinary workers.) 
Holding Trump accountable on manufacturing and mining jobs

 Trump specifically campaigned on bringing back manufacturing and mining jobs.  Is he keeping this promise?  
  • Manufacturing jobs rose +32,000 for an average of +24.000/month in the past year vs. the last seven years of Obama's presidency in which an average of +10,300 manufacturing jobs were added each month.   
  • Coal mining jobs rose +600 for an average of +175/month vs. the last seven years of Obama's presidency in which an average of -300 jobs were lost each month
October was revised upward by +21,000. November was also revised upward by +37,000, for a net change of +56,000.

The more leading numbers in the report tell us about where the economy is likely to be a few months from now. These were positive.
  • the average manufacturing workweek rose +0.1 hours from 40.8 hours to 40.9 hours. This is one of the 10 components of the LEI.
  • construction jobs rose by +32,000. YoY construction jobs are up +284,000.  
  • temporary jobs rose by +10,300. The strong YoY trend remains intact.
  • the number of people unemployed for 5 weeks or less fell by -2,000 from 2,128,000 to 2,126,000.  The post-recession low was set seven months ago at 2,034,000.
Other important coincident indicators help  us paint a more complete picture of the present:
  • Overtime rose +0.1 hour from 3.5 hours to 3.6 hours.
  • Professional and business employment (generally higher-paying jobs) increased by +43,000 and  is up +583,000 YoY.
  • the index of aggregate hours worked for non-managerial workers rose by 0.3%.
  •  the index of aggregate payrolls for non-managerial workers rose by 0.7%.     
Other news included:            
  • the  alternate jobs number contained  in the more volatile household survey increased by 180,000  jobs.  This represents an increase of 2,880,000 jobs YoY vs. 2,638,000 in the establishment survey.    
  • Government jobs increased by +11,000.
  • the overall employment to population ratio for all ages 16 and up remained at 60.6% m/m and is up 0.4% YoY.          
  • The labor force participation rate rose +0.2% from 62.9% m/m to 63.1% and is up +0.4% YoY.

SUMMARY

This was a blockbuster report. About the only negative is the increase in the headline unemployment rate, which may be an artifact of the year-end household survey rebalancing (rather than revise each of the last 12 months, they simply add the revisions into the January number).

Everything else, including the leading portions of the report, was positive to strongly positive. At first glance, the gains look widespread, but I'll update if necessary once I am able to take a longer look. The gains to ordinary workers nominal wages are particularly welcome. UPDATE: The gains are widespread, but particularly so in education, healthcare,  leisure and hospitality, and somewhat in construction.

Needless to say, this report is in stark contrast to what many of the leading indicators are telling us. Since employment and production are the Queen and King of coincident indicators, respectively, I think workers will need to enjoy this while it lasts. Now would be a good time to start preparing for the downshift in trend that I think is inevitable at this point.

Thursday, January 3, 2019

December ISM manufacturing points to sharp slowdown


 - by New Deal democrat

I need to publish my first half forecast for 2019, but before I do, I want to see how a few leading indicators for December pan out. These include motor vehicle sales, the manufacturing workweek, new unemployment claims less than 5 weeks old -- and this morning's ISM manufacturing report.

To breifly recap, my long leading indicators turned neutral 7 months ago and haven't improved since, even going negative for a few weeks. As a byproduct of that, I have been waitiing on short leading indicators to decelerate as well, which they have shown strong signs of doing recently.

As part of that, two months ago I wrote that "I expect slowing [in the ISM new orders index] to continue."

Manufacturing expanded in December, as the PMI® registered 54.1 percent, a decrease of 5.2 percentage points from the November reading of 59.3 percent. “This indicates growth in manufacturing for the 28th consecutive month. The PMI®recorded a substantial softening in December and retreated to a level not seen since November 2016, when it registered 53.4 percent,” says Fiore. A reading above 50 percent indicates that the manufacturing economy is generally expanding; below 50 percent indicates that it is generally contracting.
I have been using an average of the five regional Fed new orders indexes to forecast the direction of the ISM indicator.  Here's a comparison of the regional Fed averages (left) and ISM new orders (right) for all of 2018:

JAN   15   65.4
FEB   20   64.2
MAR   16   61.9
APR   17   61.2
MAY   28   63.7
JUN   24   63.5
JUL   24   60.2
AUG   17   65.1
SEP   20   61.8
OCT 18  57.4
NOV 15  62.1
DEC  8   51.1

October's 57.4 ISM reading, while very positive, was nevertheless the lowest since November 2016. Today's reading is not just below that, but is the lowest since August 2016. Here's the longer-term graph (not including this morning) from Briefing.com:


The sharp decelerating trend in the Fed new orders indexes since May's high is apparent. Now the ISM has confirmed the deceleration in spades. I suspect this reflects both the feeding through of the weakness in the long leading indicators, and also the nearly immediate impact of Trump's trade war policies. In other words, poor Administration economic policy may have taken a slowdown that was likely to happen in a few months, and moved it forward. The silver lining is that a slowdown, however sharp and however much "baked in the cake" at this point, is not a recession
  

Wednesday, January 2, 2019

Unhappy new year: bond yield curve inversion spreads


 - by New Deal democrat

A month ago, when the 2- through 5-year bond yield curve first inverted, I wrote that while it might be a case of "the camel's nose is in the tent," i.e., the rest of the camel (yield curve) was likely to follow, there were a bunch of caveats:
In short, a one-day inversion over a limited portion of the bond yield curve, while more often than not heralding a full-on inversion and bad consequences to come, is by no means dispositive.
Generally speaking, for a yield curve inversion to give a true signal, it should last longer than a few days, spread out further along the yield curve, especially towards shorter yields (e.g. 6 month or 1 year yields), and deepen.

As of this morning, here's what bond yields look like:


About a week ago, for the first time, the inversion spread out to the 1-vs.5-year yield, and a secondary inversion opened up between the 1 month and 3 month yield.  Then, on Monday, the inversion spread out to the 1-vs. 7-year yield. Further, as of this morning, the 1 year vs. 10 year yield spread has shrunk to .04%. That's a big move and about .07% tighter than it has been at any point in the last year.

Note that the inverted spread between the 1 year and 3 year bond yields has deepened to -0.155%.

So, all three of my criteria for a true signal have been met: (1) the inversion has persisted; (2) the inversion has spread out along the yield curve, especially towards shorter term maturities; and (3) the inversion has deepened. 

A recession in the next 12 to 24 months is still not a sure thing. There were deeper and more persistent inversions in 1966 and 1998 without a recession following in that time frame -- although 1966 was a very deep slowdown that just missed being a recession.

But there is simply a very strong possibility that we are looking, at very least, at a big slowdown soon.

Tuesday, January 1, 2019

Happy New Year 2019


 - by New Deal democrat

Best wishes for a happy, healthy, and prosperious New Year in 2019!

This year is shaping up to be a much more challenging one than 2018. And I'll continue the same old boring and nerdy, but tried and true, analysis starting tomorrow.

Among other things, in the next week or so I expect to post my first half forecast, and then, once preliminary GDP for Q4 is reported before the end of January, my forecast going forward all the way to the end of 2019.

Sunday, December 30, 2018

On the government shutdown, Pelosi should go maximalist


 - by New Deal democrat

It's pretty clear that the House GOP has decided to simply punt the government shutdown into the new Democratic House majority's laps.

That new House Democratic majority will have two basic options: (1) go accomodationist; or (2) go maximalist.  I am here to write in support of option #(2).

To recap, before the government shutdown, the Senate had passed a stopgap measure by 100-0. When RW extremists got Trump's ear, he (as usual) welched and refused to sign any bill that did not include funding for his border "wall." The House GOP promptly passed a bill doing so, and there matters have stalled for the last 10 days.

The "accomodationist" option is for the new House majority to pass the bill that is identical to the one that already passed the Senate by 100-0. It is very unlikely that this will work.

In the first place, Mitch McConnell has announced that he will not bring to the Senate floor any bill that will be vetoed by Trump. Since Trump has already indicated he will veto the existing Senate bill, McConnell might simply refuse to bring it back up. Even if he does, it is almost certain that Trump will veto it. Even if the Senate GOP feels they cannot renege on their prior votes, a 2/3's majority must still be found in the House.

And that is where the problem is. It is simply unlikely that enough members of the House GOP are going to roll over so that the bill passes over Trump's veto.It is simply very unlikely that the House will be able to add on new demands once an "accomodationist" bill is defeated. In the far more likely event that the House fails to override Trump's veto, this puts him in the driver's seat, in the kind of negotiation he likes -- where the other side must agree to ever more escalating demands to get his assent.

The "maximalist" option is for the new Democratic House majority to lay out some new demands of their own.  Here are three good candidates, *all* of which might be added on to a House bill: (1) permanent legalization of the Dreamers; (2) permanent codification of DACA; and (3) undoing the piecemeal repealers of the ACA by the prior Congress. If they want to really be mean, they can announce that for every day that the GOP delays in approving the budget, they will deduct $1 Billion from agricultural subsidies in any budget resolution they will agree to. 

Will McConnell and Trump go ballistic? Of course! So what.

You will now have one demand on the GOP side (fund the wall) counterbalanced by three demands on the Democratic side (as stated above). This puts the Democrats in the position of being able to do some horse-trading in order to get a budget bill passed.

It is unlikely that Trump will sign a bill without being able to declare victory on funding for the "wall." Suppose the Democrats, behind closed doors, offer to approve $2.5 billion in funding (that might take over 2 years to be committed, wink wink hint hint), in return for dropping the ACA demand and tempering the DACA demand, while getting full legalization for Dreamers (which is *very* popular). This would be a very positive and doable outcome.

But the only way we are going to get a positive outcome, rather than one that involves incredible pressure being put on Democrats to cave and go crawling on their knees to Trump, is if the House Democratic majority under Pelosi starts out by going maximalist.

Saturday, December 29, 2018

Weekly Indicators for December 24 - 28 at Seeking Alpha


 - by New Deal democrat

My Weekly Indicators column is Up at Seeking Alpha.

Ideally a change in trend in the long leading indicators should, over time, manifest in the short leading indicators.

Well, in the first half of 2018, the long leading indicators went from positive to weak positive to neutral, where they have generally remained ever since.

Now, the short leading indicators have .... Click over and read to find out!

Friday, December 28, 2018

Marking my 2018 forecast to market

At the beginning of every year, I give a forecast for each of the two halves of the year. And at the end of each year, I look back and mark my forecasts to market. In that way I try to be completely transparent, and to keep myself honest.  Since we're at the end of 2018, let's look back to last January and see how I did.

This year the call is pretty easy.  With the exception of a hurricane-induced whipsaw in September and October, for the last year the L.E.I. [Index of Leading Economic Indicators] has improved by about .4% a month. This strongly suggests clear sailing in the first half of 2018.
....  if you wanted an even easier, quick and dirty approach to a short term forecast, you can simply chart weekly initial jobless claims and the S&P 500 (both of which are components of the LEI).  If both of those are still making new lows/highs respectively (and they have been), then the economy should be in good shape for the next few months. 
....They're good and so is the near term economy.
As I wrote at the time, that was a pretty easy call, because there had been a surge last autumn of almost all of the leading indicators. 

Turning to the second half of 2018, last January after reviewing all of the long leading indicators, I wrote:
To summarize the results: 
  • There is only one outright negative [long leading indicator], and mixed one at that: Corporate bond yields and mortgage interest rates.
  • There are five positives: real M1, the yield curve, credit conditions, corporate profits, and real retail sales per capita.
  • Housing is mixed, neutral to mildly negative for most of the year, but a positive late in the year. Real M2 is also positive for this year, having just turned negative.
My sense is that later 2018 will be weaker than 2017, as the housing market stagnation of Q2 and Q3 2017 feeds through into the coincident indicators. On the other hand, the clear majority of long leading indicators remain positive. Left to its own devices, I do not see any recession for the economy at any point in 2018. 
So now let's take a look at the biggest coincident indicators for the economy.  First, real GDP:


Next, Industrial production:


and finally, employment:


A year ago I thought the forecast for this year was pretty obvious: there would be no recession. And there wasn't.

Turning to the forecast that the first half would be stronger than the second half, Q1 GDP wasn't as strong as 2017 GDP Q2 and Q3 accelerated considerably. So in terms of GDP, the forecast for strength took one quarter longer than expected. Further, both industrial production and employment picked up in the first 8 months of the year (averaging +0.5% for production, and 200,000 jobs) before decelerating beginning in September. So by those two metrics, the forecast was pretty much spot on.

In summary, I think I did a pretty good job forecasting 2018.  I am expecting the 2019 forecast, which I'll post in two parts in January, to be considerably more challenging.

Sunday, December 23, 2018

Light posting through year end


 - by New Deal democrat

Between now and New Year's Day, there are only two scheduled economic reports of any significance -- new home sales and the Case Shiller house price index -- and the former will likely not be posted if the government shutdown continues.

So expect light posting for the next 9 days at this here blog.

I'll still have my usual Weekly Indicators next Saturday. Also (no promises!), but I expect to do a comprehensive housing update, since I haven't done that in two months. And I should do my year end report card, in which I go back to my forecasts for 2018 that I posted last January, and see how well, or poorly, I did. If I am industrious, or if events warrant, a couple of other things might get posted. But that's probably about it.

You're reading the right blog: Trump and the Fed edition


 - by New Deal democrat

CNBC (and a whole bunch of other places), yesterday:
President Trump has discussed firing Federal Reserve Chairman Jerome Powell recently, with his frustration intensifying non recent days
Me, FOUR MONTHS AGO:
A new risk at the Fed: Donald Trump's power to fire Fed Governors
the Chairman and all of the other appointed governors of the Federal Reserve have exactly the protection against being fired, except "for cause," that covered FBI Director James Comey. 
So, if Trump thought Fed rate hikes were harming his re-election prospects by slowing the economy, and the Fed insisted on raising rates anyway, do I think Trump would fire the Federal Reserve Chair? Or even all of the Governors? 
In a heartbeat.
This has been another edition of "You're Reading the Right Blog."