Wednesday, May 18, 2016

Aside from a shortage in starter housing for Millennials,there is NOinflation


 - by New Deal democrat

Yesterday's CPI report seems to be read as potentially justifying an interest rate increase in June.  For example, here's Professor Tim Duy, on Fed hawks:
Inflation rose on the back of higher gas prices. Headline CPI gained 0.4 percent, although core rose a more modest 0.2 percent. Core CPI inflation is hovering just above 2 per cent....Fed hawks will be nervous that rising gas prices will quickly filter through to core inflation; doves will remind them that the Fed's target is PCE inflation, which remains well below 2 percent.
As to his own opinion, he says:
I don't think June is a go; the data isn't quite there yet.
The solid [consumer inflation] data helps bolster the case for the Federal Reserve to raise binterest rates at its next meeting in June.....Fed officials have long said that they expect inflation to pick up once the effects of the stronger dollar and low oil prices dissipate. Although the central bank relies on separate data to calculate price increases, Wednesday’s report on consumer costs appears to support the central bank’s claim.
Whether or not the Fed is listening, the fact is that yesterday's inflation data does no such thing.

Consumer prices less shelter are only up +0.1%. Not month owner month, but Year over Year!  This is one of the lowest rates in the entire 75 year history of the series:


Here's a close-up of the last two years just to drive home the point:


If housing really were "hot," if people were buying houses with reckless abandon no matter what the price increase (like 12 years ago), yes there would be a basis for raising rates.  But that is not what is happening at all.

Despite the fact that there are now or will shortly be more Millennials age 18-35 than Boomers:


The entry level housing that they need (red in the graph below)  is not being built enough:


This is confirmed by the relative lack of housing inventory on the market:


and the near record low vacancy rates for apartments:


and the soaring rents:


Since rental prices are up sharply due to low vacancies and a dearth of new entry level construction, there is simply no excuse for the Fed to raise rates. In fact, raising rates will only make the multi-unit housing shortage - and the spike in rents - more acute, as the below graph of YoY changes in the Fed funds rate (blue, inverted so that an increase shows as a downward move) compared with the YoY% changes in housing starts (red) shows:


Quiite simply, an increase in interest rates has historically led to a decrease in housing construction:

Except for the housing supply shortage, there IS NO INFLATION.  One of the two most likely causes for the next recession will be if the Fed perversely raises interest rates despite these facts.

Update:  Here is one important reason for outsized median home price appreciation, and why builders find it more lucrative to focus on the high end market. Chinese all-cash buyers:
Chinese nationals have become the largest foreign buyers of US property after pouring billions into the market in search of safe offshore assets, according to a study.A huge surge in Chinese buying of both residential and commercial real estate last year took their five-year investment total to more than $110bn, according to the study from the Asia Society and Rosen Consulting Group.


Bonddad Wednesday Linkfest: Minimum Wage Edition

On Thursday, May 26, we'll be hosting our regular monthly wrap-up of economic and market events.  You can sign up at this link.


When the burger chain reported an increase in comparable sales for the third straight quarter late last month, CEO Steve Easterbrook said that the positive growth was in part linked to better employee benefits and higher wages.

Easterbrook said lower employee turnover and higher customer satisfaction were linked to employee compensation package improvements.

"The improvements we made to our compensation and benefits package to employees in U.S.-company operated restaurants, along with expanding [the tuition assistance program] Archways to Opportunity ... have resulted in lower crew turnover and higher customer satisfaction scores," Easterbrook said in a call to Wall Street analysts, Fortune Reported.


It is here in which the empirical research has been largely consistent, as summarized by economists Dale Belman and Paul Wolfson in a recent prize-winning summary of the reams of analysis of minimum wage increases:

[Moderate] increases in the minimum wage raise the hourly wage and earnings of workers in the lower part of the wage distribution and have very modest or no effects on employment, hours, and other labor market outcomes. The minimum wage can then, as originally intended, be used to improve the conditions of those working in the least remunerative sectors of the labor market. While not a full solution to the issues of low-wage work, it is a useful instrument of policy that has low social costs and clear benefits.

Here’s how Alan Krueger, an economist whose path-breaking work on minimum wages has deeply influenced economists and policy makers, put it in a recent piece:

When I started studying the minimum wage 25 years ago, like most economists at that time I expected that the wage floor reduced employment for some groups of workers. But research that I and others have conducted convinced me that if the minimum wage is set at a moderate level it does not necessarily reduce employment. While some employers cut jobs in response to a minimum-wage increase, others find that a higher wage floor enables them to fill their vacancies and reduce turnover, which raises employment, even though it eats into their profits. The net effect of all this, as has been found in most studies of the minimum wage over the last quarter-century, is that when it is set at a moderate level, the minimum wage has little or no effect on employment.

Alan goes on to point out that “…a $15-an-hour national minimum wage would put us in uncharted waters, and risk undesirable and unintended consequences.”


Wendy’s (WEN) said that self-service ordering kiosks will be made available across its 6,000-plus restaurants in the second half of the year as minimum wage hikes and a tight labor market push up wages.

It will be up to franchisees whether to deploy the labor-saving technology, but Wendy’s President Todd Penegor did note that some franchise locations have been raising prices to offset wage hikes.

McDonald’s (MCD) has been testing self-service kiosks. But Wendy’s, which has been vocal about embracing labor-saving technology, is launching the biggest potential expansion.

Wendy’s Penegor said company-operated stores, only about 10% of the total, are seeing wage inflation of 5% to 6%, driven both by the minimum wage and some by the need to offer a competitive wage “to access good labor.”


Tuesday, May 17, 2016

Good news and bad news in this morning's data


 - by New Deal democrat

We got two pieces of good news and two pieces of bad news this morning.

Let's start with the good news:  Industrial production jumped +0.7% - only the 4th monthly increase in 18 months (blue in the graph below).  While mining continued to decline, manufacturing (red) increased to tie its January record:


Again, adding to the evidence that the shallow industrial recession is bottoming out.

The second piece of good news is that real retail sales, and real retail sales per capita set new records:  


Since this is a leading indicator, it eases the concern that a recession might happen this year.

Now the bad news.  Consumer inflation ran "hot" in April, with owner's equivalent rent continuing to be the most important driver, although energy prices and medical device prices were an important assist:


Along the same lines, while housing permits and starts increased, they are still below last spring's post-recession highs, even excluding the northeast region (blue below) that includes the NYC distort ions from last spring:


While single family house permits came in only 2,000 below their December post-recession high, multi-unit housing continued to tank. Also, the February new high in single family permits was revised away:


There is a crying need for starter homes, but why should builders build them when there is so much more money in all-cash sales of high-end houses to well-off Chinese buyers?

So, two takeaways from this morning's data:

1.  Immediate recession risk is receding.  

2. There is absolutely zero reason for the Fed to raise rates in the inflation number, unless punishing prospective young American homebuyers is their objective.

Bonddad Tuesday Linkfest: Industrial Production Needs to Improve, Corporate Profits Lead, Goldman Ups Oil Price Target

On Thursday, May 26, we'll be hosting our regular monthly wrap-up of economic and market events.  You can sign up at this link.


Industrial Production Needs to Improve (Price Headley SA)

Also this week we'll get last month's industrial productivity and capacity utilization numbers. We desperately need a reversal of the strengthening downtrends from both. The market can shrug off a bit of downside volatility, but this deterioration has reached problematic levels.


The chart below shows measures of corporate health such as operating surplus, income, profits, and cash flow usually start falling 1 or 2 years before a stock market decline or the start of a recession. According to FactSet, the 1st quarter of 2016 was the fourth quarter of negative profit growth. This article evaluates profits as a leading indicator of the stock market and economy.


Goldman Ups Its Oil Price Target (FT)

Goldman Sachs is getting bullish on oil – sort of.

A supply deficit – driven by disruptions in Nigeria and robust demand – has led the US investment bank to upgrade its short-term outlook for oil, write Mehreen Khan and Neil Hume.

Goldman now expects WTI to average $45 a barrel in the second quarter of 2016, from an earlier March estimate of $35.


Oil Prices Daily


Energy Commodities 


XLEs Daily


XLEs/SPYs


Monday, May 16, 2016

Five graphs for 2016: May update


 - by New Deal democrat

At the beginning of this year, I identified graphs of 5 aspects of the economy that most bore watching.  Now that we have the data for the first 1/3 of the year, let's take a look at each of them.

#5 The Yield Curve

The Fed having embarked on a tightening regimen as of December, the question is, will the yield curve compress or, worse, invert, an inversion being a nearly infallible sign of a recession to come in about 12 months. 
Here's what has happened so far:


Rates on 2 year treasuries rose in advance of the Fed's move in November, but have since fallen to their pre-December range, while the 10 year treasury yield has continued to decline at a slow rate (typically long rates only start to fall once the tightening cycle has caused the economy to weaken). At 0.99% as of last Friday, however, the yield curve is still quite positive when seen in a historical perspective.

Weakness in the economy has put the Fed back on hold, but if the trend in rates were continue, then even as few as two more .25% rate hikes by the Fed could cause the yield curve to invert.

#4 The trade weighted US$

Perhaps the biggest story of 2015 was the damage done by the 15%+ surge in the US$ that began in late 2014 -- which not only harmed exports, but pretty much cancelled out the positive effect on consumers' wallets by lower gas prices.

Here there has been a big change:


Against all currencies, the US$ has recently ben in the range of +3% to +5% YoY  - a  more  typical range.  Against major currencies, the US$ has actually declined YoY.   This is good news.

#3 The inventory to sales ratio

An elevated ratio of business inventories to sales means that businesses are overstocked.  This has frequently but not always been associated with a recession.  I have been using the wholesalers invenotry to sales ratio, since it has fewer secular issues.  Here the news has not good this year, as the raito increased in January, although it fell ever so slightly in February and March:


This is probably the single worst statistic in the economy right now. 
#2 Discouraged workers

While 2015 saw a big improvement in involuntary part time employment, the number of those so discouraged that they did not even look for work, even though they want a job, went stubbornly sideways until the last quarter of 2015.  Although it has not borken through its December low,  and is still above its rate in the later part of the 1990s through 2007, in the first 4 months of this year, the trend has clearly been down: 


This looks like improvement, but we are still at least 500,000 above a "good" number.

#1 Underemployment and wages

The single worst part of this economic expansion has been its pathetic record for wage increases. Nominal YoY wage increases for nonsupervisory workers were generally about 4% in the 1990s, and even in the latter part of the early 2000s expansion.  In this expansion, however, nominal increases have averaged a pitiful 2%, meaning that even a mild uptick in inflation is enough to cause a real decrease in middle and working class purchasing power. 
There is increasing consensus that the primary reason for this miserable situation has been the persistent huge percentage of those who are either unemployed or underemployed, such as involuntary part time workers. 

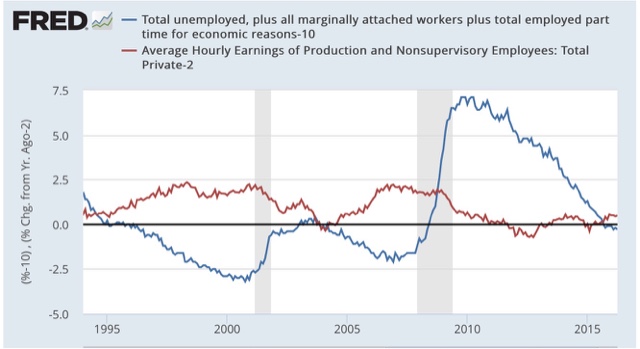
This expanded "U6" unemployment rate ( minus 10%)  is shown in blue in the graph below, toether with YoY nominal wage growth (minus 2%)!:


In the 1990s and 2000s, once the U6 underemployment rate fell under 10%, nominal wage growth started to accelerate.  U6 is now 9.7%, and there has been some mild improvement off the bottom.  More than anything, the US needs real wage growth for labor, and the present nominal reading of  2.5% still isn't nearly good enough.  With the expansion in deceleration mode past mid-cycle, it is not clear at all how much further improvement we are going to get before the next recession hits.

Bonddad Monday Linkfest; Americans Miss Unions, Renewable Energy Investments and Secular Stagnation

On Thursday, May 26, we'll be hosting our regular monthly wrap-up of economic and market events.  You can sign up at this link.


Americans Miss Unions, Not Manufacturing Jobs (538)


On average, manufacturing jobs still pay better than most jobs available to people without a college degree. The median manufacturing worker without a bachelor’s degree earned $15 an hour in 2015, a dollar more than similarly educated workers in other industries.1 But those averages obscure a great deal of variation beneath the surface. Average manufacturing wages are inflated by high-earning veterans; newly created jobs tend to pay less. And there are substantial regional variations. The average manufacturing production worker in Michigan earns $20.80 an hour, vs.$18.86 in South Carolina, according to data from the Bureau of Labor Statistics.

Why do factory workers make more in Michigan? In a word: unions. The Midwest was, at least until recently, a bastion of union strength. Southern states, by contrast, are mostly “right-to-work” states where unions never gained a strong foothold. Private-sector unions have been shrinking across the country for decades, but they are stronger in the Midwest than in most other parts of the country. In Michigan, 23 percent of manufacturing production workers were union members in 2015; in South Carolina, less than 2 percent were.2


Total Manufacturing Jobs Since the 1940s


Y/Y Percentage Change in Average Hourly Earings of Manufacturing Employees Since the 1940s


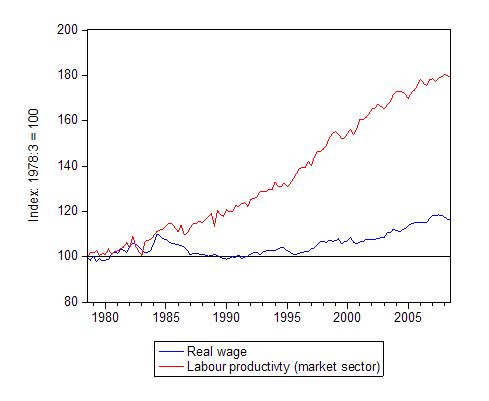
Chart Showing Productivity Growth and Wage Growth Since 1980


Exxon Mobil Corp. is partnering with a company to capture carbon-dioxide emissions from power plants. Total SA, the French oil supermajor, announced a $1.1 billion deal Monday to buy the battery maker Saft Groupe SA, complementing its 2011 purchase of a majority stake in the solar-panel maker SunPower Corp. And the Canadian pipeline company Enbridge Inc. announced Tuesday it will pay $218 million for stakes in offshore wind farms as it attempts to double its low-carbon generating capacity.

While fossil fuel companies have been dabbling in clean energy for years, they typically stayed close to their roots by focusing on ethanol and other biofuels. This round of investments takes them into the heart of the clean-energy industry. As crude prices struggle to recover and growth projections for renewables soar, oil companies see a chance to diversify.

“The supermajors recognize there is going to be tremendous growth in low-carbon sources of energy,” said Jason Bordoff, director of the Center on Global Energy Policy at Columbia University. “To thrive in the long term, they need a mix in their portfolio.”


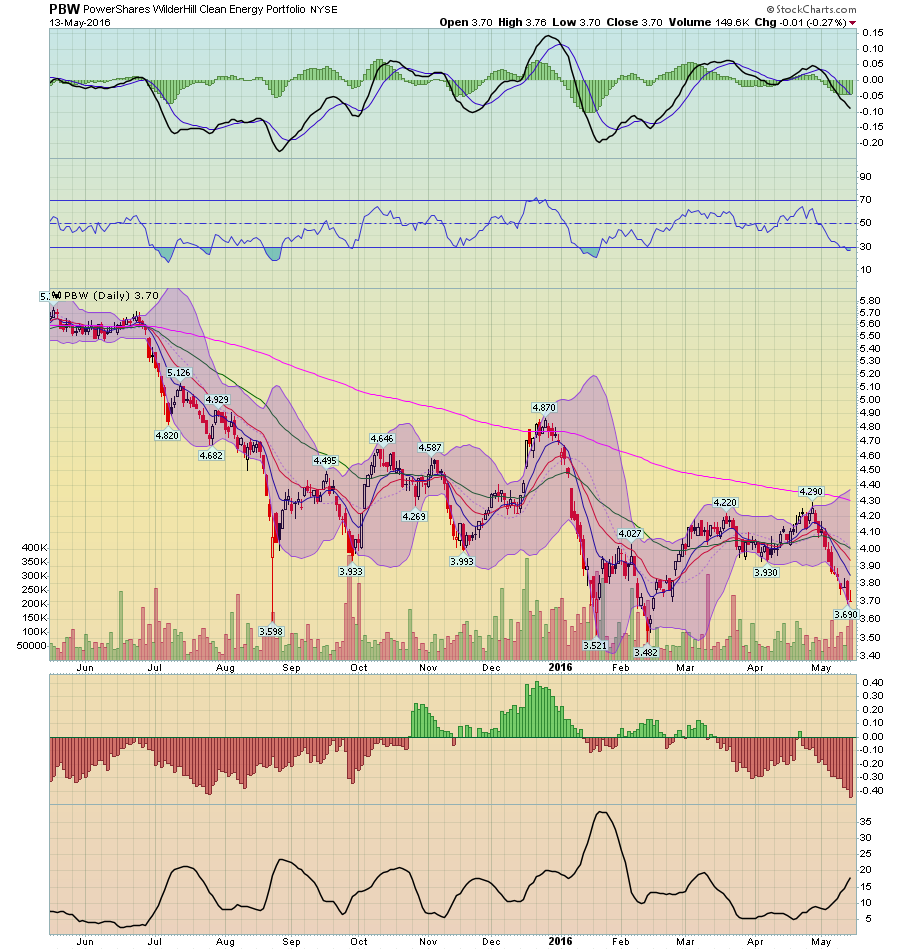
Solar ETF Daily Chart


Alternate Energy ETF Daily Chart


Energy Sector ETF


Energy Sector/SPY 


Summers’s deeper argument is that world growth is stuck in a rut because there’s a chronic shortage of demand for goods and services and a concomitant excess of desired savings. The U.S. and other industrialized nations tend to save more as their populations age, he says. Meanwhile, growing inequality puts a bigger share of the world’s income in the pockets of rich people; they can’t spend everything they make, so they save it. The investment that would ordinarily soak up those savings is falling short. That’s partly because the new economy is asset-lite: Companies such as Uber and Airbnb prosper by exploiting assets (cars and houses) that already exist. Software, which is pure information and doesn’t require the construction of factories, accounts for a bigger share of the economy. Slow growth in output and productivity reduces investment as executives lose faith in the payoff from capital spending.

Exhibit No. 1 in Summers’s case: Interest rates have been trending down for 30 years, even after taking into account the decline in inflation. The interest rate, like any price, reflects supply and demand. It’s fallen because the demand for loans is weak and the supply of loans from savers, who have extra cash to deploy, is strong. It used to be thought that interest rates couldn’t go below zero, but the Bank of Japan and the European Central Bank, among others, are so desperate to kindle growth that they’ve pushed some rates below what used to be called the “zero lower bound” into negative territory.

Saturday, May 14, 2016

Weekly Indicators for May 9 - 13 at XE.com


 - by New Deal democrat

My Weekly Indicator post is up at XE.com.  Rail traffic remains absolutely awful, and shipping isn't great either.  Aside from that, almost all signs of the shallow industrial recession are disappearing.

Friday, May 13, 2016

It's not different this time: the shallow industrial recession is ending


 - by New Deal democrat

At least if this week's data releases on producer prices and manufacturer, wholesaler, and retail sales can be believed, the data series that go back 70 and even 100 years that have reliably signaled the end of a slowdown or recession, did so again.

The post is up at XE.com.

Bonddad Friday Linkfest; Retail Sector Sell-Off and Other Items of Interest

Retail Stocks Sell-Off

The Retail ETF


The last year of Retail Sales


The Dividend Growth ETF


Meantime, the year-over-year change for claims in unadjusted terms looks troubling. New filings rose nearly 8% last week vs. the year-earlier figure before seasonal adjustment—the second straight weekly increase and the biggest annual jump in more than two years.

One bad week (or two) hardly constitutes a definitive signal for this leading indicator, which is notoriously volatile in the short term, and so it’s wise to reserve judgment for a bit. But the case for optimism is on a short leash until further notice.

It seems that we’ve run out of room for further disappointments in the weekly claims data. Today’s release may prove to be an outlier with minimal relevance for the US business cycle. But that explanation will melt faster than a snowball in August if next week’s numbers push new claims above the seasonally adjusted 300,000 mark for the first time in more than a year.


Initial Claims For Unemployment


Demand growth in the first three months of 2016 was 200,000 barrels a day higher than earlier anticipated at 1.4m b/d, the world’s leading energy forecaster said on Thursday, with India responsible for almost a third of the upward revision.

......

Although the IEA left its forecast for global demand growth unchanged at 1.2m b/d for the year, it said the risks to future forecasts was to the upside, citing gasoline demand growth which it said was growing “strongly in nearly every key market”.


On a rolling 12-month basis, the federal budget deficit hit a peak of almost $1.5 trillion in February 2010. From that dizzying height of just over 10% of GDP it fell steadily for six years, hitting a low of $402 billion last February, a mere 2.3% of GDP. It's unlikely to get any lower than that, unfortunately, unless and until we see stronger economic growth and/or significant reform to entitlement programs. For the foreseeable future, the budget deficit is likely to get bigger; it's already jumped to just over $500 billion as of last month. There are several culprits: weaker economic growth, weaker tax collections, and a pickup in spending. 


Thursday, May 12, 2016

Time To Short the Automakers?

     The following investment idea is VERY RISKY.  

ACCEPT THE FACT YOU COULD LOSE YOUR ENTIRE INVESTMENT.  

If this makes sense to you, buy in-the-money puts.    

     Motor vehicle sales were an 18.1 million annual rate in December 2015.  They fell to a 16.6 million annual pace in April, rebounding slightly to 17.4 million in May.  But big sales incentives drove the latest sales increase.  From the Detroit News:

Helping increase Fiat Chrysler’s April sales were some of the highest incentives in the industry of nearly $4,000 on average per vehicle sold, up 25.1 percent from a year ago, according to TrueCar.

That compares to a 14 percent increase at GM, with $3,909 in incentives, and a 24 percent increase at Ford to $3,423. The industry on average was up 13.3 percent to $3,021 in incentives per vehicle sold, TrueCar reports. 

Increased incentives eat into company profit margins.  They also signal consumers need increased coaxing to make the sale.

It’s possible that auto sales have topped for this cycle.  Consider the following chart from Econoday:


With the exception of the spike in 4Q15, this data series has moved sideways since September 2014. 

The following chart from Doug Short contains a 9-month moving average that shows a decline in the trend since the end of last year:


The broader picture of personal consumption expenditures also shows demand weakness:


Above is a 1-year chart showing the monthly percentage change in personal consumption expenditures (("PCEs"; blue bars) and PCEs of durable goods (red bars).  Monthly PCEs have slowed: the last 4 readings are barely positive.  Durable goods purchases contracted in 4 of the last 5 months.  Clearly, consumers are slowing their purchases.  And this is occurring within a broader slowdown in economic growth and slightly weaker employment gains.    

     Let’s now turn to the daily Ford and GM charts:


Both have similar technical characteristics.  For the last year, each has encountered strong technical resistance at the 200-day EMA.  Both have declining momentum.  Most importantly, both are right at short-term technical support. 

     Toyota is in worse technical shape:


     Momentum is negative.  Prices are near a 52-week low and they printed a very strong negative bar yesterday.  And there is added fundamental pressure on Toyota’s shares:

Toyota Motor is bracing for its first profit decline in five years as the stronger yen and growing recall costs threaten to crimp its growth prospects.

The world’s largest carmaker had enjoyed a steady period of record profits on the back of the yen’s fall since Shinzo Abe became prime minister in 2012.

But that trend has reversed recently as the company was hit by the rising yen, costs to recall and replace Takata-made airbags and disruptions to supply chains caused by earthquakes in southern Japan last month.

For the fiscal year through March 2017, Toyota forecast a 35 per cent year-on-year fall in net profit to ¥1.5tn ($13.8bn), below analysts’ consensus forecast for a profit of ¥2.2tn.

     The pieces have lined up nicely for shorting.  But please read the caveat at the top of this article.


I'd like to thank Hillary Clinton for stealing my idea


- by New Deal democrat

Three years ago I wrote a piece that got semi-wide attention in the blogosphere (ok, actually it didn't just disappear into a black hole, but still...):

 [T]he median wealth of people in the 55 - 64 cohort is something like $200,000 - but a non-trivial percentage of middle class workers ultimately reach this milestone [of having $1 million in wealth]. 
And you know what they would like to do more than anythings else?  Retire! I know this not only from personal conversations with my fellow fossils, but also through a discussion with an accountant recently in which he told me that the number one reason most of his older clients haven't retired yet is because they are afraid to before they are eligible for Medicare. Or they have to continue to work after age 65 themselves because they need their health insurance to cover their spouse until their spouse reaches age 65. 
Meanwhile, people like David Leonhardt in the New York Times are writing about Today's Idled Youth," describing how the ongoing Hard Times have hit the young perhaps harder than any other group. They bought into the American Dream of studying for a degree, becoming a professional of some sort, and hoping for a decent middle class existence. Instead, they are taking clerical or entry level service jobs, or even worse, unable to find a job.  
You can see where I'm going with this now, right? Here we have the older workers, hobbling to the finish line, but unable to end the race. And here we have young workers, itching to get started, and they can't because there are no jobs, or no middle class jobs, for them. 
And the one thing that would cause the many older workers who have saved for retirement to be able to leave the workfoce, and clear the way for those frustrated younger workers, is guaranteed medical care.
Fortunately, we have a program that provides exactly that: it's called Medicare, and according to those already on it, it works really really well. And it works at much lower administrative costs than for-profit private coverage .... (According to the CBO, Medicare's administrative costs are 2%, vs. 17% for for-profit plans. And Medicare premiums have consistently risen less than private health insurer premiums) . And also unlike for-profit plans, in Medicare there's no incentive to deny coverage.... 
....If you really and truly want to make a dent in the persistent employment problem facing younger workers, allow anyone age 55 or above to buy into Medicare. Charge them annual premiums equal to what they would have to pay into Medicare at their same wage or salary until age 65 if they continued to work. You would be amazed to see how quickly Boomers can still move, cleaning out their offices and cubicles, when properly motivated. And then younger workers could move right in. 
...[This] is a real solution to a real problem....
Yesterday's New York Times tells me:

[A]s she tries to clinch the nomination, Mrs. Clinton is moving to the left on health care and this week took a significant step in her opponent’s direction, suggesting she would like to give people the option to buy into Medicare.
“I’m also in favor of what’s called the public option, so that people can buy into Medicare at a certain age,” Mrs. Clinton said on Monday at a campaign event in Virginia.
Hey, I was just doing my part for the Progressive Agenda.  Nice to see the Establishement come around.  Hillary, can I send you my paypal account information so you know where to send the check?

P.S. to the humor-impaired.  Yes I know the public option has been around for a long itme.  But every once in a while, it's nice to think you may have caused a significant ripple in the pond.

Bonddad Thursday Linkfest: Krugman Will Crack You Up

Yesterday, I read that Donald Trump asked Larry Kudlow and Stephen Moore to "tinker" with Trump's latest tax plan.  I'm surprised anyone takes Kudlow seriously anymore.  And Heritage sold their soul a long time ago.

I wanted to write something pithy about this.  But then I read the latest Krugman Post on the topic:


This was in a post titled, "Send in the Clowns" which also included this picture:


On a more serious note, for the first time in my life, I am terrified of what might happen.  Trump has no depth and no understanding of nuance.

But at least I can laugh about it.  And thanks to Krugman for making that happen.

Wednesday, May 11, 2016

JOLTS encouraging, Labor Market Conditions Index less bad


 - by New Deal democrat

/this week we have two follow-up reports on the labor market: the Labor Market Conditions Index, and the JOLTS report.

Let's start with the LMCI.  As I have previously noted, the LMCI shows promise as a long leading indicator, as 40 years worth of data shows it turning negative usually a year or more before the onset of a recession:


This month's report was the 4th such negative report in a row, but the good news is that it was "less bad:"


This is another small addition to the evidence that 2017 might be a poor year.  It also suggests that monthly job gains, that have already decelerated from a 225,000 rate, will continue to do so.  In other words, export more reports of 1xx,000 to come.  But at the same time it is nowhere near as negative as it has been in the past at the onset of recessions.

Now let's turn to the JOLTS report.  While it is an extremely useful dissection of the labor market,  it has only existed for 15 years, and thus includes only one full expansion. 

For most of 2015 I was unimpressed with the report.  True, job openings (blue in the graph below) were soaring to new heights, but actual hires (red) stalled -- the same pattern as in 2005-06. late in the last cycle.  Three months ago openings decreased significantly - something which happened just before the 2007 recession started. Fortunately, that only lasted one month.  For the last 2 months improving openings and hires have been the case.  Here is the complete series:


The pattern from the last expansion was: first, hires peak.  Then, openings peak.

Here is a YoY look at the same data:


Openings had been rising faster than hires, which are have been barely positive.  Until two months ago, when hires soared to a new all-time high, as shown in the first graph above at far right.  Since then, the upward trend in hires has remained.

Some more good news was contained in the quits rate, which also continued in an uptrend, if not quite at their record of three months ago (red in the graph below):


This means that workers were confident enough in their prospects to voluntarily leave their jo bs.  Note that layoffs (blue) remained low.  Needless to say, the increase in voluntary quits is a significant positive.

Further, two months ago  Dean Baker made a point that there is "pent up damend" for quits, and therefore they should continue to all time record highs. Here's a link to a graph of the U6 underemployment rate (inverted) vs. Quits:


For every level of underemployment over the last 3 years or so, there have been more Quits than occurred during the last cycle -- supporting the  hypothesis of "pent up demand."

Taken together,  the LMCI continues to suggest a maturing but not expiring expansion, and this month's positive JOLTS report suggests that job growth has a ways to go.