Thursday, March 7, 2013

Who's Economically Healthy And Who's Not?

The following table is from the latest Taiwan export figures.  It shows the year over year and month over month percentage growth of exports to various regions of the world:


Feb.
Jan. - Feb.

Amount
As % of  All Exports
Annual Change Rate
Amount
As % of  All Exports
Annual Change Rate
Mainland China &   Hong Kong
7,216
36.6
-21.8
17,525
38.6
4.3
U.S.A.
2,056
10.4
-11.9
4,600
10.1
-4.2
Japan
1,427
7.2
0.5
3,013
6.6
8.7
Europe
1,871
9.5
-17.2
4,290
9.4
-7.3
ASEAN-6
3,947
20.0
-10.9
8,740
19.2
6.9


The first and most obvious point to make is the year over year numbers are down by large amounts.  This data point really highlights the slowdown that has occurred over the last 9-12 months, especially in China.  However, the slowdown to the EU region of 17.2% also highlights how that region's recession is really hurting global growth.

But also pay attention of the month to month percentage change in China, Japan and the ASEAN-6, indicating that overall this is where global growth is occurring right now.

Where's Growth? Part II: South America

Let's continue out look at happy chart porn, by showing you some of the various GDP prints from Latin America:

 Let's start with Mexico, which has been printing solid rates of growth for the duration of this expansion.


Peru has also been printing some impressive growth rates, again for the duration of the expansion.

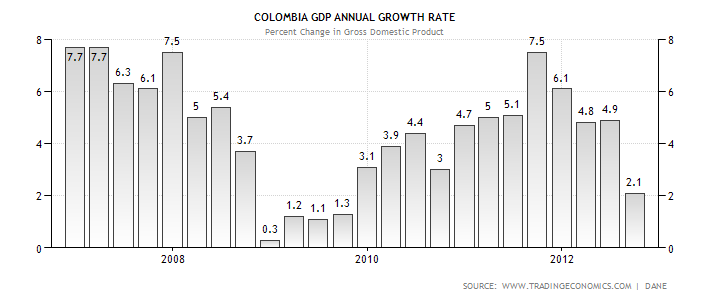
While the latest GDP print from Columbia is disappointing, the country has been printing some great numbers prior to that.

And finally there is Chile, which has been very impressive in its growth as well.


A note about initial claims


- by New Deal democrat

Weekly initial unemployment claims were reported this morning at 340,000. The 4 week average of new claims fell to 348,750 - a five year low.

Both of these numbers are close to what we would expect in a "normal" expansion, which I would expect to show claims of 335,000 or less.

I'd like to point out two things.

First, yesterday the forecasting service which initially forecast a recession beginning in August, September, or October 2011, issued a new report cherry-picking data series to back up version 4.0 of their claims (that being that recession started in July 2012. Version 2.0 was recession probably starting in the first quarter of 2012, and version 3.0 was recession starting by midyear 2012). For example, twice in the last century the stock market has continued to rise through a recession (and all of the other times it peaked before or shortly after the onset of the recession). So, we were told to ignore the stock market and focus on, inter alia, money velocity, which has been declining for several years - even though for the majority of recessions since World War 2, money velocity has risen into recessions and declined thereafter.

Well, initial jobless claims have never fallen to new lows after the onset of a recession. Not even once. Ever!

Which highlights the second point, which is that sequestration probably means that initial claims are shortly going to begin to rise. It is disgraceful that Washington DC is so myopic or malicious that it is willing to risk putting the economy back into a downturn just when employment - you know, the statistic probably most important to most people - is reaching this point.

Morning Market Analysis


After falling back to the 27 level, the homebuilding ETF has rallied, again reaching the 29.5 price level.  While the underlying technicals are positive -- the MACD has given a buy signal and the CMF has turned positive -- there is a weak volume reading that's mildly concerning.  However, no bull chart s perfect.


The Canadian dollar is in the middle of a drop.  The 6 month daily chart (top chart) shows that prices are at 6 month lows.  They broke through support at the 98-99 level earlier this month, and have continued to move lower.  On the 1 year daily chart (bottom chart) notice that the next level of support occurs at the 99-99.5 level.  Notice also the declining MACD for the last 9 months.


On the daily junk bond ETF, notice that prices broke the long-term trend in February and since then the trend line support has become resistance.


Finally, consider that the IEF's monthly chart still shows the treasury market in a long-term rally.


Wednesday, March 6, 2013

Latest ISM Data Points To Continiued Expansion

We've had both of the latest ISM numbers released over the last few days.  Let's look only at the anecdotal notes, as these give us some level of insight into what people are thinking and saying about the economy.'

From the services report:
  • "Our business is beginning to turn up slightly." (Health Care & Social Assistance)
  • "Business seems to be improving; RFQ volume and orders also up." (Management of Companies & Support Services)
  • "Continuing to see slight uptrend in activity, primarily related to 1st quarter initiatives started." (Finance & Insurance)
  • "Construction market showing some positive signs." (Real Estate, Rental & Leasing)
  • "The economy continues to slowly pick up, perhaps at an even faster pace than had been previously projected. New housing permits and business licenses are at a multiyear high, although still lower than pre-recession." (Public Administration)
  • "February bouncing back to forecast levels, which was 11 percent over 2012." (Wholesale Trade)
  • "Business is picking up; more projects to bid and things are improving." (Construction)
 All seven of the anecdotal points are positive and indicate that the level of business activity is increasing.  Notice that two specifically deal with construction, indicating that the housing market's improvement is very real.

Let's turn to the manufacturing sector:
  • "Automotive is still going strong, which allows budgeting for capital equipment." (Machinery)
  • "Overall business is good." (Food, Beverage & Tobacco Products)
  • "Starting to pick up after a slower than normal year-end." (Miscellaneous Manufacturing)
  • "Continuing slowdown in defense spending." (Computer & Electronic Products)
  • "More RFQs coming in than the past three months." (Nonmetallic Mineral Products)
  • "Workload is growing; need qualified machinists." (Fabricated Metal Products)
  • "Europe is still a concern in the auto sector." (Transportation Equipment)
  • "Business seems to be on an uptick. The normal seasonal downturn for us has been much shorter and not as severe as in the past four years." (Furniture & Related Products)
  • "Demand indicators are robust. Supply is constrained. Pricing is escalating." (Wood Products)
  • "Customer demand has softened. At first, that decline was consistent with seasonal patterns but has persisted beyond historical periods." (Chemical Products)
 Like the service numbers, the manufacturing points are mostly positive and indicate an overall uptick in activity.  Notice there are two areas of concern: the sequester and its effect on defense spending and Europe. 

What Will the Next Recession Look Like? Pt. III

So, now that we've established that the traditional causes of a recession probably won't be in play this time around and that the next recession stands a high probability of being shallow, let's consider when might cause the next recession and the effects thereof.  I believe there will be two potential causes: weak income growth will lead to a contraction in personal consumption expenditures and/or the slowdown in the EU will lead to a drop in export orders.  Let's start by looking at the slow growth of wages over the last recession:


While inflation has been low, it's still just enough to take a fairly large bite out of the above number.  This low level of income growth is the direct result of higher unemployment; a lower level of labor utilization leads to less upward pressure on wages.

Another way to look at the data is to analyze median incomes in the US.  As the above chart show, real median household incomes have dropped since 2000, with a pretty sharp drop since the beginning of the great recession.

At some point, weak income growth will lead to a drop in personal consumption expenditures; as consumers realize their incomes aren't increasing or keeping pace with inflation, they will "tighten their belts" and slow their purchases of "stuff."


The above graph shows the relationship between the year over year percentage change in PCEs and GDP, going back to just after WWII.  Notice the relationship is very strong, meaning a drop in PCEs (personal spending) will have a pretty strong impact on GDP.


Another way to look at the relationship is to look at the year over year percentage change in real retail sales and real GDP growth.  While the real retail sales data only goes back to the early 1990s, we do see a pretty strong relationship.

Put directly, with consumers accounting for 70% of US GDP growth, a slowdown in consumer spending would lead to an overall slowdown in the economic expansion.

The second most likely cause of a slowdown will be a drop in export orders caused by the European slowdown.  While exports only account for 13.78% of US GDP, they impact manufacturing, which can have a ripple effect in the economy as a whole.

The best way to show this effect is to graph the ISM's new export orders index and the year over year percentage change in exports:


The above data -- which regrettably only goes to 1992, does show a close relationship between the two data points.


The above chart shows the year over year percentage change in exports and GDP.  The relationship isn't as strong as that between GDP and PCEs.  However, there are times when some type of correlation does exist.

Looking at the data and composition of the economy, I think the most likely slowdown will come from a drop in PCEs; there is simply not enough income growth to warrant continued consumer spending expansion over the near long term.  


Morning Market Analysis

Short summary: the SPYs and DIAs each hit a new high yesterday. In addition, the underlying technicals of both are improving. But, three sectors are responsible for the rise: utilities, health care and consumer discretionary.  As two of these sectors are defensive, the strength of the rally is in questions.  In contract, the live cattle ETF is near year long lows.


The big news yesterday was the new highs in the SPYs (top chart) and DIAs (bottom chart).  The underlying technicals of both are similar.  Both have bullishly aligned EMAs (shorter above longer, all rising), prices using the shorter EMAs for technical support and an MACD that has given a buy signal.  The primary different is the DIAs have formed a rising wedge pattern and broken through top side resistance.


Interestingly enough, three sectors are responsible for the recent price action: health care (top chart), utilities (middle chart) and consumer discretionary (bottom chart).   There is no doubt that each of these charts is strong: the health care ETF is in the middle of a year-long rally; the utilities have rallied from a low in late November and consumer discretionary is also in the middle of a year long rally.  However, two of these sectors are defensive, bringing the recent price action into questions.


In contrast to the equity markets, the live cattle ETF came near to hitting a record low yesterday.  First, notice that for most of the last year, prices have been trading between roughly 27 and 29 -- about a 7.5% trading range.  Late last year, they broke the 200 day EMA, but after two attempts couldn't maintain upward momentum.  Since the beginning of the year, prices have been dropping sharply; momentum is weak and the CMF is negative.


Tuesday, March 5, 2013

Where's Growth? Part 1: Asia

Over the last few weeks, I've been focusing a fair amount of time on the EU situation.  So, to brighten things up, I want to show various spots in the world where we are seeing growth: various Asian and South American countries.

Let's start with Asia:

 Let's start with the obvious contender: China.  Despite all this talk of slowing down, the "slow down" is relative.  The country is still growing at a brisk 7.9% annual clip.

 Australia -- which supplies a large amount of raw materials to China and other Asian nations, is also growing at a healthy 3.1% clip -- probably the best rate of growth in the developing world.

 Taiwan slowed last year, but their latest GDP reading is very encouraging and should point to better prints ahead.

 Indonesia has been printing impressive rates of over 6% the last few years.
 Thailand's latest numbers are probably a bit high, but even if they return to their 3%-4% prints of the last few years, they'll still be showing decent growth.
And Vietnam is also showing good numbers.

What Will the Next Recession Look Like? Part II

In this post, I want to continue my thoughts on the next recession in the US, by nothing this point: it stands a high probability of being shallow.

As I noted yesterday, most recessions start as a result of interest rate increases, oil price hikes or the bursting of an asset bubble.  Consider the macro-level impacts of these events.  The former impacts the entire business community, driving up the cost of money thereby lowering loan demand for everyone.  The latter effects consumer spending, as higher energy prices take a bigger percentage of consumer purchases, thereby lowering discretionary income for spending on everything else.  And the collapse of an asset bubble effects everyone's confidence.

All three of the preceding events have one thing in common: they immediately have a large effect on wide swaths of the economy.  And once these effects are felt by those directly effected, the impact continues to more indirect areas of the economy.  For example, as business lending decreases, business expansions decrease, leading to a drop in employment, leading to a slowdown or drop in income.  As consumer spending drops, business profits drop, leading to a decrease in employment, leading to lower incomes etc... Asset bubble's breaking lowers everyone's confidence all at once.

The point of highlighting these standard recessionary causes is that because they impact a large percentage of the economy, they stand a higher chance of slowing the economy at a brisk pace.   But they also usually only occur when the economy is operating close to full capacity.  Inflation heats up when there is either sufficient demand to pull prices higher or insufficient supply of a commodity or group of commodities.  Oil prices spike because of increased demand which is the result of an economy operating near full strength.  And asset bubbles traditionally pop at the end of an economic expansion -- or cause same.

In contrast to the preceding events, the US economy is currently operating one or two steps above recessionary levels.

First, consider this chart that shows the year over year annual growth in GDP.


I've drawn a red line from the peaks of the current expansion through the other GDP data points.  Simply put, this expansion is a lot weaker.  While that's not good from the current perspective, it also means that the the economy has less far to fall.  Let's make the same point from two other economic data points.


Looking at the employment data, the top chart shows that the US economy is still 3 million jobs below the previous peak.  The second chart shows the unemployment level is still high by historical standards (we're nowhere near full employment) and the third chart shows that overall establishment employment growth has been weak.  Putting all of these charts together, we can make a convincing argument that employment levels are already at semi-recessionary or recessionary levels. 

Finally, consider this chart of real potential GDP and real GDP:


We're already currently operating below optimal potential capacity. As with the employment charts, we can make a good case that the economy is already operating at a semi-recessionary pace.

The some total of all the above charts is this: the US' current level of activity is just one step above recession.  It wouldn't take much to send us into negative growth.  But it also means the level of contraction stands a higher probability on being shallower, largely because the three primary causes of recessions won't cause the recession itself and we're already operating in a semi-recessionary environment.


Morning Market Analysis


Thanks to weak economic news coming from Europe, the euro is now is a technically weak position.  On the daily chart (top chart) note that prices have broken the uptrend that lasted from mid-November to mid-February.  Prices are now below the 200 day EMA, pulling the shorter averages lower.  Momentum is clearly negative, as is the volume inflow.

But the real technical damage is seen on the weekly chart (bottom chart).  Prices broke the uptrend that started at the end of last summe.  After getting above the 200 week EMA, prices moved lower and are now below all the EMAs.  The MACD has given a sell signal as has the EMF.


The Columbia ETF's daily chart is currently forming a rounding top patter.  Prices are now below all the shorter EMAs and the 10 day EMA has moved below the 50 day EMA (the 20 is about to follow).  21.50 is currently providing support.  A break of that level would make the 200 day EMA the next logical price target.


The Indian market ETF bears a striking resemblance to the euro ETF.  The daily chart (top chart) has broken a trend that started in mid-September.  Prices found resistance several times around the 62 level, but couldn't move higher.  Now prices are below the 200 day EMA.

On the weekly chart notice that prices have broken an uptrend that started at the end of last summer.  Prices are now below all the EMAs.  The MACD has given a sell signal and the CMF is very weak.

Monday, March 4, 2013

Why the Sequester is So Bad and Ill-Timed

At the end of every week, Barry over the the Big Picture posts a "succinct summation of the weeks' events."  Consider these points from last week:

2. Dow Jones Industrial Average made new 52 week highs for 6th week in a row.
3. U.S ISM Manufacturing index climbed to 54.2 from 53.1 in January.
4. Initial jobless claims better than expected (344k vs 360k)
5. Ford posts best February sales since 2006
6. Chicago PMI jumps to 56.8 11 month high
7. Orders for durable goods rose 1.9% (Ex-transport), increasing for 5th consecutive month.
8. New Home sales surge 15.6%
9. Home Depot’s profit jumped 32%, proxy for housing recovery.
10. Case Shiller Home Prices climbed 6.8% v one year ago and 0.88% from a month ago. Largest year over year gain since 2006.
11. Pending home sales up 4.5% to the highest levels since April 2010
12. Thomson Reuters/University of Michigan index of consumer sentiment climbed to 77.6 from 73.8 in January. Consumer Confidence jumps to 69.6 from 58.4


Stocks are at new highs, manufacturing is rebounding, autos sales are doing well, durable goods orders increased and the housing sector is healing. The sum total of all these events is very positive and indicates the underlying economy wants to shift into a higher gear.

And then comes the effects of the sequester, also from Barry's summation post:

7. The sequestration has arrived, an estimated 750,000 jobs will be lost.

Politico had a good summation of the first few rounds of effects, and they aren't good. Here are some high points from the story:

Sequestration officially starts Friday — most likely at 11:59 p.m., though Obama could act sooner — when the Office of Management and Budget issues a notice ordering agencies to make cuts of about 9 percent for most nondefense programs and about 13 percent for defense programs.
.....
Programs that dole out funding as an intermediary — like public rent assistance, farm loans and food programs — will see immediate cuts. The same goes for the Farm Service Agency’s loans, particularly those for small, family-owned farms, which face a cut of $5.4 million, resulting in 890 fewer direct farm aid loans.
.....
Monday, the bulk of the furlough notices will start going out.
.....
Commercial fishermen won’t like the news coming from the National Oceanic and Atmospheric Administration, which has warned that the budget cuts to its at-sea observers and fishery stock assessments could impede the opening of commercial fishing seasons in federal waters. Among the most high profile species: halibut season in California, Oregon, Washington and Alaska, which is scheduled to begin March 23.
At the Department of Education, $60 million will be cut from the Impact Aid program, which covers districts without large property tax bases, including students who live on military bases and Indian lands.
Teacher layoffs, changes to after-school programs and slicing off days for the 2013-14 school year also will start happening in March, Education Secretary Arne Duncan told reporters Wednesday. “Every school district, every superintendent worth their salt, every school board, they’re making their budgets now in the spring for the fall,” he said, adding that the pink slips will start coming in force from March to May.
The Agriculture Department’s programs for the poor also will see cuts in March, including the Women, Infants and Children program, which must cut its rolls by about 300,000 participants. Case workers will begin placing some who apply on a wait list, particularly those who are homeless or are non-breastfeeding mothers.
Fire season kicks in by mid-March, with the immediate budget cuts putting the Forest Service in a precarious place as it comes off one of the worst years on record in 2012 with the third-highest number of acres burned in U.S. history. Prep work takes place all year, but the $1 billion budget will be hit immediately.

The bottom line is there will be a slow but constant cutting in various programs, which will then in turn ripple out through the economy as a whole.  This at a time when the underlying numbers want to move higher.


What Will the Next Recession Look Like? Pt. 1

According to the NBER, we're almost four years into this expansion.  That means that, like it or not, we are closer to the next recession simply by definition.  So I think it's time to at least try an figure out what that will look like, simply to get a feel for what might be involved.

Let's start with this: the last recession was atypical and won't provide much much of a blueprint for the next recession.  The "Great Recession" was caused by a financial meltdown literally forcing the entire economy to seize up.  And, the ensuring recovery was greatly slowed by the de-leveraging process at the consumer level.  Now the financial system is in better health as are consumers, so the possibility of a repeat is fairly small.

So -- what would cause the next recession?  Historically there are usually two precursors to an economic slowdown: a hike in interest rates, which is initiated by the Federal Reserve to slow inflation (which is caused by an economy running a near full capacity) and a rise in oil prices.  To illustrate, here's a chart of the effective federal funds rate:


Notice the increase before each of the post WWII recessions.

Regarding oil prices, consider this from Professor James Hamilton:  Ten of the 11 recessions in the United States since World War II have been preceded by an increase in oil prices. 

In addition, a contributing factor (or perhaps the primary causation factor) of the last two recessions was the bursting of some type of asset bubble.  First we had the stock market bubble popping in 1999-2000 and then we had the housing bubble popping in 2006-2008.  Currently, there aren't any bubbles to pop, so this won't be a contributing factor either.

The above points lead to an interesting set of questions: given that we're at the zero lower bound for interest rate policy and with the US now producing far more oil thanks to the introduction of "fracking" will we experience an interest rate increase or oil shock anytime soon?  The answer to the first is obviously no: the Fed has publicly stated it will keep rates at current levels until unemployment is lower or inflation is higher than current levels.  The answer to the second is a bit harder to answer, but I do think the most probable answer is that the effects of a potential oil spike have been great ameliorated, barring a political or military situation in the Middle East.  And finally, consider that there currently no asset bubbles to pop, meaning this cause has been taken out of the equation as well.

So, to sum up this post, the traditional causes of a recession stand a low probability of occurring this time around.


Morning Market Analysis

Short Summary: The Japanese market is one of the bright spots across the globe; both the daily and weekly charts point to continued moves higher.  In contrast, the oil market is very weak on both the daily and weekly chart.  The dollar has been the primary beneficiary of the safety bid.


The daily Japanese ETF (Top chart) spent February consolidating in an ascending triangle pattern (stable top, rising bottom).  During this time the MACD remained fairly stable as momentum slowed.  Also note the prices remained entangled with the 10 and 20 day EMAs.  However, last week prices broke through resistance at the 10.20 level.  The MACD printed a buy signal and the CMF indicated volume flow was increasing. 

However, the real news for this ETF occurs on the weekly chart.  Prices have moved through all the Fib levels from the 2011-2012 sell off and printed a strong bar last week.  This, combined with the strong MACD and CMF position point to the 10.6 level as the next price target.


In contrast to the Japanese ETF we have the oil market, which is weakening.  The daily chart (top chart) shows that prices have moved through all the Fib fans and traded below the 50% Fib level established form the December-February rally.  Prices are also below all the EMAs, including the 200. 

The weekly chart (bottom chart) shows that prices -- which had broken out of a triangle consolidation in January -- have since retreated to below the top line of the triangle.  The MACD is weakening as is the CMF. 


On the daily dollar chart (top chart), we see the channel between 21.6 and 22 that the dollar traded between from December to late February.  However, as the dollar caught a safety bid, it moved though both the 22 and 22.2 level, printing some strong bars on solid volume.  Also note the rising MACD.

On the weekly chart (bottom chart) notice the 22.2 level was the only real level of price resistance.  Prices hit the 38.2% Fib level last week, but retreated.  A move through that level would make the 200 week EMA the next logical price target.

Sunday, March 3, 2013

The Supreme disgrace: 5 radicals want to repeal the 20th century


- by New Deal democrat

A few months ago I did some research into how long it took to create a fundamental change in Supreme Court decisionmaking. The result, with exceptions of course, is that it typically has taken 3 Presidential terms in a row of governance by the same party.

For example, the original Federalist court wasn't replaced with a majority of Democratic Republicans until the first term of President Madison. Not a single justice retired during FDR's first term. He finally had a appointed a majority in 1940. By the end of Truman's presidency in 1952, all 9 justices had been appointed by democrats.

Nixon and Ford's 8 years saw 5 appointments, but 3 of those were replacements of Eisenhower-appointed justices. The Supreme Court did not really lurch right until Justices Brennan and Marshall decided that Carter was insufficiently liberal, and decided to wait for a more suitable democratic president to get elected. Liberals got lucky when Brennan was replaced by Souter, but Marshall was replaced by Clarence Thomas. In the meantime, Chief Justice Burger was replaced with Rehnquist, and Justice Powell with Scalia.

By 1993, only Justice White remained as the sole Justice appointed by a democrat, John F. Kennedy. Of the 4 presently sitting justices over age 75, two are Clinton appointees, and the other two are Justices Scalia and Kennedy. The actuarial likelihood is that Obama will not be able to change the balance of this court during his second term. It will require a third consecutive term of a democrat as president for the balance of power to change.

In the meantime, with the replacement of the relative moderate O'Connor with the extremist Alito, there is a majority of 5 Justices who have made it plain that they intend to repeal virtually the entire 20th Century. The modern interpretation of the Commerce Clause behind almost all economic legislation since the New Deal came within a vote of being overturned lock, stock, and barrel in the Obamacare case. Even though Chief Justice Roberts looked into the abyss and decided to pull back, there is a new, restrictive doctrine about the Taxing Power of Congress that has appeared out of nowhere.

On Wednesday, we saw raw judicial power on display as Roberts, Scalia, and Alito made it clear that they are ready to declare the Civli Rights Acts of the 1960s unconstitutional. If the Justices believed that racial discrimiation in voting was not limited to the states of the Old Confederacy, then the remedy would be to extend the protection of the Voting Rights Act to all 50 states. Instead, the 5 radicals look like they are about to declare that if only some, but not all, bigots are prevented from discrimiating against black voters, then ALL bigots must be allowed to discriminate! Scalia went so far as to suggest that this decision is typically not left to Congress under the Constitution, despite the fact that, as I pointed out last week, PRECISELY to head off such an argument, the Congress that passed the Fifteenth Amendment specifically reserved to itself the Constitutional power to act. Scalia apparently intends to set himself up as judge of the Amendment itself, the specific intent of which was to create a "racial entitlement," namely, the entitlement of black citizens not to be discriminated against in the exercize of the vote. What I read of last Wedenesday's arguments strongly indicates that the radical 5 fully intend to ignore the intent of the framers of the Fifteenth Amendment, and to set themselves up as superlegislators.

Next up at the plate are gay rights. Despite the fact that all 4 appellate courts that have reviewed the Defense of Marriage Act have found it unconstitutional, the Supreme Court decided to take up those cases, along with the ruling invalidating California's Proposition 8. There is only one reasonable explanation for deciding to take up cases like this where there is unanimity in appellate court rulings, and that is that at least 4 Justices want to reverse. I strongly suspect that by this July 4th, we will live in a country where discrimination against gays is deemed a fit and proper purpose of legislative action.

The breadth of what this radical revanchist wing of the Supreme Court wants to accomplish is stunning. They want to declare the Civil Rights enactments and the New Deal era and subsequent economic enactments Unconstitutional. In other words, they want to make the entire liberal agenda that was enacted since 1932 against the law. Even democratic majorities in both Houses of Congress and a democratic President would be helpless to enact any modern legislation, faced with the near certainty of it being struck down by the Revanchist Five. The Court which rendered Bush v. Gore and Citizens United is dead-set on completing their counter-revolution.

P.S.: just so it's clear, I trust that Justice Ginsburg will retire at some point in the next three years, but the odds are substantially better than 50/50 that both Scalia and Kennedy will outlast Obama - but at least one of them will not last 4 years more.