Thursday, February 2, 2012

1953 Employment and Wages

The recession that started mid-year was (obviously) a very negative development for employment.


However, the unemployment rate didn't start moving higher until the fourth quarter, with a big spike in both November and December.


The big reason for the drop is the huge cratering of goods-producing jobs, which declined by more than 700,000 over the course of the year.


Service producing industries followed s somewhat different trajectory.  First, we see increases from January until October, but a pretty sharp drop in November and December.


And overall, we see a drop in government employment, largely as a result of the drop in defense spending related to the Korean war cease-fire.

As a result of the weakening employment picture, real DPI took a hit.


On a continuously compounded annual rate of change basis, real DPI contracted in the third and fourth quarter of 1953


Which we all see in absolute values above.

Below are the graphs from the Economic Report to the President


Hussman's, ECRI's (initial) recession warnings invalidated

- by New Deal democrat

The two primary proponents of the view that a new recession is beginning have been ECRI and John Hussman. As of now, we can say that Hussman's own metric invalidates his recession call, and that ECRI's initial recession call was also inaccurate.

While I have great respect for ECRI, when they made their initial recession call in September 2011, I wondered if they had misinterpreted a transient if violent downturn in manufacturing and consumer confidence, due mainly to the debt ceiling debacle and the consequent downgrading of US bonds, for typical short term leading indicators of recession. We can now say that it indeed appears to have been the case.

ECRI issued its private recession warning to clients on or about September 23, and went public with the warning on September 30. Their statement was unequivocal, Laksham Achuthan saying that recession was "imminent," and that he was
confident that the recession either began in the third quarter, which ends today, or will begin in the fourth quarter....

"We may be in a recession today already, or it may start in the next month or two."
[CNBC video with quotation embedded here.]

Achuthan also made it clear that he was relying not on GDP, but rather on the traditional NBER standards for determining a recession: industrial production, payrolls, real retail sales, and real personal income.

Well, the 4th quarter data is in, and here's where those four metrics stand:


All four finished 2011 at post recession highs. While certainly revisions to data are frequent, it will take some serious revising to cause enough of this data to turn negative to claim that a recession did begin by the end of last year. While subsequently ECRI backtracked and has revised the call to say a recession will begin by the end of June, their initial call must be regarded as busted.

Now let's turn to John Hussman. On August 8, 2011, John Hussman officially issued his "recession warning," saying that
the composite of economic and financial evidence we presently observe has always and only been associated with ongoing or immediately impending recessions. This is not an opinion or a viewpoint, but a fact of the data. "Always and only" is the Bayesian equivalent of "certainty"
The evidence he cited is the following composite, which he had set forth one week earlier, on August 1, 2011. The composite -- updated with my comments in italics -- is as follows:
1: Widening credit spreads: An increase over the past 6 months in either the spread between commercial paper and 3-month Treasury yields, or between the Dow Corporate Bond Index yield and 10-year Treasury yields.

NDD comment: this component is still in effect, as credit spreads have not significantly improved since falling in August, but this condition may be violated in about six weeks if there is no further deterioration.

2: Falling stock prices: S&P 500 below its level of 6 months earlier. This is not terribly unusual by itself, which is why people say that market declines have called 11 of the past 6 recessions, but falling stock prices are very important as part of the broader syndrome.

NDD comment: This condition has been violated as of one week ago. The S&P 500 is higher now than it was 6 months ago, and yesterday came within a hair of a 6 month high.

3: Weak ISM Purchasing Managers Index: PMI below 50, or,

3: (alternate): Moderating ISM and employment growth: PMI below 54, coupled with slowing employment growth: either total nonfarm employment growth below 1.3% over the preceding year (this is a figure that Marty Zweig noted in a Barron's piece many years ago), or an unemployment rate up 0.4% or more from its 12-month low.

NDD comment: This condition has also been violated as of the January ISM report of 54.1. If January nonfarm payrolls exceed 122,000, there will be a second violation as payroll growth will be more than 1.3% YoY. The unemployment rate has fallen by 1/2% in the last half year.

4: Moderate or flat yield curve: 10-year Treasury yield no more than 2.5% above 3-month Treasury yields if condition 3 is in effect, or any difference of less than 3.1% if 3(alternate) is in effect (again, this criterion doesn't create a strong risk of recession in and of itself).

NDD comment: This condition is still in effect. Of course, it was also in effect during most of the 1930's 10% YoY New Deal expansion, the entire 1940's, and the start of the 1950's -- coinciding with the strongest growth of the last 100 years.
Now, it's possible that there are differing levels for these 4 metrics signaling "recovery" for Hussman vs. their "recession" signals as claimed above, but if so Hussman should explain what those different recovery levels are. Otherwise, as of now, two of the four necessary metrics metrics making up his composite based on which he predicted an "imminent recesson" 6 months ago have been violated. Thus the original basis for his recession warning is also no longer valid.

As for the immediate future, the simple question is: can you really have a recession when housing (permits close to 3 year highs) and cars (sales at 3 1/2 year highs) won't play along? On a related note, this morning's initial jobless claims number of 367,000 was the first week not affected by seasonality, and tells us that the recent drop was very real. If the relationship between initial jobless claims numbers and payrolls for this recovery continues to hold, then we should expect January's payrolls report tomorrow to be similar to December's number -- generally, somewhere in the vicinity of +200,000.

Morning Market


Over the last few trading days, I've been watching the market very closely, looking for cracks in the rally.  While prices have been moving sideways for that time, there have been no strong downward moves, indicating we were in a period of consolidation.  This highlights the reason it's important to look at the market in multiple time frames; this wasn't as apparent on the daily time frame.


This is the chart that really highlighted the situation.  Notice how prices were finding support at around the 131 area.  The fact prices weren't moving through this level was, to me, very telling, as it indicated traders had a series of open buy orders around this level.  Yesterday, we see prices gap higher at the open.  However, we don't see them advance beyond the 133/134 level, telling us there is still resistance at this level. 


Again, the daily chart highlights the current situation in the detail we need.  The arrow is pointing to recent price action.  We see a cluster of bars around the 130/132 level, but no strong move above that level.  However, while we see strong volume indicators (A/D and CMF), we also see the MACD giving  a sell signal.  At minimum, this tells us to keep a watchful eye on the upside resistance areas/level (right around the 133.5 level).


The one negative with yesterday's price action is it more or less formed an upside down saucer formation with a sell-off near the end of trading on heavier volume.   


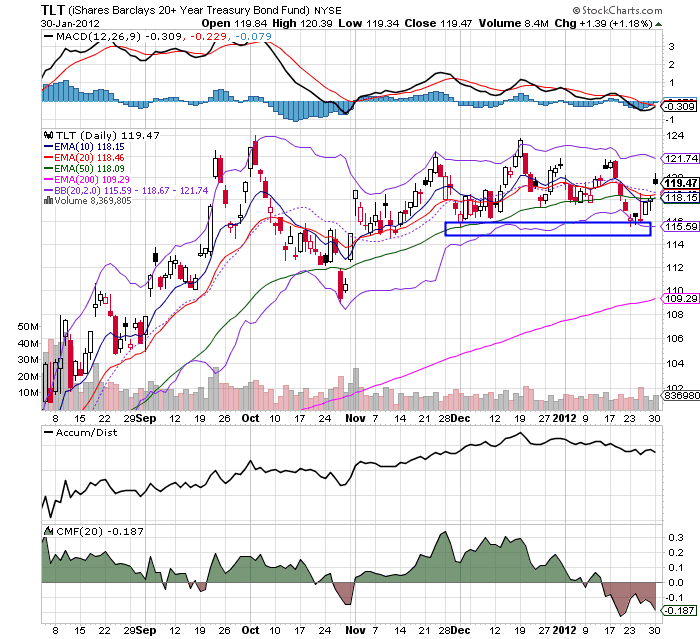
The long-end of the treasury curve is in a tight range with low volatility.  I don't see much chance for an upside break-out, given the lower yield that would occur.  So, keep you eyes open for the 116 price handle.


Industrial metals have consolidated recent gains around the 200 day EMA. The shorter EMAs and volume indicators are still bullish, but the MACD is headed to a sell-signal.

Wednesday, February 1, 2012

Bonddad Linkfest

  1. EU crisis causing a credit squeeze (FT)
  2. EU seeing a two-tiered manufacturing environment (WSJ)
  3. India and China see manufacturing growth (FT)
  4. Russia growth 4.2% last year (FT)
  5. US deficit set to top $1 trillion this year (WSJ)
  6. US home prices drop again (WSJ)
  7. Consumer sentiment (Conference Board)
  8. Steel demand slowing (BB)
  9. Commodity prices come back in January (WSJ)
  10. US leading and coincident indicators (Dr. Ed)

Where's the Crowding Out?


If the issuance of treasury securities were creating a problem for private companies, the above charts (the top for junk bonds, the bottom of high grade corporate bonds) would be the exact opposite -- they'd both be heading south.  However, we're seeing a rally in both sectors, telling as there is ample private demand for these securities.  That probably has something to do with record low interest rates in the treasury market, which means investors will be looking for higher yielding assets.

1953: Investment


The above chart shows the dual nature of 1953's investment picture.  In the 1Q, overall investment added 1.2% to overall GDP growth, with equipment and software accounting for the lions share of the investment.  However, even in the first quarter, we see that inventory investment subtracted a fair amount from growth.  This trend became far more pronounced by the end of the year, when the inventory contraction accounted for a large drop in the overall contribution of investments to GDP growth.

As the Federal Reserve's report for the year explains, the drop in war spending is a big reason for the drop:
After midyear the pace of economic activity slackened appreciably as business buying for inventory dropped sharply and as fresh expansive forces were lacking. At this time reductions in defense spending came to be more widely anticipated. A truce in Korea was agreed to in July, and international tensions appeared to be easing somewhat. Business concerns and the armed services reduced new ordering and, with new orders below shipments, unfilled orders declined sharply from earlier high levels. Reflecting the effect of reduced output accompanying these developments, the buildup of business inventories, which had been at a seasonally adjusted annual rate of 6 billion dollars in the second quarter, was considerably retarded in the third quarter and turned into moderate liquidation in the fourth quarter. At that time, as the chart shows, stocks were being reduced by both manufacturers and distributors. The principal reductions were in stocks of durable goods, which earlier had advanced most.
Here is the accompanying chart:

I'll explain the recession that started mid-1953 in more detail later.  However, as production dropped from the drop in war spending, we also see a drop in consumer purchases of heavier items (cars and furniture/household goods).  Hence, the economy was hit by a double-whammy of declining consumer and government demand.   

Morning Market


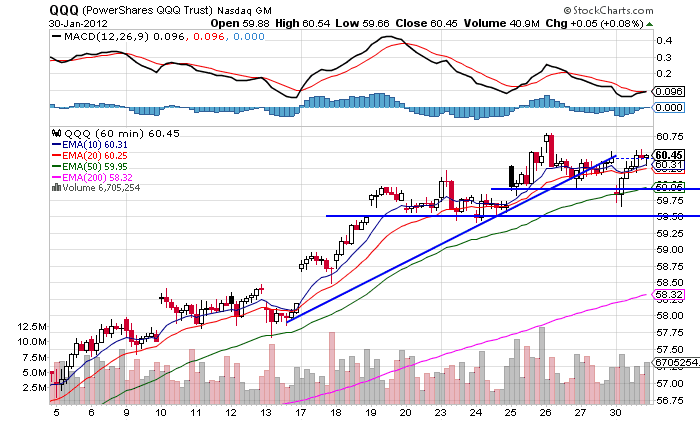
Remember: what we're looking/waiting for in the equity markets is a move through support.  So far, all, we've gotten in terms of price action is sideways movement, indicating the selling pressure isn't there -- at least, not yet.

The following price levels still hold:

IWM: 79
QQQ: 59.50 - 60.25 area
SPY: 131


Copper is still rallying.  Prices have moved higher, the volume indicators show new money coming into the market and the MACD is still positive.  However, the MACD is also near to giving us a sell signal, which will become more important if we see prices move through technical support  -- especially the 200 day EMA.


The euro have broken through the upper trend line of its downward sloping channel, and is now hitting resistance at the early October lows.  The shorter term EMAs (the 10 and 20) are both rising, momentum is positive and money is flowing into the market.  A move through the 131 area would give us a new price target of 135.3 (the 200 day EMA). 


In contrast to the euro, we have the dollar, which is now clearly in a downtrend.  Prices are right at the 200 day EMA, but there are numerous, bearish indicators.  The shorter EMAs are moving lower, the CMF and A/D are printing negatively, and momentum is down. 

Tuesday, January 31, 2012

Bonddad Linkfest

  1. Political polarization is at a its highest level now (WaPo)
  2. Insider trading and Buffet rule legislation advances (NYT)
  3. Turkey is hawkish on inflation (WSJ)
  4. German retail sales drop (WSJ)
  5. Eurozone joblessness at high (FT)
  6. Treasury seeks to borrow $444 billion in 1Q12 (Yahoo)
  7. EU banks will tap ECP lending facility again (FT)
  8. Senior loan officer survey (FRB)\
  9. Incomes rise, spending stagnant (FT)
  10. Spain's economy shrinks (WSJ)

Feds Release the Senior Loan Survey

From the FRB:
Overall, in the January survey, domestic banks reported that their lending standards had changed little and that they had experienced somewhat stronger loan demand, on net, over the past three months. Foreign respondents, which mainly lend to businesses, reported a net tightening of their lending standards while loan demand was about unchanged.2

Regarding business loans, domestic banks reported, on balance, little change in standards on commercial and industrial (C&I) loans but a continued easing of pricing terms on such loans during the fourth quarter.  Domestic banks reportedly experienced stronger demand for C&I loans from firms of all sizes on net. The net fraction of banks reporting increased demand from small firms rose to its highest level since 2005.3 Foreign respondents reported having tightened both standards and terms on C&I loans, on net, and they indicated that loan demand had been about unchanged over the past three months. Domestic banks continued to report little change in their standards for CRE loans, but modest net fractions had eased some loan terms over the past year. Moderate net fractions of domestic banks reported that demand for CRE loans had strengthened in the fourth quarter. Modest net fractions of foreign respondents reported having tightened standards for CRE loans. Foreign respondents also reported, on balance, little change in demand for such loans.

On the household side, lending standards and demand for loans to purchase residential real estate were reportedly little changed over the fourth quarter on net. Standards on home equity lines of credit (HELOCs) were about unchanged, while demand for such loans weakened on balance. Moderate net fractions of banks reported that they had eased standards on all types of consumer loans over the past three months, and some banks also eased terms on auto loans.  Demand for credit card and auto loans reportedly had increased somewhat, while demand for other types of consumer loans was about unchanged.


1953 PCEs


1953 is a year with two sub-parts.  The first two quarters we see decent growth.  In the first quarter, the growth is pretty even, spread among durable, non-durable and service purchases.  In the second quarter, we see a slight drop in durable good purchases.  In the third quarter, non-durable goods purchases subtracted sharply from growth, while durable goods and lack of service purchases were the reason for the drop in the fourth quarter.


The above chart is fascinating, as it puts PCEs in perspective for the early 1950s expansion.  Overall durable goods purchases remained fairly constant, coming in between $25 and $30 billion.  However, service purchases continued to increase, moving up constantly for the entire expansion.  Non-durables topped-off in 1953 and moved slightly lower in 3Q53 and 4Q53.

The above chart chart places the preceding observation into more detail.  This expansion was about autos and homes, as evidenced by the purchases of autos and furniture.  Also note how housing services continued to rise.  Finally, food purchases saw strong gains, probably because we were still dealing with a culture that was getting away from war rationing. 


The above chart of various consumer goods outputs really highlights the extent of the growth in consumer spending.  In 1950, we made 3 million TVs.  That number nearly doubled by 1953.  Air conditioner output increased by a factor of 10!  Clothes dryer output doubled. 

This was the consumer on steroids.

Morning Market


Remember: what we're looking/waiting for in the equity markets is a move through support.  So far, all, we've gotten in terms of price action is sideways movement, indicating the selling pressure isn't there -- at least, not yet.

The following price levels still hold:

IWM: 79
QQQ: 59.50 - 60.25 area
SPY: 131


Copper is still rallying.  Prices have moved higher, the volume indicators show new money coming into the market and the MACD is still positive.  However, the MACD is also near to giving us a sell signal, which will become more important if we see prices move through technical support  -- especially the 200 day EMA.


The euro have broken through the upper trend line of its downward sloping channel, and is now hitting resistance at the early October lows.  The shorter term EMAs (the 10 and 20) are both rising, momentum is positive and money is flowing into the market.  A move through the 131 area would give us a new price target of 135.3 (the 200 day EMA). 


In contrast to the euro, we have the dollar, which is now clearly in a downtrend.  Prices are right at the 200 day EMA, but there are numerous, bearish indicators.  The shorter EMAs are moving lower, the CMF and A/D are printing negatively, and momentum is down. 

Morning Market

The IWMs (Russell 2000) fell below a longer-term technical uptrend, but found support at a high established early on the 23rd right below the 79 handle. 


The QQQs found support at a price from the 25th.  Also note the strong level of support from the 19th.  Both of these levels are centered around the 59 handle.


The SPYs opened the day lower, but rallied into the close.  The 131 level is very important.  However, prices are already below an upward sloping trend line.


What I find very interesting -- and telling -- is that both the QQQs and SPYs rallied today, with the QQQs ending the day slightly positive.  That's tells us there is still a strong bid in the market.

The above equity charts show that, despite the desire to drop, the indexes are holding onto support.  The following levels are approximate technically important levels to watch for:

IWM: 79
QQQ: 59.50
SPY: 131


The IEFs rallied to the top end of the their recent trading range, right around the 106 level.  Notice how tight both the EMAs and MACD is; there is literally no momentum in either direction.


Like the IEFs, the TLTs are in a fairly tight range between  116 and 122.  The MACD has a slightly downward bias, but it's not strong enough to lead to a short-selling opportunity just yet.

Right now, the treasury market is catching a bid from the safety trade.  However, with yields this at very low levels, it's difficult to see much of a rally from these levels.  On the equity side, we see indexes re holding their own -- at least for now.


Monday, January 30, 2012

1952: Compilation

The following posts are all part of the Bonddad Economic History Project's 1952 series.

GDP 
PCEs
Investment
Exports and imports
Employment and income
Government receipts
Inflation and Fed Policy


Bonddad Linkfest

  1. Architectural billings increase (BB)
  2. 5-year treasuries hit record low yield (BB) 
  3. Hedge funds increase bullish commodity bets (BB)
  4. Portugal sees bond yields spike (FT)
  5. How the EU crisis is bullish for commodities in the medium term (FT)
  6. Gold hits 7-week high (FT)
  7. The austerity debacle (NYT)
  8. BEA's personal income and spending report (BEA)
  9. South Korea's current account falls (WSJ)
  10. Cattle herd the lowest in 60 years (WSJ)

We're All Keynesians Now

The New Yorker Magazine has a great piece on economic policy in the early years of the administration.  It is written by Ryan Lizza and is one terrific piece of journalism.  It is very detailed and nuanced -- which of course means that very few will actually read it.

Part of the article is based on a memo from Larry Summers to the President regarding the fiscal stimulus.  Here is a link (PDF) to the entire article -- which I also recommend you read as it's a fascinating analysis of a very difficult time. 

At this point, it's important to note a big difference in the economic world: there are those who believe that Keynes was correct in his economic analysis, and that Keynes basic ideas have been repeatedly born out by history and data. Then there is the Chicago school of economics who live in a fantasy world where economic models are populated by "rational individuals" and prices aren't sticky (seen a chart of housing prices recently?)   Need I say more?  Simply put, history and data clearly show that targeted government spending boosts economic growth. Hence, note the wide swath of people and organizations who supported the idea of stimulus:
• Robert Reich believes it should be $1.2 trillion over two years, but also indicated it could be larger.
• Joe Stiglitz believes it should be $1 trillion over two years.
• Paul Krugman: at least $600 billion in one year
• Jamie Galbraith: $900 billion in one year
• Institute for America's future (signed by Dean Baker, Andy Stern, Leo Gerard, John
Sweeney, and others): at least $900 billion

Republican Economists

Marty Feldstein was an early proponent of a spending-only package and currently
believes it should be $400 billion in the first year.
• Larry Lindsey, a former Federal Reserve Governor and NEC Director, estimates that
$800 billion to $1 trillion is desirable.
Ken Rogoff (widely respected macroeconomist, former chief economist of the IMF,
former McCain adviser): $1 trillion over two years
• Mark Zandi (widely quoted economist, fom1er McCain adviser): at least $600 billion in one year

Others:

• Senior Federal Reserve officials appear to be of the view that a plan that well exceeds
$600 billion would be desirable.
• Adam Posen (Deputy Director of the Peterson Institute): $500 to $700 billion in one year
• Goldman Sachs: $600 billion in one year
• Open Letter signed by 387 economists including Nobel Laureates Robert Solow, George
Akerlof, and Joe Stiglitz on November 19th [note that most economists, including Stiglitz,
support higher stimulus numbers today than they did a month ago]: $300 to $400 billion
per year
Put another way, it's not if we should do this, but how much we should spend.
I should add, I would fully expect some Republicans to now argue that none of the Republicans quoted are in fact "real Republicans" but merely RINOs.

Again, this is not rocket science.  In fact, it's simple addition.   

A Closer Look At Manufacturing.

As we close out January, let's take a look at the overall state of US manufacturing.

New York appears to be rebounding somewhat:

The Empire State Manufacturing Survey indicates that manufacturing activity expanded in New York State in January. The general business conditions index climbed five points to 13.5. The new orders index rose eight points to 13.7 and the shipments index inched up to 21.7. The prices paid index was positive and slightly higher than it was last month while the prices received index jumped twenty points to 23.1, indicating a significant pickup in selling prices. Employment indexes were positive and higher, pointing to higher employment levels and a longer average workweek. Future indexes conveyed a high degree of optimism about the six-month outlook, with the future general business conditions index rising nine points to 54.9, its highest level since January 2011.
While these are not readings on the level of what we saw last year, they are an improvement from the 4Q11 when indicators went negative for a few months.

Philly appears to be in more or less the same boat:
The survey’s broadest measure of manufacturing conditions, the diffusion index of current activity, edged up slightly from a revised reading of 6.8 in December to 7.3 in January.* The demand for manufactured goods showed continued growth this month: The new orders index remained positive for the fourth consecutive month but declined from a revised reading of 10.7 in December to 6.9 this month. The shipments index also remained positive but fell 3 points. The indexes for both delivery times and unfilled orders recorded slightly negative readings this month.
Richmond reported similar numbers:
In January, the seasonally adjusted composite index of manufacturing activity — our broadest measure of manufacturing — increased nine points to 12 from December's reading of 3. Among the index's components, shipments gained fourteen points to 17 and new orders doubled, picking up seven points to finish at 14. The jobs index picked up eight points to 4.

Most other indicators also suggested stronger activity. The capacity utilization indicator advanced eight points to finish at 8, while the index for backlogs of orders gave up five points to end at −4. Additionally, the delivery times index was almost unchanged at 3, while our gauges for inventories were mixed in January. The finished goods inventories index lost fourteen points to 9, while the raw materials inventory index gained five points to end at 18.
Texas manufacturing, however, was weaker:
Texas factory activity weakened slightly in December, according to business executives responding to the Texas Manufacturing Outlook Survey. The production index, a key measure of state manufacturing conditions, posted a second negative reading but moved up from –5.1 to –1.3. This suggests a slowing of the pace of decline.


Other measures of current manufacturing conditions indicated flat activity in December. The new orders index suggested stagnant demand, registering a near-zero reading after dipping into negative territory last month. The shipments index was little changed from its November reading and continued to suggest flat shipment volumes. The capacity utilization index was also near zero although it rebounded from last month, rising from –10.2 to 0.7.
Kansas, however, was printing just over 0:
The month-over-month composite index was 7 in January, up from revised totals of -2 in December and 4 in November (Tables 1 & 2, Chart).  The composite index is an average of the production, new orders, employment, supplier delivery time, and raw materials inventory indexess  Manufacturing activity increased in both durable and nondurable goods-producing plants, with
particular strength in chemical, fabricated metal, and aircraft production. Most other month-over-month indexes also improved in January. The production and shipments indexes jumped to their highest levels since June, and the new orders index climbed from -2 to 8. The order backlog index was positive for the first time since last summer, and the employment index rebounded from -5 to 9.  The new orders for exports index increased and the raw materials inventory index  moved higher, while the finished goods inventory index was unchanged.
The Chicago Fed's Midwest Index also increased in it's latest report:


The Chicago Fed Midwest Manufacturing Index (CFMMI) increased 1.7% in December, to a seasonally adjusted level of 87.4 (2007 = 100). Revised data show the index was unchanged in November. The Federal Reserve Board’s industrial production index for manufacturing (IPMFG) increased 0.9% in December. Regional output in December rose 8.4% from a year earlier, and national output increased 4.0%.


At the national level, industrial production is still going fairly well:
Industrial production increased 0.4 percent in December after having fallen 0.3 percent in November. For the fourth quarter as a whole, industrial production rose at an annual rate of 3.1 percent, its 10th consecutive quarterly gain. In the manufacturing sector, output advanced 0.9 percent in December with similarly sized gains for both durables and nondurables. The output of utilities fell 2.7 percent, as unseasonably warm weather reduced the demand for heating; the output of mines moved up 0.3 percent. At 95.3 percent of its 2007 average, total industrial production in December was 2.9 percent above its level of a year earlier. The capacity utilization rate for total industry rose to 78.1 percent, a rate 2.3 percentage points below its long-run (1972--2010) average.
Here's a chart of IP's overall progress:


While still below recession levels, we're still moving consistently higher.

And the latest ISM was good:


"The PMI registered 53.9 percent, an increase of 1.2 percentage points from November's reading of 52.7 percent, indicating expansion in the manufacturing sector for the 29th consecutive month. The New Orders Index increased 0.9 percentage point from November to 57.6 percent, reflecting the third consecutive month of growth after three months of contraction. Prices of raw materials continued to decrease for the third consecutive month, with the Prices Index registering 47.5 percent, which is 2.5 percentage points higher than the November reading of 45 percent. Manufacturing is finishing out the year on a positive note, with new orders, production and employment all growing in December at faster rates than in November, and with an optimistic view toward the beginning of 2012 as reflected by the panel in this month's survey."


The ISM index moved lower at the end of last year but stayed about 50.  Now it's moving higher again, although the move so far is preliminary.

Overall, manufacturing is again moving in the right direction, which jibes with the latest Beige Book's manufacturing report:
Manufacturing activity expanded in most Districts, generally continuing its steady overall expansion or, in the case of Atlanta, reversing a slowdown in prior periods. For the sector as a whole, further growth or improved conditions were reported by almost all Districts, except for Cleveland, Richmond, and Dallas, which reported that activity was largely stable or mixed, and Kansas City, which noted a slight decline. The strongest reports came from subsectors such as heavy equipment manufacturing and steel, for which demand has been boosted by robust growth in the energy, agricultural, and auto manufacturing sectors. Reports from Cleveland, Richmond, Atlanta, Chicago, and St. Louis confirmed vibrant activity for auto manufacturers, primarily for domestic makes. By contrast, demand remained somewhat weak for firms in housing-related subsectors, such as a door manufacturer in the Richmond District, furniture manufacturers there and in the St. Louis and San Francisco Districts, and makers of lumber and wood products in the San Francisco District. Demand for computers and related electronic components rose further, according to Kansas City, Dallas, and San Francisco. However, the pace of growth has slowed significantly from earlier in 2011, and Boston noted declining sales of semiconductors, mainly due to weaker demand from Asia. According to Dallas and San Francisco, aircraft makers saw further demand increases. Those Districts also noted weak domestic demand for refined petroleum products that was largely or completely offset by robust foreign demand. Demand grew smartly for food producers in the Philadelphia and Dallas Districts, but in the Kansas City District food processing was one of the weakest performers within the manufacturing sector. Export sales of assorted manufactured products generally performed well according to Atlanta and Chicago, although slower economic growth in China and Europe held back sales for some manufacturers.

Cleveland reported that capacity utilization remained below normal in most subsectors, with the notable exception of steel producers, who were operating at or near normal levels. Similarly, Chicago noted that some auto suppliers appear to be approaching capacity constraints, which may limit further production increases in the near term. Atlanta reported that recent flooding in Thailand was likely to exert modest restraint on auto production. Ongoing capital investments and increases in capacity were reported for various manufacturing concerns in the St. Louis and Minneapolis Districts and for an auto producer in the Richmond District.

UPDATE: The Dallas Fed printed their number today, and it was beter:

Texas factory activity increased in January, according to business executives responding to the Texas Manufacturing Outlook Survey. The production index, a key measure of state manufacturing conditions, rose from 0.2 to 5.8, suggesting growth resumed this month.

Other measures of current manufacturing conditions also indicated growth in January. The new orders index jumped to 9.5, its highest reading in six months, after two months in negative territory. Similarly, the shipments index turned positive after two negative readings, rising from –1.1 to 6.1. Capacity utilization increased further in January; the index moved up from 4 to 8.5. Twenty-eight percent of manufacturers noted higher capacity utilization, the highest share in nine months.


Morning Market: Is The Rally Over?


The 60 minute chart shows that prices moved sideways last week, using 131 as support.  However, the overall uptrend is still intact


The 30 minute chart shows last week's price action in more detail.  Monday and Tuesday were technically meaningless.  On Wednesday, we see the rally inspired by the Fed's minutes, but that was completely erased by the end of trading on Thursday.  Friday we see a saucer formation that never really materialized.  


The weekly chart tells the real story: after consolidating in a symmetrical triangle pattern at the end of last years, prices broke higher.  However, last week prices printed a spinning top candle pattern, which is considered a sign of a halt to the rally.


The treasury market, on the other hand, had a good week, as prices caught a bid.  Notice how the entire curve rallied last week, bouncing off of technical support.  By publicly stating that they were not going to raise rates until 2014, the Fed told the market the current crop of treasury bonds was as good as it was going to get from a yield perspective for quite sometime, thereby making current issues that must more valuable.

So we have a sideways equity market and a rallying treasury market.  That means we're seeing some stalling in the overall risk-on move of the preceding weeks.  Some of this is technical; market don't rally forever.   In addition, on the shorter charts, we didn't see a big move lower; merely a consolidation sideways.  However, we do want too keep our eye on support levels going forward.


Industrial metals are still in a strong rally.  Prices have moved through important resistance levels, and the now the shorter EMAs are moving lower.  We also see the MACD, A/D and CMF point to continued rallying.  Some of this rally is caused by a weakened dollar, but that doesn't account for the entire rally.


The dollar has been dropping for the last few weeks. After consolidating sideways in mid-January, prices have been consistently moving lower.  Part of this is the result of a strengthened euro, which was in turn caused by the EU appearing to be closer to solving their problems.  The more recent move lower, however, was caused by the Fed keeping rates low for a few years. 


The dollar's daily chart is now very bearish; the momentum and volume indicators are all moving lower and prices have moved through support.

What's important here is the fundamental reason for the sell-off.  First, we have money moving back into the euro at the expense of the dollar.  In addition, the Fed has stated they will be very accommodating for several years.  The first scenario is positive for the US economy, assuming the momentum continues.  The second is also positive, as lower rates should increase borrowing. 

Overall, it appears the markers are pausing -- at least so far.  A big reason for my thought there is the underlying market situation: last week, the following was the order of top five best performing sectors: basic materials, consumer discretionary, industrials, technology and utilities.  Four of those five are riskier market sectors, and utilities probably rose because of an expectation of long-term low interest rates which makes high yielding utility stocks attractive.  In addition I also think the rally in industrial metals is telling.

But, like all pauses, it's important to keep an eye open to all possibilities.   


Sunday, January 29, 2012

Weekly Indicators: continuing positive trends edition

- by New Deal democrat

First, as to the monthly reports, home sales continued poor, but consumer confidence jumped back further, completely regaining its pre-debt debacle levels. In the rear view mirror department, 4Q 2011 GDP was +2.8% although some internal components were weaker. Those few sources who thought a new recession might begin by the end of 2011 were almost certainly wrong.

Turning now to the high frequency weekly indicators:

Weekly employment-related data was mixed.

The BLS reported that Initial jobless claims rose by 25,000 to 377,000, which is still an excellent in comparison with almost any report in the last 4 years except for the week preceding. This is the last report affected significantly by seasonality. The four week average declined by 1500 to 377,500. This is close to the lowest level since mid-2008.

The American Staffing Association Index rose by 3 to 87 last week, the best January reading since 2008, and significantly ahead of last year.

The Daily Treasury Statement showed that withholding for the first 17 days of January 2012 was $138.6 B vs. $132.7 B a year ago. Adjusting +0.27% due to the 2011 tax compromise, for the last 20 reporting days, $162.0 B was collected vs. $156.9 B a year ago, a gain of +3.3%.

Housing data was mixed:

The Mortgage Bankers' Association reported that seasonally adjusted purchase mortgage applications decreased 6.5% YoY and was also down -9.7% from one week ago. The overall trend remains flat since June 2010. Refinancing fell -5.2% in the last week.

For the seventh week in a row, YoY weekly median asking house prices from 54 metropolitan areas at Housing Tracker were positive, up +3.7% YoY. This is the best reading in close to 5 years. The number of metropolitan areas with YoY positive sking prices increased to 31. The number with YoY declines of greater than 5% decreased to 7.

Sales and transportation continued positive:

Retail same store sales were relaitvely weak. The ICSC reported that same store sales for the week ending January 21 increased 2.8% YoY, but were down -1.4% week over week. Shoppertrak, did not report, however, Johnson Redbook reported a weak 2.5% YoY gain, the weakest in 6 months.

The American Association of Railroads reported an increase in weekly rail traffic for the week ending January 21, 2012, with U.S. railroads originating 287,734 carloads, up 1.6 percent compared with the same week last year. Intermodal volume for the week totaled 219,706 trailers and containers, up 3 percent compared with the same week last year.

Money supply and Credit spreads were also positive:

M1 increased +0.4% last week, and +2.3% month over month. It is also up 18.9% YoY, so Real M1 is up 15.9%. This is about 5% off peak YoY gain at the end of last summer. M2 was up +0.2% week over week, and up +1.4% month over month, and up 10.1% YoY, so Real M2 was up 7.1%. This is about 3% less than its YoY reading at the crest of the tsunami.

Weekly BAA commercial bond rates declined .01% to 5.20%. Yields on 10 year treasury bonds rose .01% 1.96%. Falling spreads on lower rates is the best signal of improvement, although it is only for two weeks. This spread had a 52 week maximum difference in October and has been tightening slightly in the last few weeks.

Gasoline usage in particular continues to be much lower YoY:

Oil rose slightly to close at $99.56 a barrel on Thursday. This is about at the recession-trigger level calculated by analyst Steve Kopits (adjusted for general inflation). Gas at the pump was flat at $3.39. Measured this way, we are just at or slightly above the 2008 recession trigger level. Gasoline usage, at 8098 M gallons vs. 8632 M a year ago, was off -6.2%. The 4 week moving average is off -6.4%. Since last March the YoY comparisons have been almost uniformly negative, and substantially so since July. It's at least possible some of this reflects the unusually warm winter most of the country has been experiencing.

Now let's turn to new high frequency indicators designed to track the global slowdown/recession:

The TED spread is at 0.500 down from 0.520 week over week. This index is slightly above its 2010 peak, but has declined from its 3 year peak of 4 weeks ago. The one month LIBOR is at 0.270, down .007 from one week ago, below its 12 month peak of three weeks ago, and also remains below its 2010 peak.

The Baltic Dry Index at 726 continued to plummet -136 as it has for the last 4 weeks and further continues to decline from its October 52 week high of 2173. The Harpex Shipping Index was declining for a full year, but at 394 is above its 52 week low of 389 three weeks ago. It declined -2 last week. Please note that these two indexes are influenced by supply as well as demand, and have generally been in a secular decline due to oversupply of ships for over half a decade. The Harpex index concentrates on container ships, and has been leading at recent tops and lagging at troughs. The BDI concentrates on bulk shipments such as coal and grain, and has been more lagging at the top but has turned up first at the 2009 trough.

Finally, the unweighted Shadow Weekly Leading Index was slightly negative this week. Next day, so was the ECRI WLI. Once again I not surprised.

Global worries have continued to abate. In the US virtually all the news is positive, but some weakly so, and mortgage applications contnue to bounce up and down along their two year bottom. There remains no sign of any present or imminent downturn in the economy right now.

Have a good weekend.