Thursday, September 23, 2010

Yesterday's Market


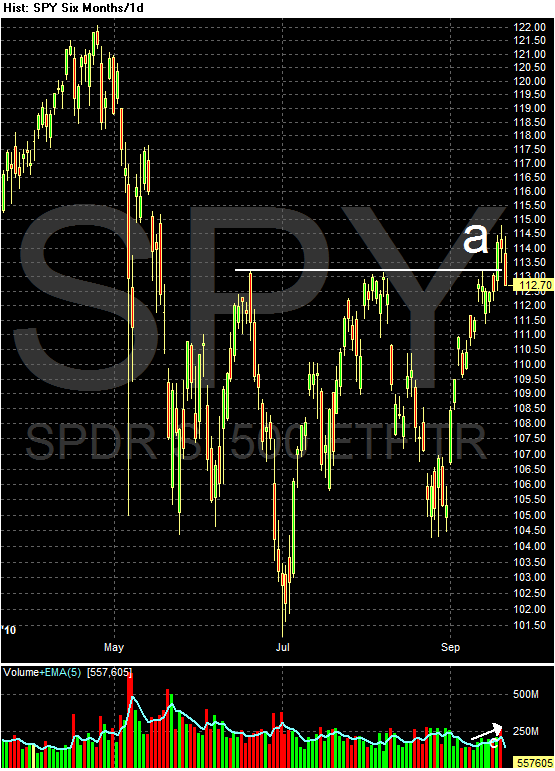
While prices moved over key resistance at the beginning of the week, they have since retreated. Ideally, we'd like to see prices move above this and then "retest it," which means prices fall back to the line but don't do through. Yesterday, prices printed a strong downward bar.


On the 5-minute chart, notice that prices are at important technical levels: key levels set 5 days ago and Fibonacci levels.


Yesterday's action was pretty straightforward; prices moved in a downward sloping pennant pattern in the AM and the consolidated in a tight range during the afternoon.

On the other side of the street, Treasuries are again getting attention. The 7-10-year part of the market is moving higher and is about to test the upward sloping trend line of the last 5 months.


Prices at the long end of the curve are back above important levels.

For the last 4-5 months, the primary issues has been, "is the Treasury market taking money from the equity markets and is this preventing upward progress in the equities markets?" I believe the answer to both is, "yes." As such, the recent moves in the Treasury market do not bode well for the stock market, instead indicating prices are headed lower into the trading range they've been in for the last few months.


Gold is now meaningfully past previous resistance in area (a). This means gold is probably moving higher in a strong way.


Oil is still in a trading range (A). Prices have recently rallied to the 50 day EMA (B), but have since sold off (C). The EMA picture is slightly bearish: the shorter EMAs are heading lower and are below the 50 day EMA, and prices are below all the EMAs. However, the EMAs are also in a fairly tight range and prices have been in a trading range for almost four months.


Copper recently formed an upward sloping wedge pattern (A), which prices broke through two days ago (B). The EMA picture is very bullish (A), but the MACD is a more neutral than we'd like for a strong upward rally.

Wednesday, September 22, 2010

The Fed's Statement

From the FOMC:

Information received since the Federal Open Market Committee met in August indicates that the pace of recovery in output and employment has slowed in recent months. Household spending is increasing gradually, but remains constrained by high unemployment, modest income growth, lower housing wealth, and tight credit. Business spending on equipment and software is rising, though less rapidly than earlier in the year, while investment in nonresidential structures continues to be weak. Employers remain reluctant to add to payrolls. Housing starts are at a depressed level. Bank lending has continued to contract, but at a reduced rate in recent months. The Committee anticipates a gradual return to higher levels of resource utilization in a context of price stability, although the pace of economic recovery is likely to be modest in the near term.


Obvioulsly PCEs are important to the Fed; here's a chart:


Constraining this are the following:


The highest unemployment rate since the early 1980s


Weak wage growth (compare the slope after the recession to that before the recession).


Declining home prices.


Businesses are investing in equipment and software,


but they are reluctant to hire.


Housing starts are weak.

Short version; things are moving forward, but slowly.

Junk Defaults Drop

From the WSJ:

Corporate debt-default rates are expected to fall to the same levels that preceded the financial crisis of September 2008, marking a swift turnaround for the fate of the most troubled U.S. companies.

The U.S. default rate should fall below 3% by year's end, according to Moody's Investors Service, a stunning drop from the 14.6% peak of November 2009 and even below the default rate of 3.1% from August 2008.

The default rate measures the percentage of companies with "junk" credit ratings that failed to meet debt obligations during a trailing 12-month period. The rate's decline suggests the corporate bloodletting set off by the collapse of Lehman Brothers Holdings Inc. is at or near its end. That should bode well for the nation's unemployment rolls, which swelled after the collapse of such companies as Circuit City Stores Inc., Linens N' Things Inc., and Nortel Networks Corp. in 2008 and 2009.

"In the near term, we seem to have overcome the last wave of restructurings—faster than anticipated," said Michael Henkin, co-head of restructuring at Jefferies & Co. "Things came back pretty quickly, and the capital markets have solved a lot of the concerns that were out there on corporate defaults."

More signs the economy is on the mend.

Housing may have bottomed - but no rebound

- by New Deal democrat

Along with Oil, because it is a leading sector housing is the area of the economy I am most concerned about in terms of sustaining the recovery. As to sales, on the one hand there is now substantial evidence that it has bottomed, but on the other hand there is little evidence of a significant rebound.

Here is a graph of housing permits (a Leading Indicator) and starts as of yesterday:


Permits did rise slightly (10,000) and starts rose significantly, but both are below 600,000 seasonally adjusted units annually. They had been above 600,000 in the early part of this year.

Meanwhile, this morning the Mortgage Bankers Association reported that purchase mortgage applications declined 3.3%. This was still 9% above the low of two months ago, but almost 40% below one year ago.

In short, there is only a slight rebound off the bottom. The cliff-diving of 2006 - 2008 is over, but we have given up between 50,000 to 100,000 units annualized from the pace that was established one year ago. This is an important reason why I expect GDP growth in the next quarter or two to be sluggish, and possibly even slightly negative in one quarter.

Is the Federal Reserve Propping Up the Economy?

There are times when the internets promise is greatly undermined by its propensity to spread conspiracy theories, one of which is "the Federal Reserve is propping up the economy." Let me explain why this is false.

1.) Yes, the Fed is purchasing trillions of dollars of Federal debt. And, yes, this is probably a primary reason for lower interest rates. And, yes, this has led to an increase in the monetary base, or:

In economics, the monetary base (also base money, money base, high-powered money, reserve money, or, in the UK, narrow money) is a term relating to (but not being equivalent to) the money supply (or money stock), the amount of money in the economy. The monetary base is highly liquid money that consists of coins, paper money (both as bank vault cash and as currency circulating in the public), and commercial banks' reserves with the central bank
Here is a chart of the monetary base:


This is the chart that everybody is saying proves the Federal Reserve is "propping up the economy." But the problem is the above chart includes reserves -- which may or may not have been loaned out. If they were loaned out -- that is, if they got into the hands of the public -- then we would have a serious problem

2.) However, this theory does not take into account the other half of the monetary equation: making loans to get the excess reserves into the economy. After the Fed increases the accounts of various commercial banks on the Fed's balance sheet, the commercial banks have to make loans to place the money into the hands of the public. This is where the theory falls apart. Here is a chart of total loans and leases in the economy:


Total loans are decreasing. This has led to

3.)
A very low rate of growth in MZM -- money with zero maturity, or

"Money with zero maturity. It measures the supply of financial assets redeemable at par on demand."


In addition, consider these two charts:


The year over year rate of growth of MZM was negative for the last few months, and


It's velocity is the slowest its been in over nearly 50 years.

In short, the Fed is not "propping up the economy." While the Fed is purchasing large amounts of bonds, those purchases are not getting into the public's hands because banks aren't lending money. In fact, the growth of the MZM was recently negative and its velocity is near 50 years lows.

Yesterday's Market


Prices are above important technical levels still (a). In addition, the EMA picture is strong (b)-- the shorter EMAs are above the longer EMAs and the 10, 20 and 50 day EMA are rising. Prices are above the 200 day EMA. Also note that volume has been increasing for the last week or so (c).


The underlying technicals are strong - the A/D line is rising (a) and the CMF shows a net inflow of cash (b). Also note momentum is positive (c).


Last week, prices consolidated (a). Yesterday they rose (b) and today the held steady (c).


On the down side, bonds rallied strongly yesterday (a) on the Fed's decision. This will take some money out of equities.


In addition, bonds are in a clear upwardly sloping position (a). Today prices gapped higher at the open (b) and then rallied strongly after the Fed's decision (c).

Corn's rate of increase in getting steeper -- note the progressively steepening angles (A, B and C). The EMA picture is strong (D, all rising) and the MACD indicates upward momentum (E).

Cotton is also in a clear uptrend (A), accompanied with strong upside gaps (B) and a positive EMA picture (C). Also note the MACD has popped higher (D).


After moving strongly higher (A), wheat is consolidating in two triangles (B and C).

Tuesday, September 21, 2010

Other Bond Markets Are Also Rallying


The above charts of the municipal bond market, mortgage, junk and investment grade corporate bond markets all indicate money is flowing into the dent markets; it's not just the Treasury market that is benefiting from the recent move into fixed income.

The question now becomes are these markets in the middle of a bubble? The MUBs are right at crucial support and the MBBs are just below support, indicating some technical weakness. the LQDs have sold off a bit, but still have some technical support.

Education and Employment

From the OECD:

It can't be more straightforward: the more educated you are, the more likely you are to have a job. In every OECD country, without a single exception, a higher proportion of 25 to 64–year-olds with a tertiary level of education are employed than those with only an upper secondary degree. And likewise, those with an upper secondary qualification are generally far more likely to have a job than those with a level of education below that.
Across the OECD, some 85% of 25 to 64-year-olds with a tertiary education have a job, compared to an average of 59% of those with a secondary education or less. And the gap grows considerably wider for some countries (see our chart). With notable exceptions of Iceland and Korea, very few countries have managed to shrink this gap down.

It works for gender as well. Higher levels of education also bring the employment rates of women up to that of men. Men are generally more likely to be employed than women, but the discrepancy is much bigger among people with low levels of education.


While there is no such thing as a guarantee, this is a strong statistical relationship that exists over different countries.

NBER confirms Bonddad and I were right

- by New Deal democrat

In December 2008, with the economy in freefall and nearly one million workers losing their jobs each month, I asked Is there Hope for an Obama Economic Recovery in 2009?. After noting that " This is an economy in free-fall" and that "a Deflationary Bust -- the first since 1938 -- is in full force, " I wrote that
Left to its own devices, I suspect the economy would succumb to a deflationary spiral. But Ben Bernanke and the Federal Reserve know this as well: Bernanke is a scholar of Federal Reserve mistakes during the 1929-32 Great Depression. He is resolved not to make the same mistakes that were made then .... He is aiming a veritable monetary firehose at the deflationary vortex, hoping to flood it with money and so overcome the incipient deflation.
....
There is at least some hope [that] ....a new Administration in Washington populated by Economic Adults may unfreeze the logjam of money supply sitting in banks and not being lent out. Certainly there is a pressing need for massive infrastructure investments that can lead to renewed bank lending and economic expansion on Main Street.

Yes there is Hope for an Obama Economic Recovery in 2009.
Because the 2007-2009 economic downturn had much in common with the Great Depression, and because despite that fact, very few statistical series cover that period of time, in January 2009 in a series of 5 posts, I examined "Economic Indicators during the Roaring Twenties and Great Depression" in detail. Noting that the Great Depression as well as the 1938 recession, and other recessions during the 1920s had bottomed when the rate of YoY change in prices bottomed, I concluded:
the indicators we have studied from the earlier Deflationary period suggest that the recession might bottom out in about Q3
By April, it was reasonably clear that a wage deflationary spiral was not going to happen, and that gave me confidence enough to write:
For purposes of this discussion, I am going to assume that the optimistic scenario turns out to be the correct one: viz., that the YoY inflation rate will bottom in about July 2009 and that will mark the end of the recession and the beginning point of any recovery.
By early May 2009 we had had both a bottom in retail sales, stabilization in the housing market, and the signs of significant decline in both initial jobless claims and monthly payroll losses. On May 07, I wrote:
This week's decline increases the likelihood that the recession is very close to bottoming to more than 50%.

The continuing weekly decline in weekly jobless claims is not the only indication that the recession may be close to bottoming out.... Last Friday the ISM Manufacturing Index for April was released. It was all but ignored in the economic blogosphere.... In summary, the NAPM Manufacturing index's reading for April is consistent with the recession bottoming out, and a recovery beginning almost immediately.....

.... the NBER may ultimately date the end of this recession from June or July of this year.
Four days later, referring primarily to the Leading Economic Indicators, which were almost all showing signs of turning upward, Bonddad and I jointly wrote
there are plenty of reasons, those listed above not being in any way exhaustive, that people like us are saying that the economic situation looks like it is getting ready to improve.
By the end of August we were both confident, and correct, enough to write bluntly that This Recession is Over.

While we were writing the above, we came under criticism from Doomers who claimed, in July 2009 that it was The End of the End of the Recession touting that
If you're like the rest of us, and you can handle the truth about our economy, here's a quick summary:
....-"...the economy is leaps and bounds away from anything remotely resembling a recovery."
while another in the same month of July derisively claimed that Green Shoots are turning into Brown Weeds:
"Some Green Shoots supporters have declared that the bottom is in. They point towards various short-term trends, and if you don't look too close, it appears to support their cause.... If you look hard enough you can find Green Shoots, but do they actually exist in the real world? Sadly, no..
As late as this July, latching onto a column written by Calculated Risk about the NBER's recession dating (which I also criticized, also correctly as it turned out), one of them claimed:
if another recession starts this year, it will almost certainly be dated as a continuation of the "great recession" that started in 2007. If so, I'll need more blue ink to shade all my graphs ...
IMHO, more likely than not, these are the realities of our economy heading into the last four months of the 2010 election cycle.

In short, there can't be a double-dip recession if the Great Recession never ended, in the first place.
Yesterday the NBER settled that debate. They confirmed that the Pied Pipers of Doom were wrong. At the very time they were writing the above bombasts, the economy had begun to recover.

More importantly, Bonddad and I were right in calling the bottom of the Great Recession -- not just contemporaneously, but months in advance.

Yesterday's Market

Yesterday may be a very important technical day in the market. First, let's look at the minute by minute action:


Prices gapped higher at the open (a), wuickly consolidated in a downward sloping pennant pattern (b) and then rallied strongly (c) before again consolidating. Prices next formed a double top (e) before selling off to just below the 20 minute EMA (f). Prices then consolidated their gains in a triangle pattern (g) and then rallied strongly into the close on rising volume (h).

Let's look at the rest of the equity averages:


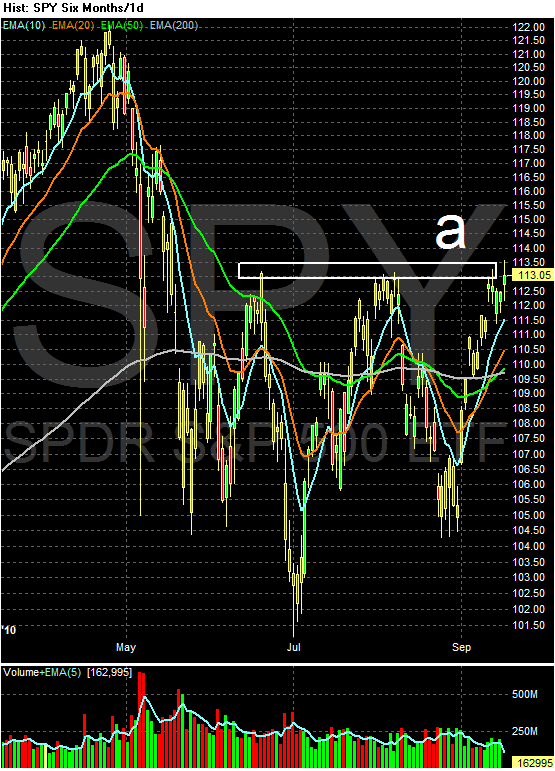
The SPYs finally made some headway above hey resistance levels (a).


The NASDAQ continued its advance above key resistance (a)


The Russell 2000 made a strong gains yesterday as did


The IWCs, which also advanced through important resistance levels.

However,


The Treasury market rallied as well, moving above the upper line of its downward sloping pennant pattern. Prices are constricted by the EMAs, however.


Gold continues its move above key resistance.


After bottoming (a), the dollar rallied but ran into upside resistance at the 50 day EMA (b). Prices then started to move lower, forming two upward sloping pennant patterns along the way down (c and d). Prices have now consolidated in a triangle pattern, just a bit higher than previous lows (e).

Monday, September 20, 2010

Recession Ended in June 2009

From the NBER:

The Business Cycle Dating Committee of the National Bureau of Economic Research met yesterday by conference call. At its meeting, the committee determined that a trough in business activity occurred in the U.S. economy in June 2009. The trough marks the end of the recession that began in December 2007 and the beginning of an expansion. The recession lasted 18 months, which makes it the longest of any recession since World War II. Previously the longest postwar recessions were those of 1973-75 and 1981-82, both of which lasted 16 months.

In determining that a trough occurred in June 2009, the committee did not conclude that economic conditions since that month have been favorable or that the economy has returned to operating at normal capacity. Rather, the committee determined only that the recession ended and a recovery began in that month. A recession is a period of falling economic activity spread across the economy, lasting more than a few months, normally visible in real GDP, real income, employment, industrial production, and wholesale-retail sales. The trough marks the end of the declining phase and the start of the rising phase of the business cycle. Economic activity is typically below normal in the early stages of an expansion, and it sometimes remains so well into the expansion.

A Closer Look At PPI

Last Week we had two important data series on inflation: CPI and PPI. Let's start with a closer look of PPI:

First, PPI is broken down into three different measures: crude, intermediate and finished goods. Here is a definition of all three:

Crude materials for further processing are products entering the market for the first time that have not been manufactured or fabricated and that are not sold directly to consumers.

.....

The stage-of-processing category for intermediate materials, supplies, and components consists partly of commodities that have been processed but require further processing. Examples of such semifinished goods include flour, cotton yarn, steel mill products, and lumber.

.....

Within the stage-of-processing system, finished goods are commodities that will not undergo further processing and are ready for sale to the final-demand user, either an individual consumer or business firm.

Let's start with crude goods:

The Producer Price Index for Crude Materials for Further Processing moved up 2.3 percent in August. For the 3 months ending in August, crude materials prices rose 2.5 percent after falling 1.7 percent from February to May. In August, more than half of the monthly increase can be attributed to the index for crude foodstuffs and feedstuffs, which moved up 3.5 percent. Also contributing to this broad-based advance, prices for crude nonfood materials less energy and crude energy materials rose 4.1 percent and 0.5 percent, respectively.

Here is a chart of the data:


Click for a larger image.

Notice that several periods of negative month over month numbers are possible with this data series. The reason is the above data is heavily influenced by commodity prices, which can be extremely volatile. We've seen two months of increases, which is a good development as it lessens the possible problems from deflation.

Let's move on to intermediate goods:

The Producer Price Index for Intermediate Materials, Supplies, and Components increased 0.3 percent in August following decreases in July and June. Accounting for about eighty-five percent of this broad-based advance, prices for intermediate energy goods rose 1.3 percent. The indexes for both intermediate materials less foods and energy and for intermediate foods and feeds also contributed to this increase, moving up 0.1 percent and 0.9 percent, respectively. On a 12-month basis, prices for intermediate goods climbed 5.0 percent in August, continuing their deceleration from an 8.7-percent peak in April 2010.
Here is a chart of the data:


Again -- and like crude products -- notice that intermediate prices can have some pretty serious swings, largely as the result of commodity price swings. However, last month prices increased. While one month obviously does not equal a trend, it is good in that id also helps to blunt deflationary fears.

Also remember that crude and intermediate price increases are typically absorbed to some extent by businesses.

Finally, we have finished goods:

The August advance in the finished goods index can be traced primarily to prices for finished energy goods, which rose 2.2 percent. The index for finished goods less foods and energy edged up 0.1 percent. By contrast, prices for finished consumer foods fell 0.3 percent in August.


Here's a chart of the data:


Like the other two data series, this one can and does print negative numbers from time to time, so drops should not be seen as atypical events. Also note that we've seen two increases in a row, which is a healthy development in the current environment, as it decreases the deflationary argument.

It looks as though PPI will continue increasing; from today's FT:

Cotton prices soared past $1 a pound as demand looked set to outpace supply for the fifth consecutive season in 2010-11 after flooding devastated the crop in Pakistan, the world’s fourth-largest grower.

The rally led a broad surge in agricultural and soft commodities amid weather concerns. Sugar traded above the key 25 cents a pound barrier, a seven-month high, while wheat and corn surged to a two-year high and soyabeans hit a 15-month peak.
Ditto what Barry Ritholtz says

- by New Deal democrat

This was posted by Barry Ritholtz at The Big Picture this morning. I agree with every word of it:

There are those folks who have an approach based on a defendable methodology. There approach to evaluating markets or the economy could be based on fundamentals, it might be derived from quantitative metrics, it could be valuation, balance sheet, macro, momentum, GARP, trend following, technicals, long/short, psychology, sentiment, contrarian analysis.

Call it plug & chug: It doesn’t really matter what the methodology is, so long as it begins with some objective input, runs through a process of sorts, and determines an output.

There are folks in this camp who I am happy to occasionally disagree with. They force me to sharpen my own analysis, be more specific, consider alternatives....

Anyone who has an objective approach to evaluating the ever changing mix of inputs to the markets or economy or stocks. These folks are often intellectually curious, have flexible minds, and a high degree of integrity. Whether I agree with their conclusions or not, I respect their process.

Then there is that other group. They are all conclusion, zero input. Process is irrelevant to them, Outcome is all.

They work backwards. They start with a conclusion, and sift through all the data to justify that conclusion. They do not change their minds. They do not care about facts or data or input. They never admit mistakes. “Truth,” as we have discussed in the past, is an irrelevant inconvenience.

They are ideological jihadists.
If you want to get to the heart of what sets me off, this is it. Mix in ideological jihadism in with a heavy dose of insults directed at those who disagree with them, and you have a particularly dishonest and toxic brew. There are several popular writers at the place that Bonddad and I came from who fit this mold exactly. I have kept book on them and their errors have been legion. It boils down to starting with an ideological worldview and then finding whatever data set fits. When the data set turns against their ideology, it no longer exists.

As it happens, over the weekend I drafted a few posts describing several such data sets, that were biblical truth when they suited a pre-conceived conclusion, and disappeared into the ether when they didn't. I know some readers do not like it when we call out "Doomers" who fit this mold, but really, just as in the case of Mish, you should take certain writers with entire shakers of salt once you realize that they fit Barry Ritholtz's description.

Yesterday's Market

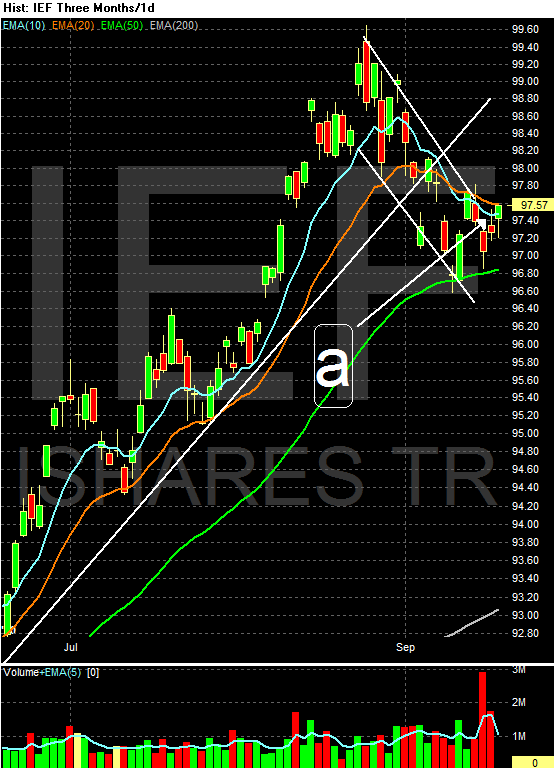
Let's start with the Treasury market. Over the last few months, Treasuries have benefited from a flight to safety as investors have grown more concerned about the situation in Europe and the US economy.


Both the IEFs and the TLTs have broken their uptrends (a) in a disciplined, downward sloping pennant pattern (b) Neither has had a massive downward shift; instead, the sell-off has been gradual and disciplined. However,


The technicals of both charts are very interesting. Both are still seeing a net inflow of cash according to the A/D and CMF indicators. Obviously, both are seeing a decrease in momentum. However, until the A/C and CMF lines confirm the outflow of cash, it's hard to say this is a reversal of sentiment.


Last week, stocks traded in an extremely narrow range as


they continued to run into upside resistance. However,


The NASDAQ has broken through key levels, but


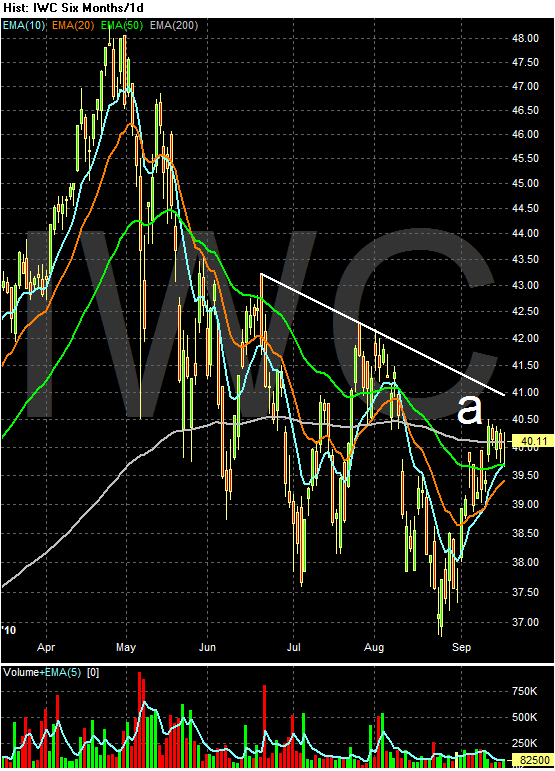
The risk trade -- the IWCs -- are still in a downward sloping trajectory, indicating that equity investors aren't yet willing to make a big move into the riskier side of the market.


Finally, gold make a strong move about previous resistance by printing a strong bar. This has been desperately needed for this rally.