Way back in 2004 (if not earlier), Ben Jones' Housing Bubble Blog started, dedicated to the proposition that there was a housing bubble that would eventually burst, with very bad consequences. Although the peak of the bubble did not occur until the beginning of 2006, the signs were there to see for the discerning.
The other day, with the release of the most recent Case-Shiller housing indexes, I decided to take a look at what the "real", inflation-adjusted cost of housing was in the cities surveyed. Some of the results were stunning. Prices in about half of the 20 cities surveyed are at the lowest they have been, in "real" terms, in nearly a quarter century -- and that's before taking into account mortgage interest rates.
Below are the results in graphic form. Since housing itself is a component of inflation, rather than use the CPI, I have compared housing prices with the growth of average hourly earnings in private industry since 1987 (blue line in each of the graphs below).
This compares average hourly earnings with the overall 10-city Case Shiller housing index:
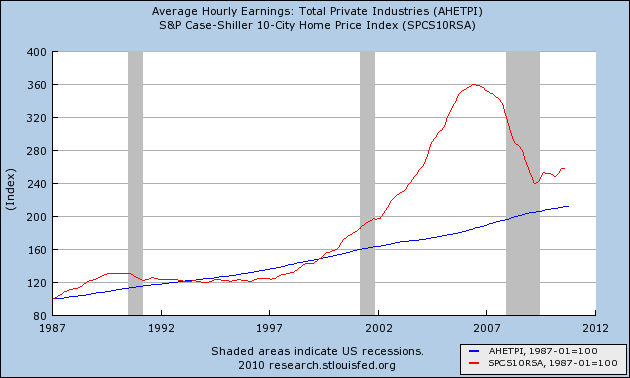
As you can easily see, in the aggregate housing prices are still a good 20% above their long term average, suggesting that prices as a nationwide average have a substantial way to fall. Based on that, upon release of the most recent Case Shiller data a few days ago, Standard and Poors opined that they expect house prices to fall another 7 to 10% through the end of 2011.
On a national scale, that is probably close to the mark. But look what happens when we start looking at different cities.
Here are three cities at the epicenter of the housing bubble: Tampa, Miami, and Phoenix:
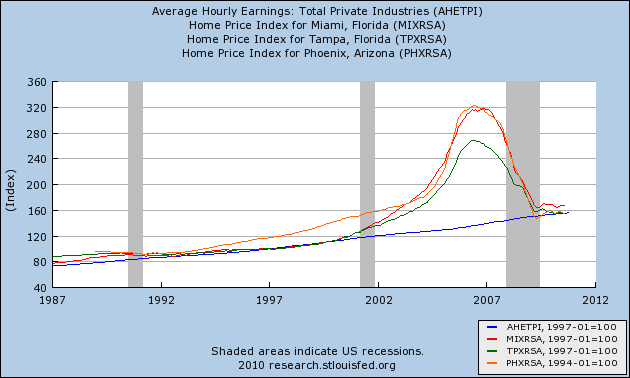
These three cases all had smaller housing booms in the late 1980s that did not bottom out until the mid-1990s. Housing prices in each locale now are as low as they were at that mid-1990s nadir in real terms.
Here are three more cities -- Las Vegas, Charlotte, and Cleveland -- that did not have mini-busts in the 1990s, but in the case of Las Vegas, was another epicenter of the housing bubble:
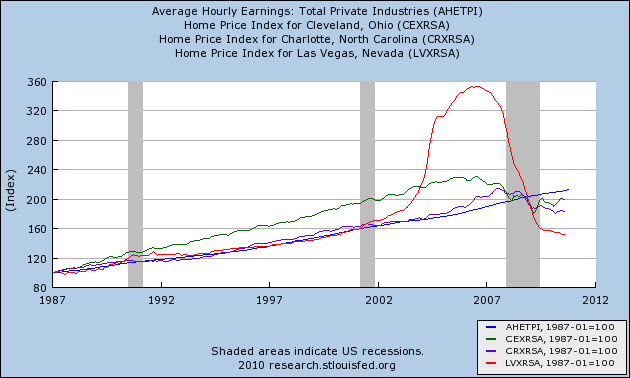
In all three of these cases, prices are actually lower now in real terms than they were 23 years ago or at any time since.
Atlanta, Minneapolis, and Detroit likewise have the lower prices now than at any time since this series started:
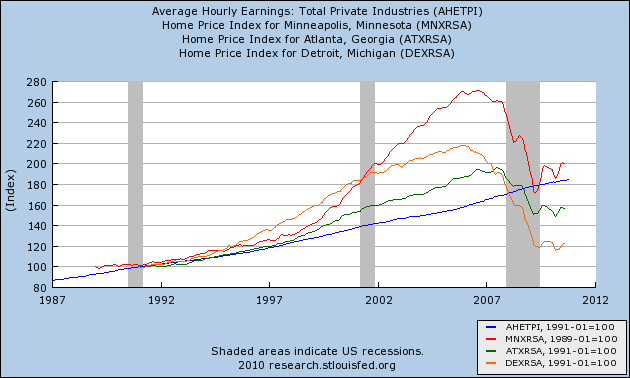
Detroit, of course, more than any other large city, has suffered from de-industrialization.
So, where are prices still elevated?
It is good to be the seat of the financial or political Empire, respectively. Here are New York City and Washington, DC:
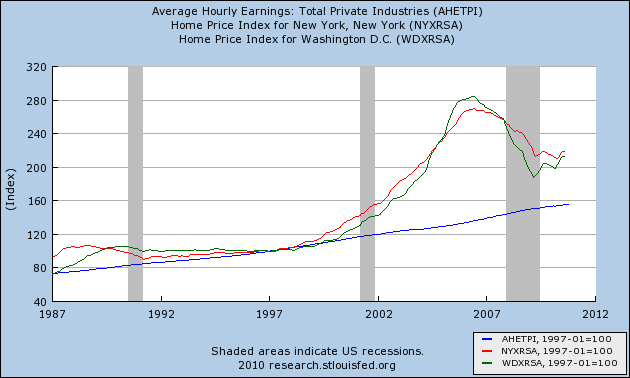
No regression to the mean in either of those two cities. Nor is there any along the West Coast:
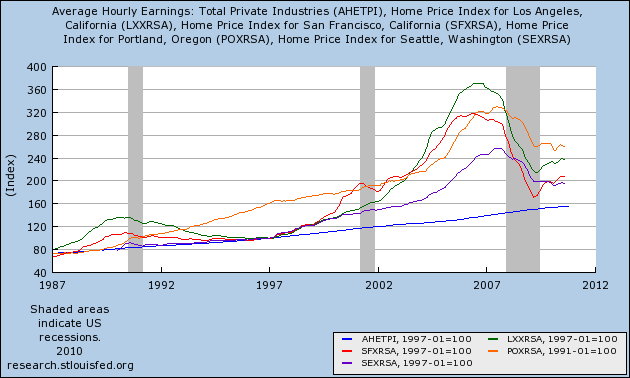
Los Angeles, San Francisco, Portland, and Seattle still show highly elevated "real" prices. Although I haven't graphed it, so does San Diego which is also part of the Case Shiller sample.
In short, fully half of the cities examined in the Case Shiller index have house prices now that are equal to or lower than any other prices in real terms in the last 20+ years. The bubble has fully burst in those cities.
The low absolute home prices are only amplified by mortgage rates, which were about 11% in 1987, 7% or so in the mid-1990s, but only a little above 4% now.
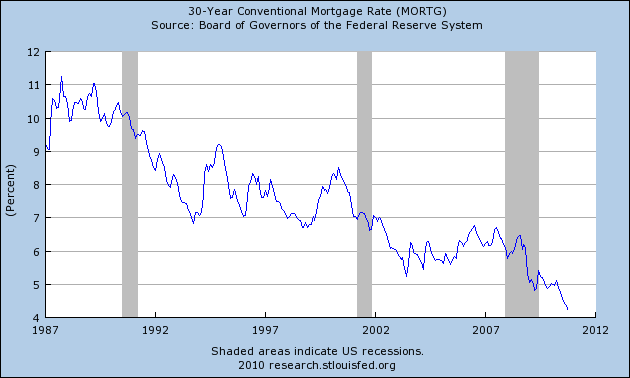
So the monthly mortgage payment now is only about 40% of what it would have been in real terms back in 1987.
Of course, the fact that housing prices in the above referenced 9 locales are at quarter-century lows does not mean that they won't go lower. Some of them have been low for several years, and yet continued to decline.
Courtesy of Ben Engebreth's Housing Tracker, here are housing inventories for 5 of the metropolitan areas referenced above.
Here's Tampa:

Here is Phoenix:

Here is Atlanta:

Here is Cleveland:

Finally, here is Washington, D.C.:

In all five of the above metropolitan areas, inventory of houses for sale has declined from peak. But in none of the cases is the inventory back where it was in 2005 when the market in the most bubblicious areas started to turn. It is when this inventory goes back down to its 2005 levels or lower that we can expect a bottom in house prices. My best guess is that the national low for the Housing Bust is still several years away.
On a national scale, that is probably close to the mark. But look what happens when we start looking at different cities.
Here are three cities at the epicenter of the housing bubble: Tampa, Miami, and Phoenix:

These three cases all had smaller housing booms in the late 1980s that did not bottom out until the mid-1990s. Housing prices in each locale now are as low as they were at that mid-1990s nadir in real terms.
Here are three more cities -- Las Vegas, Charlotte, and Cleveland -- that did not have mini-busts in the 1990s, but in the case of Las Vegas, was another epicenter of the housing bubble:

In all three of these cases, prices are actually lower now in real terms than they were 23 years ago or at any time since.
Atlanta, Minneapolis, and Detroit likewise have the lower prices now than at any time since this series started:

Detroit, of course, more than any other large city, has suffered from de-industrialization.
So, where are prices still elevated?
It is good to be the seat of the financial or political Empire, respectively. Here are New York City and Washington, DC:

No regression to the mean in either of those two cities. Nor is there any along the West Coast:

Los Angeles, San Francisco, Portland, and Seattle still show highly elevated "real" prices. Although I haven't graphed it, so does San Diego which is also part of the Case Shiller sample.
In short, fully half of the cities examined in the Case Shiller index have house prices now that are equal to or lower than any other prices in real terms in the last 20+ years. The bubble has fully burst in those cities.
The low absolute home prices are only amplified by mortgage rates, which were about 11% in 1987, 7% or so in the mid-1990s, but only a little above 4% now.

So the monthly mortgage payment now is only about 40% of what it would have been in real terms back in 1987.
Of course, the fact that housing prices in the above referenced 9 locales are at quarter-century lows does not mean that they won't go lower. Some of them have been low for several years, and yet continued to decline.
Courtesy of Ben Engebreth's Housing Tracker, here are housing inventories for 5 of the metropolitan areas referenced above.
Here's Tampa:

Here is Phoenix:

Here is Atlanta:

Here is Cleveland:

Finally, here is Washington, D.C.:

In all five of the above metropolitan areas, inventory of houses for sale has declined from peak. But in none of the cases is the inventory back where it was in 2005 when the market in the most bubblicious areas started to turn. It is when this inventory goes back down to its 2005 levels or lower that we can expect a bottom in house prices. My best guess is that the national low for the Housing Bust is still several years away.
Yet the low real prices and declining inventory in some of the most severely impacted cities argues that we should start to look for a bottom in at least some of those locales within the next 6 to 12 months.