Wednesday, January 22, 2025

The new Administration and the return to an Inflationary Era


 - by New Deal democrat


I don’t normally discuss movements in the stock and bond markets, but occasionally there are important paradigm shifts that can tell us a lot about the economy, and the last few months have been one of those times.

The Federal Reserve began to cut interest rates on September 18th. What is instructive is what has happened with bond yields, and the comparative moves in stock prices, since.

The 10 year Treasury bond (dark blue) made a low of 3.63% on September 16. In the below graph, I norm that value to 0, and similarly norm yields on 2 year (light blue), 1 year (gray), 6 month (gold), and 3 month (red) Treasurys, so that their trends before and after that inflection point are apparent:


Interest rates were generally trending down across the spectrum in the five months before September, as signs of economic weakness, particularly in several summer jobs reports, worried investors that the Fed had kept rates high for too long, and needed to start cutting them to boost the economy. 

But what is interesting is what happened since. While the very short maturities followed the Fed rate cuts lower, from the 1 year maturity out, bond yields *rose.* This tells us that in the aggregate, bond investors believed that either the Fed’s rate cutting regimen would be short lived, and/or that inflation would increase. This is referred to in bond trader circles as a “bearish steepening.” In other words, the bond yield curve un-inverted, but did so mainly because longer term rates rose - meaning that things like mortgage rates would also increase.

Which brings us to the stock market. Below I compare yields on the 10 year Treasury to stock prices as measured by the S&P Index for the past five years:


Sometimes the two move in tandem, and sometimes they move in opposite directions. In the immediate post-pandemic aftermath, yields and prices rose together, consistent with an expanding economy. In 2022, as most investors and analysts became nervous that a recession was near (triggered in no small measure by the inversion of the bond yield curve), prices fell even as yields increased in response to Fed rate hikes. In 2023 and earlier in 2024, as fears abated and the “soft landing” scenario took hold, once again prices and yields moved in the same direction.

Now let me focus on the past ten months:


Except for the brief period between the first rate cut and the Election, where both metrics moved in sync along with economic optimism, prices and yields have moved in opposite directions again. In the period between April and September, that was because there was increasing worry that a “hard” landing was in store. 

But the second period began within two days after the Presidential Election in November. At first stock prices rose on economic optimism, while bond yields fell. But stock prices peaked almost immediately, with even the December highs only being only 1.5% above their level on November 11. And bond prices have moved almost relentlessly higher, including to new 12 month highs this month. This is much less likely about future Fed behavior than about inflationary policies likely to be in store from the new Administration.

Long term trends back up this inflationary concern. Bond yields tend to move in very long cycles, equivalent to more or less one human lifespan (or “saeculum”), suggesting the old adage that as lived history is forgotten, old dangers are renewed.

Here is the history of long term bond yields from 1920 to 1980:


After slowly declining from 1920 to 1940, beginning in the 1950s bond yields increased for 30 years, as inflation slowly, and then more quickly, took root.

Now here is the same graph since 1981:


Bond yields declined for a long period, coinciding with disinflation and then even concerns about outright deflation. That period appears to have abruptly ended with the pandemic. 

All the signs are that we have begun a new inflationary era in which bond yields are likely to continue to generally rise. And all the signs are that the policies of the new Administration are going to contribute to that.

Tuesday, January 21, 2025

The economic reasons why the Democrats lost in 2024


 - by New Deal democrat


There is no significant economic news until Thursday. In the meantime, today and tomorrow let me discuss a couple of issues at the intersection of economics and politics.

The 2024 Presidential election was one of the closest popular vote margin for the winning candidate, at 1.5%, since Richard Nixon’s 0.7% margin in 1968. (Note: I’m leaving aside 2000 and 2016, where the winning candidate actually lost the popular vote). In such a case, the reasons one can assign for the victory of one candidate over another are myriad. My analysis below is of the economic issues. That is by no means saying that issues in other dimensions, such as the situation in the Gaza Strip, or racism or sexism did not play a role, or misinformation and disinformation flooding the zone via various tradition and social media controlled by right wing billionaires.

First, I have read a number of analyses lamenting the rightward shift in the vote by people under 30, and in particular men under 30. For the past year, when I have weighed in on the topic, I have insistently harped on the issue of housing costs.

Young people in their 20s move out of their childhood homes, rent apartments, and usually are saving for or buying their first home. And at no time in the past 40 years was the situation facing such young renters and buyers more unfavorable.

Since the beginning of 2021, house prices rose 37.5% according to the FHFA. Meanwhile mortgage rates rose from 3% to 7%. Here is what those prices and mortgage payments look like graphically:


Not only did potential buyers have to come up with a 35% bigger down payment, but their monthly mortgage payment on average rose from about $1000 to $2300.

As a result, the index of Housing Affordability fell to lows it had not seen since the early 1980s:


Needless to say, these prices rose much more than median family income:


Renters did not escape unscathed either. Measured from January 2021, average rents increased about 3% more than wages:


Had I measured from the expiration of COVID rent increase moratoriums, the shortfall would be more than 6%.

Given the sharp deterioration in their housing prospects, is it any wonder that more young people might have turned away from the party in power?

Secondly and more broadly, a trope on progressive sites has been that in addition to an excellent job market, wages did in fact go up faster than inflation. But that’s not nearly as dispositive as those writers thought it was. 

To begin with, I suspect there was an important behavioral econ aspect to why so many people felt that the economy was doing poorly during Biden’s term.  I don’t have graphs, but consider the following two scenarios:

1. Over 4 years, prices rise 8% (2% per year), while wages rise 10%
2. Over 4 years, prices rise 28% (7% per year), while wages rise 30%.

In both cases real wages have risen 2%.

I have little doubt that a majority of people would feel that their well being is much worse under scenario #2 than scenario #1.  Because in scenario #1, their perception would probably be that their wages increased, while prices remained basically stable. But in scenario #2 their perception would be that inflation was very bad, and their wages barely kept up.

But even that doesn’t completely explain the poor feeling many people had about their economic situation. Because wage increases aren’t uniform. Obviously some people make out better than average, and others worse than average.

A good way to show that is via the Atlanta Fed’s wage tracker, which contrasts wage increases obtained by job stayers vs. job switchers. Here’s what that looks like over the past 25 years:


The divergence between the wages earned by job switchers vs. stayers was at its all time high in 2022-23. Job stayers made out much better that inflation in real terms, while job stayers did not keep up. Cumulatively through December 2024, during Biden’s term the wages of job stayers rose on average 20.2%, while CPI rose 21.0%. And remember, many of those job stayers made out worse than that average.

Another way to look at this is to compare real average wages vs. the employment cost index for wages. The big difference between the two is that the latter norms for the type of job. In other words, if there was a switch from being employed in food and drink services to construction during the time period, that change in job mix would show up in average wages. But the employment cost index would compare food and drink servers at the beginning and end of the peiod, and contruction workers at the beginning and end of the period.

Here’s what those two measures look like for Biden’s term:


Real average nonsupervisory wages were up close to 1% at the end of last year vs. the beginning of 2021, while wages normed by the type of industry were *down* by almost 2%. And job stayers are all in that second category.

To reiterate, I am not saying that economics was the sole, or necessarily even the primary reason why the Democrats lost the Presidential election. But there were solid economic reasons why a substantial share of potential voters might decide to vote against the incumbent party.

Monday, January 20, 2025

Joe Biden: the last Institutionalist president


 - by New Deal democrat


Over 5 years ago, I took a look at the 500 year history of the Roman Republic. In my penultimate discussion of its downfall, I wrote:


“By 78 BC the Republic was dead on its feet. Virtually all of its norms of office-holding had been swept away. Political mobs using violence to get their way had become chronic. Even worse from a long-term point of view, prominent politicians of wealth were raising private armies that they themselves paid, and whose loyalty was to them rather than to the Republic, culminating in 3 separate military marches on Rome in short-lived dictatorships.”

The title of this post is not because there will not be future Institutionalist politicians, but because by four years from now I believe those Institutions will similarly be “dead on their feet,” understood to be hollowed out forms that have proven themselves unable to withstand raw power grabs. While Biden had a number of impressive policy triumphs, I believe it is his ultimate complacency about American “norms” that will be his legacy.

Last week Qasim Rashid wrote:
“Here’s a harsh truth. [Biden] ran in 2020 on the promises to ‘save the soul of America’ and to ‘protect American democracy. …. Now as he leaves office, white supremacy and Christian nationalism ar the official policies of a fascist returning to the White House with full control of the House, Senate, and SCOTUS. The harsh truth is Biden failed his promises.”

Let’s leave aside the outline of Trump’s policies, and any assignment of fault to Joe Biden. The simple *fact* is that the ultimate *outcome* of Biden’s Presidency has been that the American “soul” has not been saved, and “American democracy” has not been protected.

At the beginning of his term in office, Joe Biden had a choice: he could either emphasize playing hardball going after the myriad transgressions of Donald Trump and his allies during his Presidency, or he could emphasize restoring the prior norms and “guardrails” that historically allowed the American Republic to function. He chose the latter. 

That choice was epitomized by the choice of Merrick Garland as Attorney General. In his farewell speech last week, Garland said “It is the obligation of each of us to follow our norms, not only when it is easy, but also when it is hard, especially when it is hard …. and especially when the circumstances we face are not normal.” Voting rights attorney Marc Elias said of that speech, “From start to finish, he brought norms to a Trump fight and democracy suffered.”

The next four years are likely to demolish what is left of the “guardrails” upholding the Republic. The next liberal President, presuming there is one, will almost certainly not make that same choice.

As I wrote above, Biden had a number of impressive policy achievements, including the emergency stimulus in 2021 and the Inflation Reduction Act that has been responsible for so much infrastructure spending. Among other things, antitrust law was re-invigorated, skyrocketing prescription costs were brought to heel, “junk fees” were outlawed, labor rights were expanded, renewable energy sources were promoted, marijuana regulations were loosened, many steps were taken to ease student debt, and industrial re-shoring was robustly undertaken. Child poverty was temporarily cut in half during the life of the 2021 economic stimulus. And he ended the war in Afghanistan. And all of this was done with razor thin House and Senate majorities.

But if he may have accomplished more socially progressive goals than any other President in the past 50 years, including Barack Obama, how many Americans - and more specifically how many voters - knew of those accomplishments in November 2024?

Eight years ago, assaying his Presidency, I wrote that Barack Obama was “a noble failure,” because even though he had several important domestic policy achievements - domestically the 2009 emergency stimulus package, the ACA, and his “evolution” on gay marriage, and in foreign policy the agreement with Iran to stop working towards a nuclear bomb, and generally improving the attitude of our allies towards the US - he had failed to sell those accomplishments to the American public, and there was every indication that Trump intended to dismantle them all. Successful Presidents, I argued, did not suffer immediate reversals of all their policy achievements, especially when much of that reversal was their failure to make their own case.

As I read that piece, I realized that much the same critique could be made of Joe Biden’s Presidency. Because just as with Barack Obama, Joe Biden failed to sell his accomplishments to the American public.

Emblematic of that failure is the contrast between Trump’s COVID stimulus payments in 2020 and Biden’s in 2021. The former arrived as a check signed by Trump; the latter were digitally deposited with no hint of who had authorized them in bank or investment accounts. 

Last week in his last interview, Biden told Lawrence O’Donnell that a key regret from his presidency was not taking enough credit for his Administration’s accomplishments, saying:

“ “The mistake we made was — I think I made — was not getting our allies to acknowledge that the Democrats did this. So, for example, building a new billion-dollar bridge over the river, we’ll call it the ‘Democratic Bridge,’ figuratively speaking,” Biden said in an interview that aired Thursday with MSNBC’s Lawrence O’Donnell, his final TV sit-down before he leaves office. “Talk about who put it together. Let people know that this was something the Democrats did, that it was done by the party. That’s different than me writing a check and me signing a check and saying I did it.”

“I’m not a very good huckster. I mean, and that – it wasn’t a stupid thing for him to do. It helped him a lot. And it undermined our ability to convince people that we were the ones that were getting this to them,” Biden said. “And so – but I don’t think – ironically, I almost spent too much time on the policy and not enough time on the politics, because, I mean, you have some senators in Congress, Democratic senators in Congress saying, ‘Well, you know, Joe Biden did this, and this is done by so and so and so and so, and this is a – the “new built by the Democratic Party” kind of thing.’”

Biden seemed to think that touting his own accomplishments was unseemly. Like Obama, he seemed to think that his accomplishments would sell themselves. And like with Obama, they did not.

In summary, Biden deserves sterling praise for all of his accomplishments, but his fundamental complacency about norms - whether it was making sure people knew about those accomplishments, or making sure that the leaders of the attempted coup of January 6, 2021 were quickly, vigorously, and resolutely brought to justice - has proven decisive. After four full years there has been an utter failure for justice to be finally rendered for that event. Either the Institutionalists failed to move with sufficient vigor, or else the Institutions themselves - most especially, the Institution of the court system generally and of the Supreme Court itself - were not able to rise up to the task. There is no third choice.

The American Project - fundamentally, the Republic that was established in 1789 - was about the Rule of Law, with checks and balances so that there was no King, and citizens could rely upon the rules being applicable to all and enforced equally. As of January 20, 2025, that Republic is also dead on its feet. There will be no return to the previous norms which allowed it to operate. I am sure there will be elections in 2026 and again in 2028, but whether those - or any others for the foreseeable future - will be in any way conducted in obedience to pre-existing rules agreed upon by all parties is an the results of those elections accepted broadly, is doubtful to say the least. The historical Institutions that Joe Biden sought to uphold have been fatally wounded. And for that reason Joe Biden was the last Institutionalist President.

Addendum: In case it isn’t clear from the above, I fully expect all of the forms of the Institutions to continue to exist in 2028 and beyond. Indeed the Roman Senate continued to exist and meet not just during the Empire, but even for a short while after the last Western Emperor was captured and exiled. But just as Julius Caesar said of the Roman Republic - “The Republic is nothing, a mere name without body or form.” - I expect most people will recognize that the forms are on the order of those we have in the past typically derided as banana republics.


Saturday, January 18, 2025

Weekly Indicators for January 13 - 17 at Seeking Alpha (plus a bonus good CPI graph)


 - by New Deal democrat


My “Weekly Indicators” post is up at Seeking Alpha.

The big news this week was the continued surge in commodity prices, normally a sign of tight demand (but sometimes a shortage of supply, that does not seem to be the case now); and also higher interest rates showing up in corporate bonds and, as expected, mortgage rates.

As usual, clicking over and reading will bring you up to the virtual moment as to the forecast for and nowcast of the economy, and reward me just a little bit for my efforts.


And now a special bonus: I came across the below breakout of CPI components by economist Ernie Tedeschi on Thursday. It’s not worth its own separate post, but it does an excellent job showing how the two big components keeping YoY CPI above the Fed’s target are two lagging ones: shelter and motor vehicle insurance:


As I explained several months ago, here is why motor vehicle insurance lags: first, vehicle prices go up. That means the prices of the components, i.e., parts, also go up. Which means that when vehicles need repairs, the prices go up. More often than not, an insurance claim is made, and the increased price of repairs means that the payout goes up. Which does not go unnoticed by the insurance companies, which hike their prices for coverage. That’s where we are now.

Anyway, take out those two laggards, and consumer inflation is virtually non-existent.


Friday, January 17, 2025

Production rebounds sharply in December, but hold the celebration


 - by New Deal democrat


Industrial production, the now-deposed King of Coincident Indicators, rebounded strongly in December. 

I say “deposed” because before 2001 and especially before the Great Recession, any YoY decline in production *always* coincided with or at least immediately heralded a recession. But since the accession of China to regular trading status in 1999, downturns of even -5% or more, as in 2015-16 and 2018-19 have not necessarily meant recession.

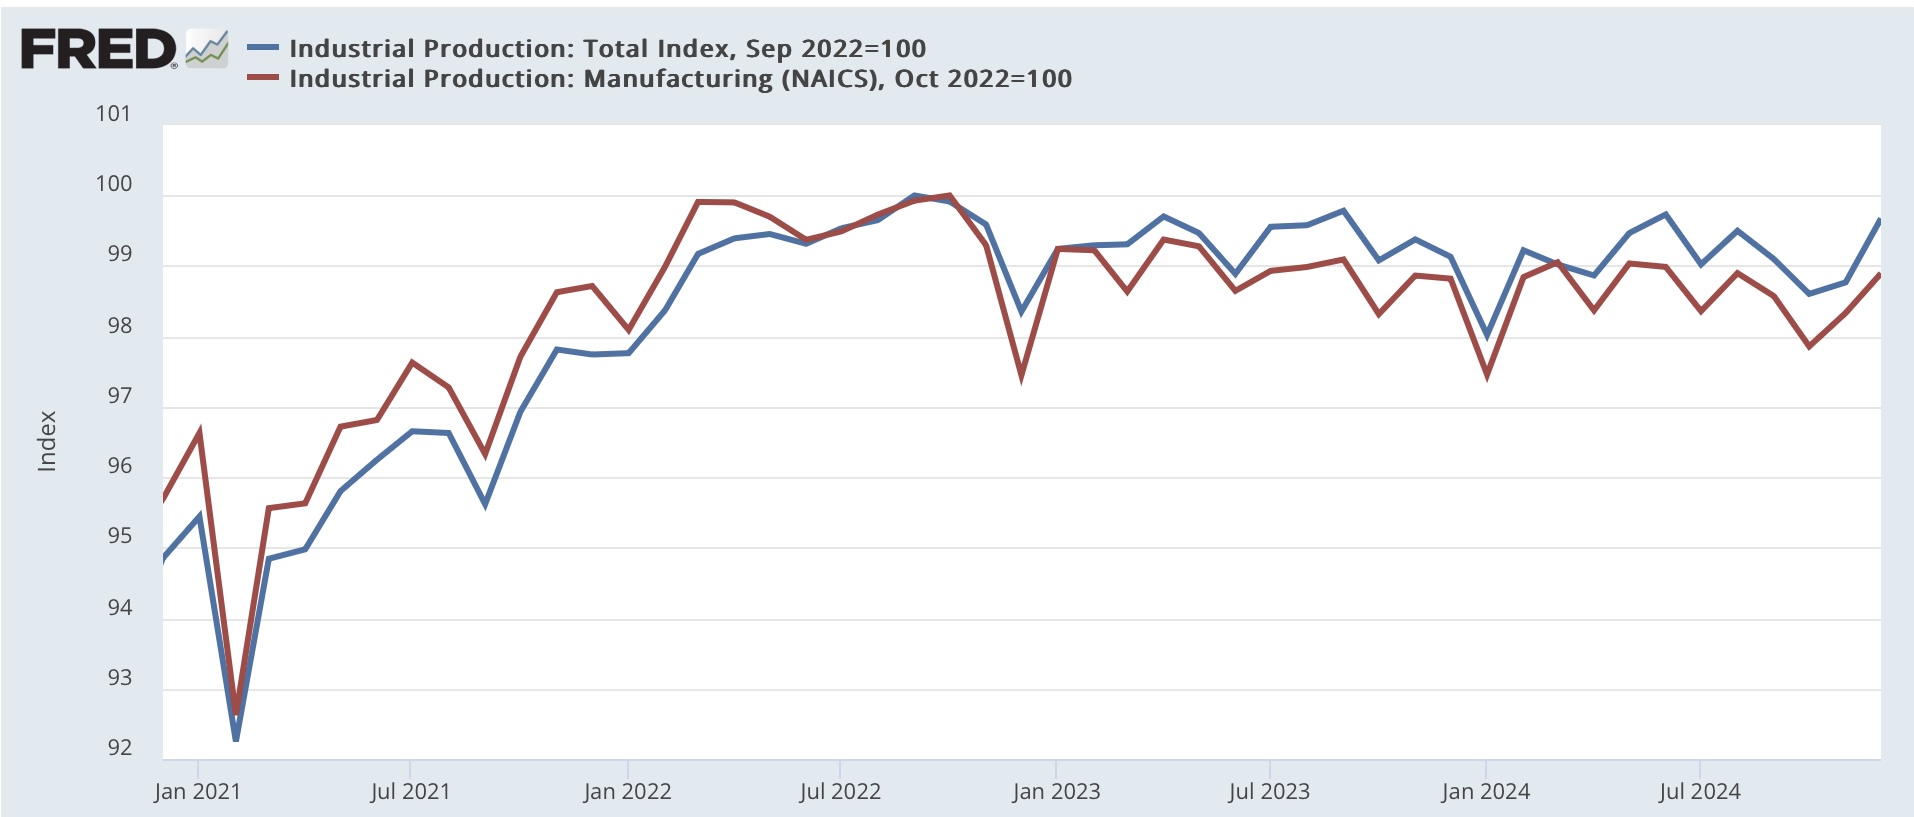
In December total industrial production rose 0.9%, while manufacturing production rose 0.6%. The November number for each was also revised higher by 0.3%. While this is obviously a big increase, mainly it just reverses the likely hurricane induced declines of the past few months. Total production made a 6 month high, while manufacturing production only made a 4 month high. Further, both remain down from their late 2022 peaks by -0.3% and -1.1% respectively:


With the big improvement this month, on a YoY basis total production is now up by 0.6%, and manufacturing production by 0.1%:


Despite the lackluster performance of manufacturing and production for the past two years, the economy has continued to be powered forward by consumption of services, and also by construction sector, and in particular construction employment, which as I pointed out earlier this morning has continued to increase.

Residential housing construction gives *very* mixed signals in December; recessionary red flag continues


 - by New Deal democrat


The most lading components of the long leading housing sector rose in this morning’s report for December, while the most important “hard” economic datapoint continued its decline into recession territory.

First let’s compare the most leading datapoint, permits, and the less noisy single family permits, with starts. To reiterate, starts are much noisier and generally lag permits by one or two months.  And that is what we saw this morning.

Total permits (gold) declined -10,000 on an annualized basis to 1.483 million. Single family permits (red) increased 16,000 to 992,000. Starts (blue) rebounded sharply, by 205,000 to 1.499 million annualized:


This is consistent with historical patterns, as permits bottomed late last spring and have generally slowly risen since. This has now been confirmed by starts particularly as averaged over three months. Also a reminder that some of the past few months’ volatility in starts was the effect of hurricanes in the Southeast, which delayed activity that has now been made up.

The above ought to result in a near term increase in actual construction. But the previous declines earlier in 2024 are still feeding through into this metric, which declined another -6,000 to 1.431 million units, down -16.4% down from its peak, and the lowest number since August 2021:


In the past units under construction have declined on average -15.1% and by a median of 13.4% before the onset of recessions. Indeed, with the exception of one month in the 1980s, when construction has been down more than -10% YoY, that has always meant recession. Currently units under construction are down -14.8% YoY:


Four months ago I hoisted a yellow flag “recession watch” for housing construction, and last month I hoisted the red flag indicating that housing is forecasting recession. Nevertheless, for the past few months I have cautioned that because permits (and now starts) had bottomed, units under construction would probably not fall much further, which this month’s minor -6,000 decline is consistent with. When recessions have occurred, units under construction continue to decline into the first few months of the economic downturn.

Additionally, employment in residential construction, which typically follows units under construction with a lag, has - surprisingly - continued to increase:


In the past, residential construction employment has been the last shoe to drop before a recession begins. Note that in the laste 1980s this did not occur until nearly two years after construction peaked!:


The very big fly in this ointment is the item that leads permits as well: mortgage rates (red in the graph below). These have recently increased back over 7%. The below graph shows them inverted to better illustrate how they lead permits (/1.5 for scale with single family permits):


The increase in mortgage rates over the past 3.5 months has already led to fresh declined in mortgage applications, and is sufficient to forecast a reversal of the recent increase in permits and starts. If - and most likely when - this occurs recession risks increase.

While the housing sector is forecasting recession in the near future, the jury is very much out on other important forecasting components such as corporate profits in the long leading range, and consumption and employment indicators in the short leading range. As I pointed out above, construction employment is still increasing. And the broader goods employment measure has declined only slightly. Real sales and consumption have also continued to increase. All of these would need to turn down to signal a recession in the short term future.

Thursday, January 16, 2025

Real retail sales remain positive for the economy, but suggest further slowing in employment gains


 - by New Deal democrat


Since I posted earlier about why I follow jobless claims so closely, let me briefly restate why I pay a lot of attention to real retail sales.


Retail sales have been tracked for over 75 years. When they are lower YoY, that has historically been a good (not perfect) indicator that a recession is near. That’s because that same 75 year history empirically demonstrates that consumption leads jobs. In other words, it is the change in sales that causes employers to add or lay off employees (not the other way around, as I have sometimes seen claimed).

And the news for December was mildly positive. Nominally retail sales rose 0.4%. Inflation also clocked in at 0.4%, but after rounding real retail sales rose 0.1%, continuing their general uptrend for the past six months:


One of the rare false signals of YoY sales took place in the last several years, as consumers binged on goods purchases with their pandemic stimulus money in 2021 and early 2022, resulting in a downdraft for the next several years:


As you can see, this has abated in the last few months, with YoY real retail sales up 1.0% in December. Much of this pattern has to do with what we saw in motor vehicle prices in the inflation report yesterday. After the big jump in vehicle prices in 2021-2022, consumers balked in 2023, and new vehicle prices remained flat. In the past few months, demand has increased and prices have begun to rise again as well. 

In any event, real retail sales are a positive for the economy in the next few months.

Finally, per the above paradigm, here is the update on real retail sales vs. employment. Because the distortion in shelter prices has had so much effect on consumer inflation in the past few years, last month I also added the comparison with inflation ex-shelter (light blue):


Real sales suggest that employment gains should continue to slow. Indeed, we might very well find out with next month’s annual re-benchmarking of the employment numbers that they already have.

A refresher on why I pay so much attention to jobless claims; and why they are neutral now


 - by New Deal democrat 


This might be a good time to reiterate why I post each week on jobless claims, and what my system is.


Initial jobless claims in particular are a recognized leading indicator. In fact, they are one of the 10 official components of the Index of Leading Economic Indicators. Additionally, together with the YoY% change in stock prices they form my “quick and dirty” forecasting tool. 

Based on the nearly 60 year history of initial jobless claims: when initial claims are lower YoY, that is positive for good economic growth in the next few months. When they are higher by less than 10%, they are neutral — still indicating growth, but more anemic. When they (especially the 4 week moving average) are higher by over 10%, that is a yellow flag indicating the risks of recession are significant. Finally, when they are higher by 12.5% or higher for a period that persists for at least two months, that constitutes a red flag recession warning, because under those circumstances a recession has almost always been close at hand. We almost triggered that red flag 18 months ago, but the high YoY change in claims backed off just short of the two month trigger. It has turned out that there is some residual seasonality that hasn’t been massaged out of the numbers that first really appeared in 2023, and that is the type of reason why I need the signal to persist for at least two months.

With that out of the way, let’s look at this week’s numbers.

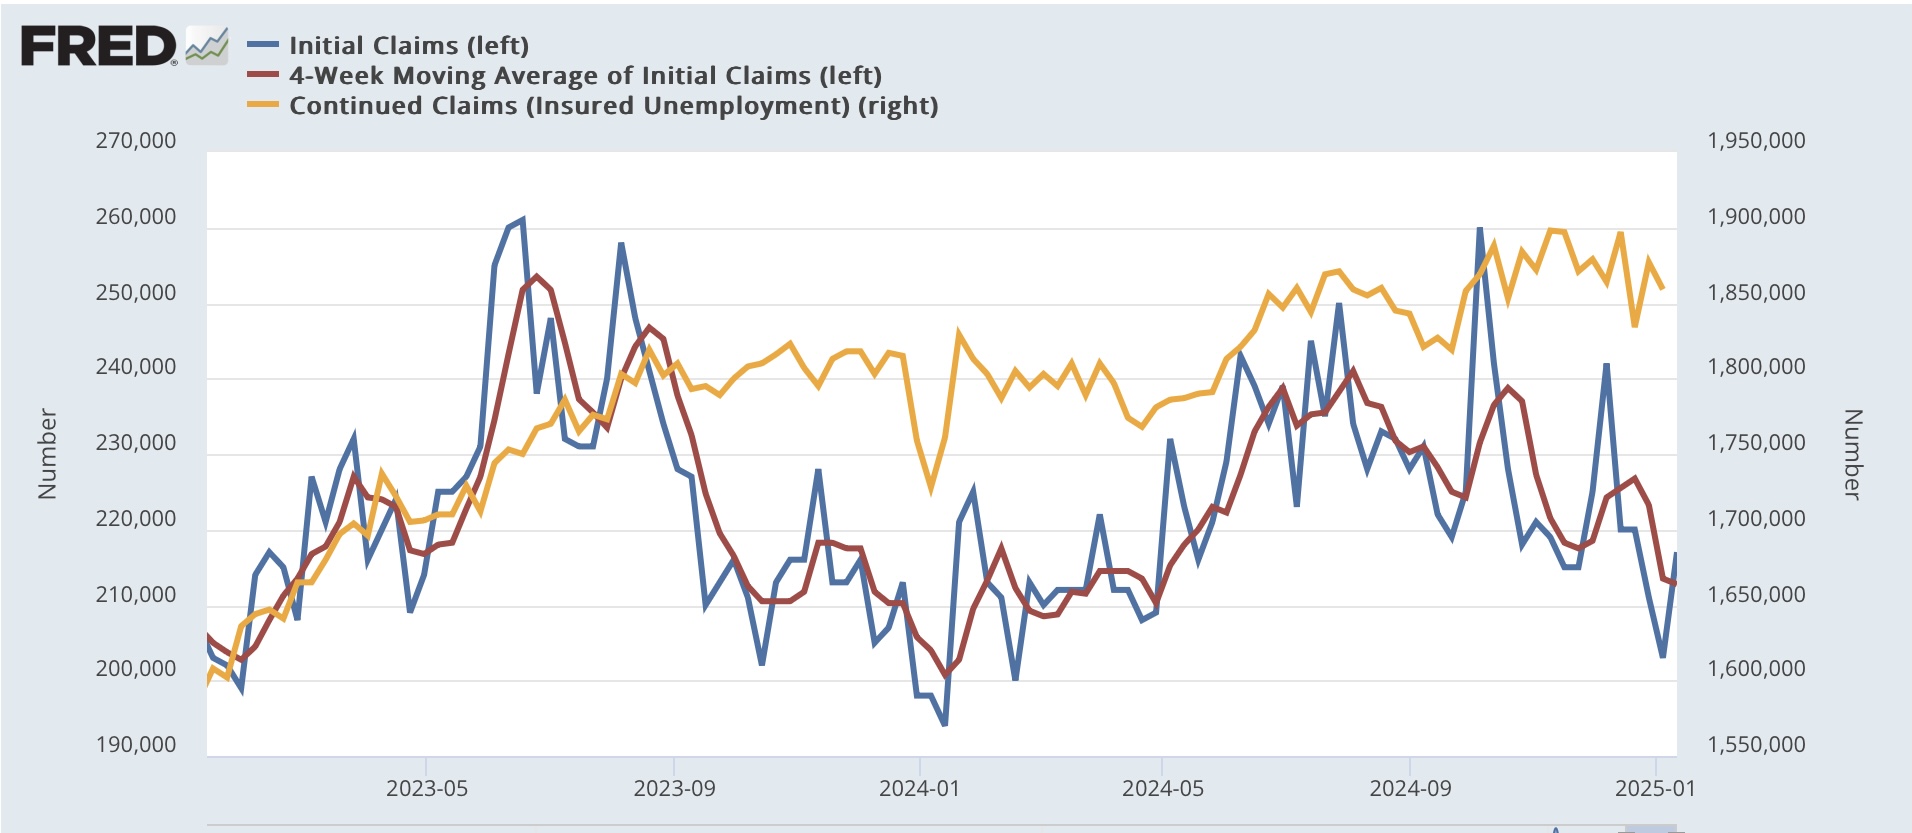
Initial claims rose 14,000 to 217,000, while the four week average declined -750 to 212,750. Continuing claims also decreased -18,000 to 1.859 million:


On the YoY% basis I use for forecasting as described above, initial claims were up 11.9%, while the more important four week moving average was up 6.0%. Continuing claims were also up 7.6%:


Per the above, although the weekly number came in higher by more than 10%, because the four week average remains under that threshold, this was a neutral reading. It suggests slow improvement in the economy in the months ahead.

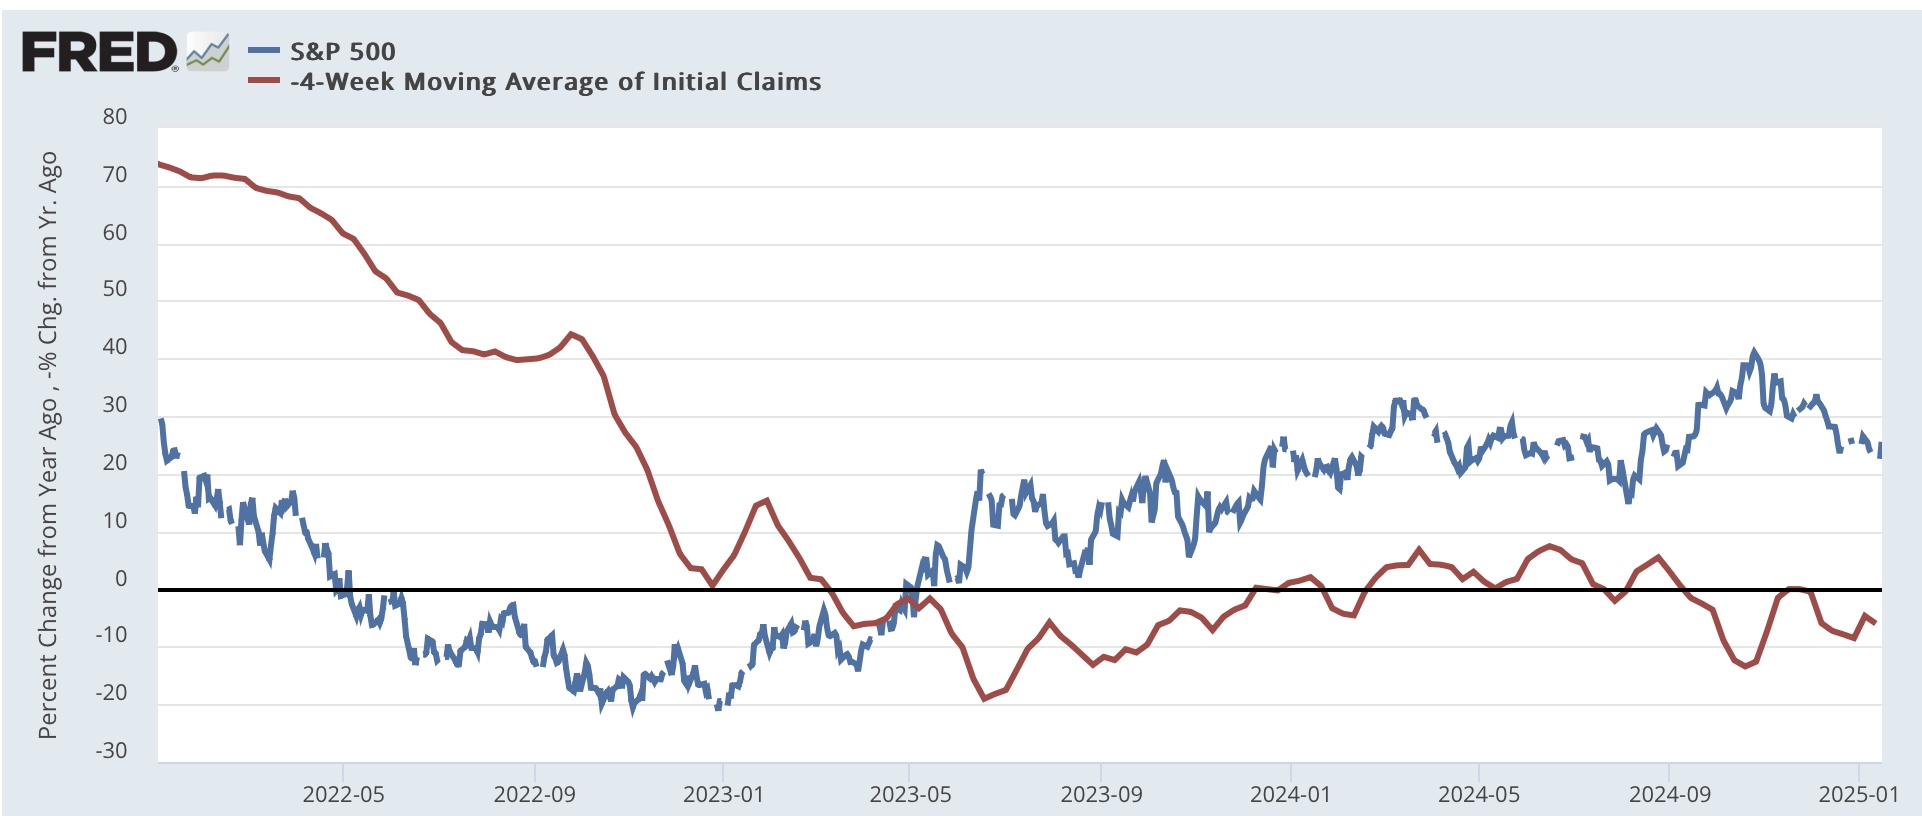
Finally, since I mentioned it above, here is the current state of the “quick and dirty” model (note the four week average of initial claims is inverted so that a negative reading shows as below the zero line):


Note there was a brief 2 month period in 2023 when both were negative, but jobless claims were not higher by more than 10% during that period, so there was no true recession signal.


Wednesday, January 15, 2025

December CPI: rebounds in gas and car prices outpace deceleration in shelter and insurance laggards


 - by New Deal democrat


December consumer prices indicate that we are leaving the immediate post-covid era and seeing a rebalancing of sectors, as sectors that declined sharply in the past several years rebound.

As in November, the only two categories of “hot” numbers showing price increases of 4.0% a year or more are two laggards: shelter and transportation services. All of the former problem children are now more or less in line.

As per usual, the biggest dichotomy in the numbers is shelter vs. ex-shelter, but let’s start with the headline and core CPI readings. For the record the former increased 0.4% for the month, while the latter increased only 0.2%. On a YoY basis, headline prices are up 2.9%, an increase of 0.5% from their 2.4% low three months ago. Core prices excluding food and energy are up 3.2% YoY:


Now let’s look at CPI for shelter vs. ex-shelter:


Shelter prices increased 0.3% for the month. Everything else all together rose a sharp 0.5%. On a YoY basis, shelter increased a little under 4.6%, its lowest such reading since January 2022. Despite the “hot” monthly reading, all other prices increased 1.9% YoY, the 20th month in a row they have risen less than 2.5%.

As it has been for several years, in the broadest terms inflation in excess of the Fed target remains almost all about shelter.

Within shelter, both actual rents and “owners equivalent rent,” the fictitious measure of house prices, increased 0.3%. On a YoY basis, rent increased 4.3% while OER increased 4.8%. Both of these are the lowest since early 2022:


While the deceleration in shelter inflation has been slow, it is continuing as forecast from both the leading house price and new apartment rent indexes. To reiterate what I wrote last month, the Philadelphia Fed’s experimental new and all rent indexes, which are designed to lead the CPI for rents, for the last two quarters have forecast a decline below 4% YoY, and at the current pace of deceleration, that forecast could come to fruition within the next 2 to 3 months.

Turning to the other remaining problem child, transportation services (mainly insurance and repair costs); recall that these lag vehicle prices. In December, new vehicle prices increased 0.5%, and used car prices increased 1.2%. These have been strong monthly numbers in th past few months. But on a YoY basis, new car prices are down -0.4%, and used car prices down -3.3%. In other words, this is a rebound from the pullback since 2023 [Note: instead of YoY, graph is normed to 100 as of just before the pandemic, better to show the surge in prices and the stagnation or decline afterward]:


In December transportation services costs increased 0.5%. On a YoY basis, they rose from 7.1% to 7.3%, which is still nearly the “best” reading in 3 years:


Within transportation services, motor vehicle repairs are up 6.2% while insurance is up 11.3%.This is the real problem child is motor (for which unfortunately FRED does not provide a graph). 

What the above all means is that if we were to take out the two areas that we know lag, shelter and transportation services, consumer inflation would probably be up only something like 1% YoY.


Another former problem child of food away from home increased 0.3% this month, and is up 3.6% YoY, the lowest increase in over 4 years:


Last month I wrote that another emerging sector of concern is medical care services. This month they increased 0.2%, while the YoY measure decelerated to 3.4%, which is good news, as in the context of the past 10 years, this increase is only a little above average:


Before I finish, let me also update one important labor sector graph.

Nominally aggregate payrolls increased 0.4% in December, which means that after adjusting for today’s inflation number, real aggregate payrolls were unchanged, but at their record high:


This is consistent with continued economic expansion over the near term.

So let’s conclude. The lagging sectors - shelter, and motor vehicle repairs and insurance - are the primary sources of remaining high inflation. But both are decelerating as expected. At these same time, new and used car prices are rebounding from their stagnation (new cars) and deep declines (used cars) of the past several years, as are energy prices. Because the former are decelerating more slowly than the latter are rebounding, headline inflation has started to increase again.


Tuesday, January 14, 2025

Producer prices join the parade of yellow flags


 - by New Deal democrat


I generally don’t pay too much attention to producer prices, but there are a couple of exceptions. One exception is that sometimes producer prices lead consumer prices by a number of months. That hasn’t been the case recently. But the other exception is that producer prices can tell us whether profit margins are being squeezed or not. *That* is relevant at the moment.


Let me start with the monthly change in raw commodity prices (gold, /2 for scale), final demand producer prices (blue), and consumer prices (red) for the past two years:


The most important component of the above graph is that the downdraft in commodity prices - which are the most upstream prices of all - appears to have ended, as the big declines of 2023 abated except for three months in 2024. And there have been no declines in the past three months. So there is no tailwind likely to help consumers downstream (okay, I’m mixing metaphors but you get it).

Now here’s the YoY look, going back three years:


Again, we see big declines in the year after June 2022, the peak for oil prices after the Ukraine invasion. For the past nine months, commodity prices have been stable on a YoY basis. 

Even more importantly, note that final demand producer prices - the ones just before products and services are finished for consumption - have risen YoY for the past several months, from 2.1% in September to 3.3% last month. That compares with 2.7% for the last month reported in the CPI. 

Producer prices increasing faster than consumer prices means producers cannot pass on their price increases to consumers, which has the effect of squeezing their profits. And that appears to be happening, as suggested by the latest actual + estimated earnings for Q3 and Q4 of last year as reported by publicly traded corporations (via FactSet):


Earnings barely increased in Q3, and so far are estimated to barely increase again in Q4. And when corporate earnings stall, CEO’s start looking for ways to cut costs.

We’ll see what happens with consumer prices tomorrow, but this is yet another yellow flag suggesting recession risks are rising (albeit still relatively low) for later in 2025.

Monday, January 13, 2025

Scenes from the last employment report of Joe Biden’s Presidency


 - by New Deal democrat


Friday’s jobs report was an excellent one for Joe Biden’s Presidential term to end on. In the past 4 years, 17 million jobs have been created. Even if we take out 2021 as being a COVID rebound year, in the past 3 years there were 9.8 million new jobs, an average of 272,000 jobs per month. Meanwhile the unemployment rate declined from 6.7% at the end of 2020 to 4.1%. It rose 0.2% from 3.9% three years ago, ranging from a low of 3.4% to a high of 4.2%, which is still an excellent record. Real average nonsupervisory wages are up 0.6% from December 2020, and 1.3% from December 2021 - not so great, but still positive. And since average wages in 2020 were distorted by layoffs mainly affecting lower income workers, if we measure from December 2019, real wages have risen 4.8%.


Not too shabby.

But let’s focus on a couple of items from last Friday’s report beyond the headlines.

One of the important revelations in the past year has been how the nearly 6 million new immigrants since 2020 have distorted the unemployment rate, even as job growth has been robust. So this month let’s break out this rate for native born vs. foreign born workers. Remember that new workers who can’t find jobs don’t file for jobless claims, and Los Illegales generally do not either.

The below graph breaks out the YoY% change in initial jobless claims (light blue) vs. the total unemployment rate (light red); and compares both with the total of initial + continuing jobless claims (dark blue) and the unemployment rate for the native born only (dark red):


Initial claims always lead, but those unemployed also include people with continuing claims. So while it is less leading, the unemployment rate tracks closer to the total. And in this expansion, the unemployment rate for the native born tracks even closer than that. The inclusion of continued claims helps explain why the unemployment rate never ticked lower YoY in 2024, while the limitation of the unemployment rate shows a much less noisy leading/lagging relationship. As of December, while initial claims were higher YoY by 7.4% vs. the total unemployment rate being up 7.9%*, the combination of initial plus continuing claims were up 3.9% vs. native born unemployment being up 5.7%* (*remember these are percent changes of a percentage).

Now let’s turn our attention to employment in the goods producing sector. Recall that historically, services employment almost never actually goes down more than a fraction except in severe recessions. The decline in employment during recessions is almost all about declines in goods-producing jobs. And goods producing jobs are a leading indicator, always peaking some months before a recession begins:


Goods producing jobs in turn fall almost totally into two categories: manufacturing and construction. In the following graphs I break out the two categories separately, and focus on the recession since the 1980s.

Note that in the mid-1980s manufacturing already had a substantial downturn, but construction jobs grew strongly. It was only when both turned down in 1989-90 that a recession was forecast:


The 2001 recession by contrast was producer-led.  Construction jobs continued to grow very slowly into that recession, but manufacturing turned down sharply in advance:


Manufacturing jobs continued to decline during the “China shock” of the 2000’s, but the downturn accelerated in advance of 2007, and was joined by a downturn in construction jobs in 2007:


At present construction jobs are still increasing, while manufacturing jobs have turned down slightly:


It’s helpful to also compare this information YoY, which the next two graphs do in 20 year increments:


The closest comparison to the present is with the 2001 recession, but by the onset of that recession manufacturing jobs were down -2.1% YoY, while construction jobs were only up 1.3% and in a sharply deteriorating trend. At present, manufacturing jobs are down only -0.7%, while the trend in construction jobs has been one of slow deceleration, currently at 1.6% YoY. 

While the downturn in goods producing jobs as a whole from a peak three months ago is definitely cautionary, such minor downturns have happened many times before without a recession beginning. In other words, we have a necessary but not sufficient leading indicator at present. Most importantly, at present I am focusing on construction jobs, which seem to be levitating in the face of a downturn in the housing market and a small downturn in total construction spending. If the construction sector joins the manufacturing sector in deterioration, it will be much more concerning. But it isn’t now.