Friday, November 18, 2022

Core inflation using house prices rather than imputed rents


 - by New Deal democrat

Later this morning existing home sales will be reported for October, which will mainly be of interest to me only for what happened with prices, and secondarily whether the problem of low inventory which has existed for 3 years is moving in the direction of resolution.


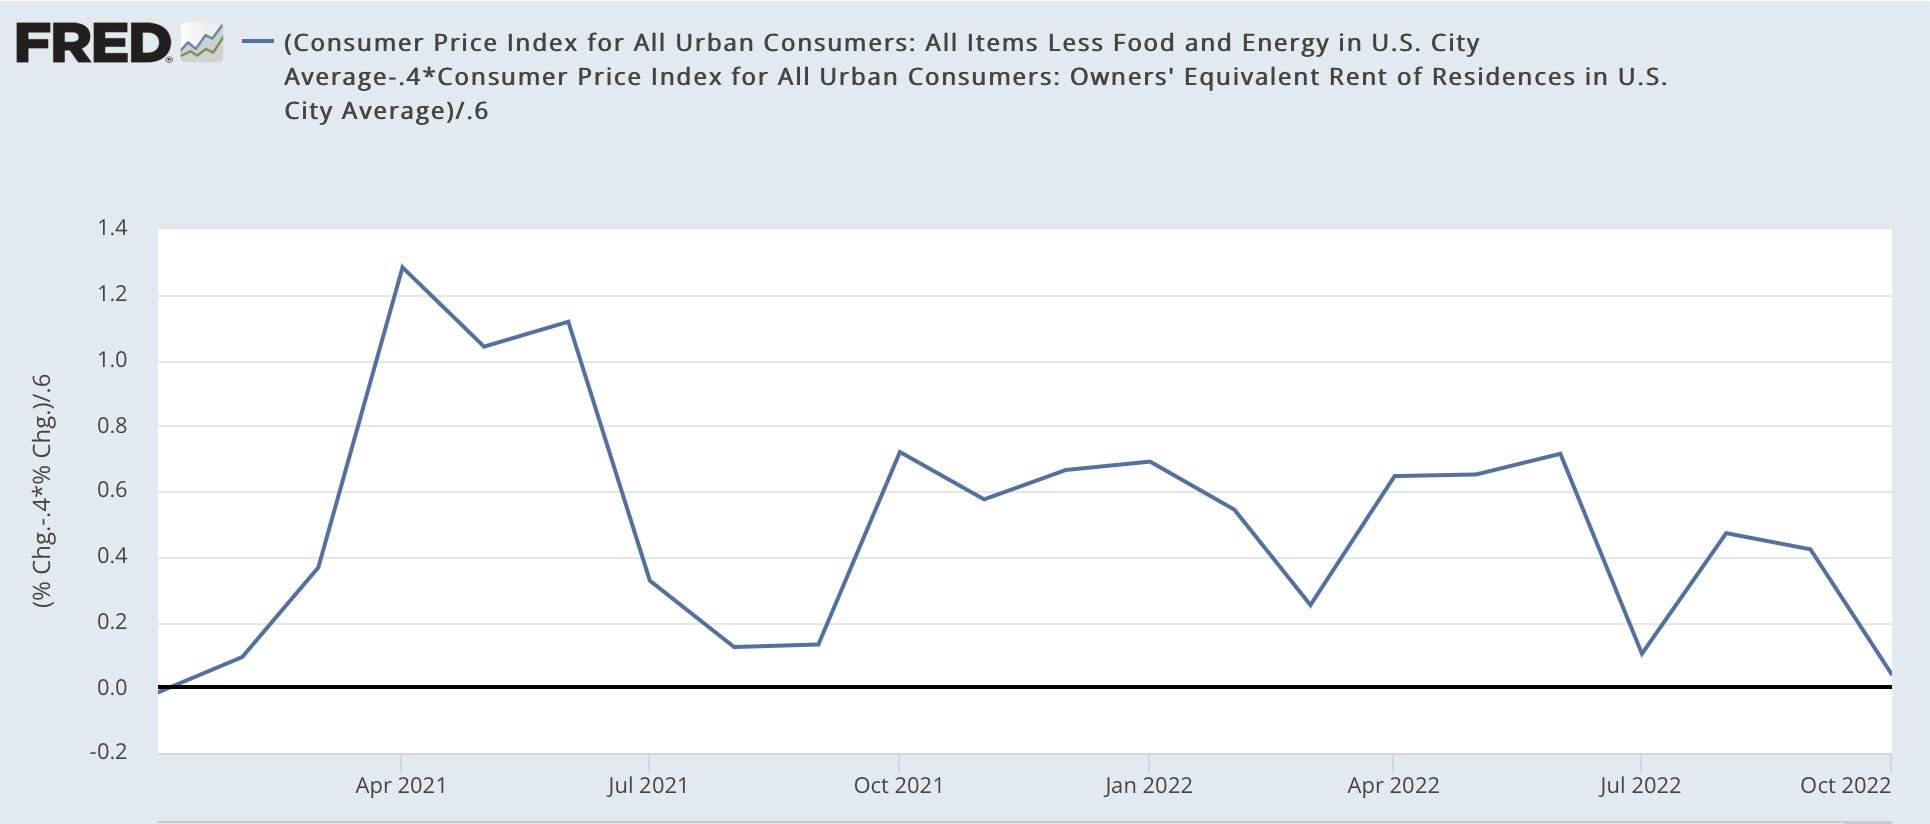
In the meantime, yesterday Jason Furman got some traction, and amplification by Paul Krugman, of the below graph which measures core inflation using new rent indices (e.g., Zillow) rather than owners’ equivalent rent:


The implication is - one embraced by Krugman - that inflation is already not a problem. 

I don’t think this is really the case, because we are still using an imputation of hypothetical rents to measure house prices.

I already posted a graph of what core inflation ex-shelter would look like:


But let’s go one step further and measure what core inflation, *including* shelter looks like, using actual house prices as measured by the FHFA Index rather than owners equivalent rent, thus banishing the entire problem. Here it is:


Most importantly, as of August (the last month for which the house price index has been reported), YoY core inflation including house prices was 8.6%. At its peak 6 months earlier in February, it was 12.4%. If it were to continue to decline at that rate, in October core inflation using actual house prices would be 7.3% - declining fast, but still above the official 6.3% reading of core inflation using imputed rents. It would take until about next April for core inflation using house prices to get to the Fed’s comfort zone of 3% or less.


Thursday, November 17, 2022

Housing permits and starts continue to fall, but housing under construction continues to (slowly) rise


 - by New Deal democrat


The monthly numbers for housing permits, starts, and single family permits all declined this month. Permits (red in the graph below) declined -38,000 annualized to 1.526 million annualized, and starts (blue) declined -62,000 annualized to 1.425 million, both the lowest since summer 2020. Single family permits (gold, right scale), which have the most signal and least noise, declined -31,000 annualized to 831,000, the lowest since May 2020 and before that, the lowest since April 2019:


Perhaps more importantly, here’s a variation on a graph I have run many times over the past 10 years, comparing the YoY change in interest rates, in this case mortgage rates (inverted, *10 for scale) with the YoY% change in total housing permits (red) and single family permits (gold):


These are well within the ranges of declines that have previously been consistent with recessions, with the exception of 1966, although frequently (not shown) the actual recession hasn’t started until there has been a -40% decline.

As I always point out, interest rates lead housing permits roughly by 3 to 6 months. As shown above, for example, this year mortgage rates turned negative (i.e., higher) YoY in April. Housing permits in total and for single family units followed in August. As of now, YoY interest rates have risen almost 4%, an increase only exceeded by 5% and 6% increases in 1980 and 1982 respectively, which coincided with -50% declines in housing permits (not shown). Thus, we should expect housing permits to have declined by about -40% by about January or February, to levels of 1.100-1.150 million and .700-.740 million units annualized, putting a likely recession start date in the 1st quarter of 2023.

BUT, this time it really is slightly different. In the past, housing permitted and not yet started, and housing units under construction, have typically turned down well in advance of the onset of any recession:


But because of a shortage of building materials, there have been record numbers of housing units that have been permitted, but have not yet been started (blue in the graph below), which appears to have peaked in July,  and consequently a big lag in housing under construction (red), which rose slightly again this month, although it has only risen 3.2% in the past 6 months:


Because housing under construction is the actual economic activity, this suggests that  residential housing has continued to contribute ever so slightly to GDP growth. 

This is reinforced by the generally coincident nature of employment in residential construction (gray in the graph below) compared with housing units under construction:


With the sole exception of the 2020 pandemic lockdown recession, construction, which is an even smoother metric than single family permits, has always peaked at least 6 months before the onset of recession, with a median time of 18 months, and as much as 47 months; and has declined at least 6.5%, and as much as 34%, with a median decline of 20% from peak:


In other words, there is a significant element of “it’s different this time,” in that construction has in the past typically followed a decline in permits by 0 to 11 months, with a median of 5.5 months. Further, a recession has typically followed a decline in construction by between 6 and 47 months, with a median time of 18 months; and has declined at least 6.5%, and as much as 34%, with a median decline of 20% from peak.

We are now 10 months out from the peak in permits, and construction has not yet rolled over. Nor has residential construction employment, which has also typically turned down months in advance of any recession. Thus past history would suggest no recession begins until at least 6 months from now, and possibly much later - depending on how quickly construction rolls over and how abruptly it declines.


Jobless claims: evidence the jobs market is cooling slightly from white hot to red hot


 - by New Deal democrat

Initial jobless claims declined -6,000 this week to 222,000. The 4 week average rose 2,000 to 221,000. More interestingly, continuing claims one week ago rose 13,000 to 1,507,000, the highest number in over 7 months:


By historical standards, it is still true that almost nobody is getting laid off (outside of tech). But current numbers are evidence that the job market, while still red hot, is not quite as white hot as earlier this year. In fact, if jobless claims were to stay at current levels, by the end of January they will be negative YoY and up over 20% from their lows, which would turn this indicator - which has been one of the most positive all this year - negative.

Wednesday, November 16, 2022

October industrial production: consistent with a very slow expansion


 - by New Deal democrat

I call industrial production the King of Coincident Indicators, because more often than any other metric it coincides with the peaks and troughs of economic activity as determined by the NBER, the official arbiter of recessions.


Unlike retail sales, the news this morning for October was not so good. While manufacturing production did increase +0.2% to a new post-pandemic high, overall production declined -0.1% for the month. Also, July and August’s production numbers were revised down -0.1% each, and September’s strong number was revised down -0.4% to only +0.1%. As a result, total production has gone nowhere in the three months since July:


This sideways trend in total production is frequently observed before recessions, but it also coincides with slowdowns during expansions (see, e.g., 2018-19), so is not particularly dispositive of anything. Unfortunately FRED does not have a tool for creating 3 month moving averages (the one big shortfall of that site imo), but I can approximate showing you this via a graph of the quarter over quarter change for the past 60 years ending with the July-September quarter:


Note, for example, the negative q/q reads during the 1966 and 2016 slowdowns. 

This is a report consistent with a very slowly expanding economy, but one that is not yet in recession.

October retail sales: consumers: “We’re not dead yet!”


 - by New Deal democrat

Retail sales, my favorite consumer indicator, was reported this morning for October. And it was a good number, up +1.3% nominally, and up +0.5% after adjusting for inflation:


On the bright side, this was the highest absolute number since April. On the down side, retail sales have still gone essentially nowhere for the last 18 months. 

As a result, YoY retail sales are only up +0.5%. Since real retail sales YoY have an excellent historical record of coinciding with imminent recession, here they are historically from 1997 through 2019, compared with real aggregate payrolls for non-supervisory employees, another excellent coincident indicator (gold), and also real personal spending YoY (red):


The latter historically has lagged somewhat, but is included because there is an excellent case that this year consumers have shifted from spending on goods, which are more reflected in retail sales, to spending on services, which are better picked up in the personal income series. Here’s the close-up of all three for the past year:


Real retail sales did go negative for several months in the spring, coinciding with the negative Q1 and Q2 real GDP reports, but have since turned slightly positive. As I noted the other day, real aggregate payrolls remain positive - although certainly not strong; and real personal consumption expenditures are still pretty robust.

Short conclusion: no recession yet.

Because real retail sales have also historically been an excellent short term indicator for payrolls, here is that comparison for the past year, together with real personal spending as well:


Although this month’s retail sales report was very good, it nevertheless continues to imply further weakening jobs reports in the months going forward.

So, a good report, but one that does not change the underlying decelerating trends.


Tuesday, November 15, 2022

October producer prices: more evidence that supply chain pressures have eased


 - by New Deal democrat

Let me start this discussion of October’s producer price index by pointing to the NY Fed’s “Global Supply Chain Pressure Index” for the past 5 years through October:


Before Trump’s tariff’s in 2018, most often this index was slightly below zero. It zoomed higher when the pandemic, and with the exception of a few months, stayed there until spring of this year. It has generally declined since the beginning of this year, and especially since May. It is now showing only a little more than “normal” pressure.

With supply chain issues abating, so has pressure on producer prices. In October, prices for final demand, and “core” demand minus food and energy, both increased 0.2%:


On a YoY basis, final demand PPI decelerated to 8.0% (compared with a March high of 11.7%), while “core” prices decelerated to an 8.1% gain:


Perhaps more importantly, for the last 4 months final demand PPI has increased by precisely 0.0. With supply chain pressures eased, if this deceleration continues, by sometime next spring producer prices will be within their pre-pandemic “normal” range of inflation.

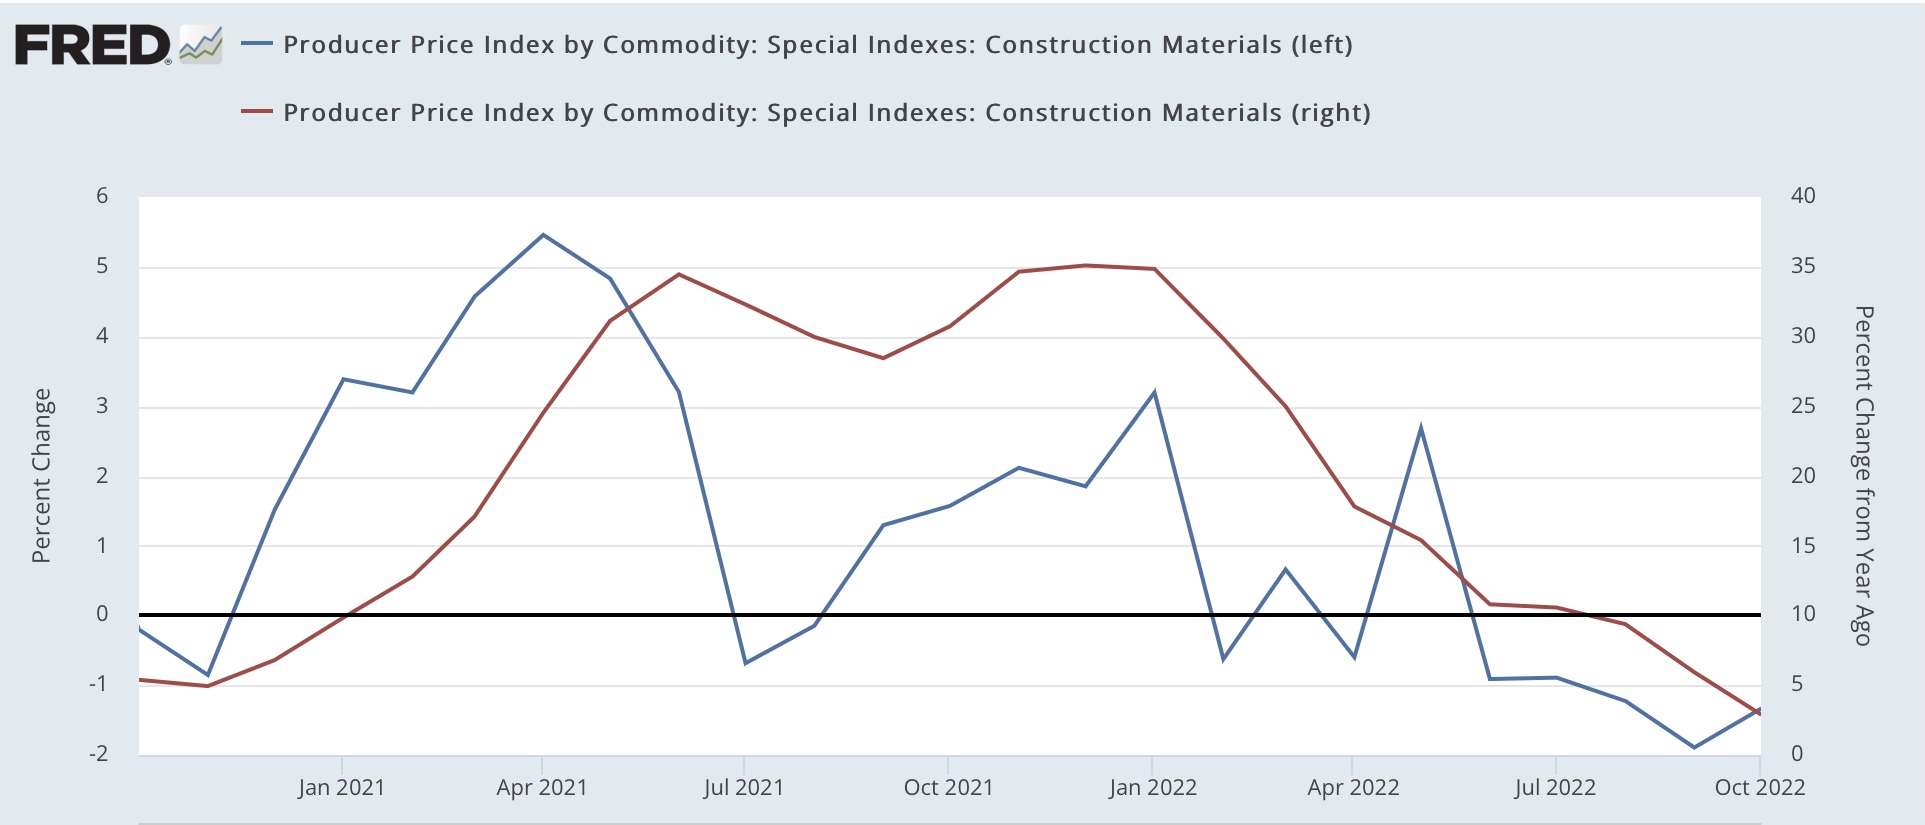
Of special note, producer prices for construction materials declined -1.3% in October (blue, left scale below); on a YoY basis they have decelerated to only a 2.9% gain (red, right scale):


This is in marked contrast to the rising 7.9% YoY gain in “owner’s equivalent rent” in the CPI. Here’s a comparison of the last two years of CPI and PPI:


If producer and consumer prices continue to trend as they have since the middle of this year, then by the middle of next year they will both be back into a “normal” range.  The question remains, how much damage will the Fed insist on doing before we get there?


Monday, November 14, 2022

Some foreboding signs and portents from consumption and employment data


 - by New Deal democrat

I have a special post up at Seeking Alpha, looking at some very troubling signs from several of the high frequency indicators I track weekly as to consumption and employment.

Click over and read the whole article, but here is a little taste: the below is what the YoY% change in the 20-day total of payroll tax withholding has been in has been as of the first week of each month this year:

  • Jan +9.3%
  • Feb +11.6%
  • Mar +13.4%
  • Apr +12.6%
  • May +3.6%
  • June +20.7%
  • July +7.8%
  • Aug -3.4%
  • Sept +1.7%
  • Oct +3.6%
The first half of this year was, in the aggregate, terrific. And then things slowed down precipitously. Considering inflation has been over 5% YoY all year long, this chart certainly appears to indicate that, in real terms, there has been no YoY increase at all in payroll tax collections since late summer. That’s not good.

Saturday, November 12, 2022

Weekly Indicators for November 7 - 11 at Seeking Alpha


 - by New Deal democrat

My Weekly Indicators post is up at Seeking Alpha.

Although a few indicators are holding up, in the past month there has been almost continual deterioration in several employment and consumption metrics. These are particularly important for whether the consumer is pulling back, typically a signal that a recession is close to imminent.

As usual, clicking over and reading should bring you up to the virtual moment as to the state of the economy, and reward me a little bit for my efforts.

Friday, November 11, 2022

Real average hourly wages and real aggregate payrolls for October


 - by New Deal democrat

With yesterday’s report on October consumer prices, we can up two of my favorite measures of how the working/middle class is doing - real average non-supervisory wages, and real aggregate payrolls.


Real average wages for non-supervisory workers declined -0.1% for the month. They are -5% below their pandemic lockdown peak (which, recall, was affected by more lower wage workers being furloughed) and -2.6% lower than they were in September of last year:


Real aggregate payrolls measure how much wealth the middle/working class is earning as a whole. In the past 60 years, when that has outright declined on a YoY basis, it has always - with no exceptions - coincided, give a month or two, with the onset of recessions:


The news here was good. Really, really tepid, but still good.

Real aggregate payrolls were unchanged for the month, and remained +1.1% higher YoY:


In the past few months, both inflation and nominal payroll growth have decelerated. To signal an imminent recession, nominal payroll growth is going to have to decelerate significantly more than inflation. That it hasn’t done that much in the past several months is at least muted good news.

Thursday, November 10, 2022

October CPI report: total inflation increasing at 3.5% annual rate, core inflation minus shelter increasing at 2.8% annual rate in the past 4 months


 - by New Deal democrat

For a full year now I’ve been hammering the fact that the official CPI measure of housing inflation, “owners’ equivalent rent,” seriously lags actual house prices as measured by the most popular housing indexes. I said then, and I have reiterated almost every month since, that because of this serious lag, OER was going to rise probably to 7.5% YoY or more, and drag core CPI along with it. That remained evident in this morning’s October CPI report.


Here are the headlines:
Total CPI +0.4% +7.8% YoY (-0.4% YoY decrease from last month, and down -1.2% from June’s high of +9.0%)
“Core” CPI +0.3% +6.3% YoY (-0.4% decrease from last month’s 40 year high)

The below graph shows the monthly change in total (blue) and core (red) inflation since  January 2021:


It’s clear that there has been a significant deceleration in the past 4 months.

Owners’ equivalent rent rose +0.6% for the month, making a new +6.9% all time high YoY (exactly as I started forecasting a full year ago) compared with the FHFA purchase only house price index (black, /2 for scale):


Here’s what core inflation excluding OER looks like m/m (it was unchanged!):


And YoY (up 5.9%):


In other words, in the last 4 months, since gas prices peaked, total inflation has increased at a rate of  3.6% YoY. Core inflation minus OER has increased at only a 2.8% annual rate.

Here are some other highlights of the report.

Energy prices increased 1.8% for the month:


Used vehicles: -2.4% +2.0% YoY (down from +41.2% in February
New vehicles: +0.5% +8.4% YoY (down from +13.2% in April)


The YoY sharp deceleration in used car prices doesn’t mean they’re cheap: they’re still almost 50% more expensive than they were when the pandemic lockdowns ended. But they are about -5% down from their January peak. New vehicles are still very problematic:


In sum, high inflation at this point is primarily a function of housing. And while actual house prices have turned down slightly in the past several months, and are sharply decelerating YoY (but still up 12% vs. their 20% YoY high), the fictitious and lagging measure of housing - owners equivalent rent - that is used by the Census Bureau continues to misrepresent the true picture.

To repeat how I closed this report last month, in hiking rates, the Fed is chasing a phantom menace.

Jobless claims: still holding steady


 - by New Deal democrat

Initial jobless claims rose slightly, by 7,000, from one week ago to 225,000. The 4 week average declined -250 to 218,750. Continuing claims also rose slightly, by 6,000, to 1,493,000:


This is right in the middle of where claims have been for the last 6 months. If anything, there might be a slight rising trend in the last month.

The jobs market remains very tight. Aside from Zuckerberg’s and Musk’s employees in social media, almost nobody is getting laid off.

Wednesday, November 9, 2022

Some Big Picture comments on the 2022 midterm elections


 - by New Deal democrat

No economic news today while we await tomorrow’s big inflation report (Hint: shelter inflation is going to continue to be the big driver); and I think maybe we had a little political event yesterday, so let me make a few brief comments.


1. From the beginning of this year, I told everybody who would listen that (1) the Supreme Court was really and truly going to overturn Roe v. Wade; and (2) as a result, the entire dynamic would reverse, as there would be the Mother of All Backlashes.

And that, in a nutshell, is what happened.

It is still quite possible that the GOP could squeak out a 1 vote majority in the Senate; and it seems more likely than not that the GOP will wind up with a small majority in the House; but this is a red ripple; and the best performance by the in-party in a midterm since 2002 (9/11) and 1998 (impeachment).

2. Another demonstration of second order chaos; namely, when you observe human behavior, the humans always observe back, and change their behavior as a result. Nate Silver and other aggregators had one or two good calls, after which pollsters learned how to game his system. This year, as Dan Guild brilliantly observed several weeks ago, GOP leaning pollsters “flooded the zone” with pro-GOP polls in the last few weeks before the election. That, plus an absolutely ludicrous NYT poll of 500 or so people, led to a narrative that the electorate had suddenly plumped for the GOP in the late going. 

Perversely, that move by the GOP may have had its own backlash effect, causing pro-civil rights (mainly young) voters to panic and realize they had better get out and vote if they didn’t want to lose their rights. This morning, I’ve already read that the GOP won voters over 40 and decisively won voters over 50, while younger voters, and especially voters in their 20s, broke decisively for Democrats, and actually *showed up to vote.*

3. The GOP movers and shakers in their back rooms have to realize how toxic Trump is to their broader electoral prospects. All of Trump’s candidates except one, so I hear this morning, lost (with the jury still out on Georgia, which is probably heading to another runoff).  They are going to encourage Ron DeSantis to run. And if I am Ron DeSantis, I wake up this morning with a big Florida win totally NOT intimidated by Trump.

A 2024 slugfest between Trump and DeSantis in the GOP looks likely. Aside from rooting for injuries, if DeSantis squeaks out a win in the primaries, there is no way Trump is going to fall in line. He will p*** all over DeSantis, and encourage his cultmembers to write in his name anyway.

4. Not much is going to happen in Congress in the next 2 years, but the debt limit ceiling, and judicial nominations, will be major crises should the GOP squeak out a victory in the House or Senate, respectively.

5. Finally, economically, don’t forget that the Fed seems determined to put the US in a deep recession in the next 12 months. This is very not good.


Tuesday, November 8, 2022

Coronavirus dashboard for November 8: the new alphabet soup of variants fails to generate a new wave (so far)


 - by New Deal democrat

Biobot has not updated since late last week, showing COVID particles at or near 6 month lows both nationwide:


and in all 4 Census regions:


As expected, the CDC’s variant update last Friday showed that BA.5 was down to 40% of all cases, with the alphabet soup of new variants descended from BA.2 and BA.5 making up the other 60%:


Regionally, (not shown) BA.5 is particularly low, at only 25% of all cases, in NY and NJ.

Confirmed cases remain higher than their recent low of 34,300 set 2.5 weeks ago, at 39,600, but the trend is more flat than rising:


The same of true of hospitalizations, at 24,800 almost 2,000 above their recent lows:


Deaths have continued to decline, at 316 close to a 6 month low, and only higher than about 4 months during the entire pandemic:


A regional breakout of confirmed cases shows an increase only in the Midwest, while the Northeast has the highest absolute level per capita. Cases are generally flat in the majority of States and Puerto Rico. 

Cases have been declining in the 6 New England States (shown below plus NY and NJ):


and also Washington State.

Cases are rising in CO, NM, IN, KY, LA, MD, MO, NE, NV, OH, SD, UT, and WV:


Although note that the increases are relatively small except in NM, CO, and KY.

It appears the winter wave is slowly beginning, but it is encouraging that it remains so low with the alphabet soup of new variants making up the majority of cases. My suspicion is that cases will rise throughout the holidays, with all of the indoor get-togethers; but that the wave will be more like the recent BA.2.12.1 and BA.5 waves than either of the past two huge winter waves.

Monday, November 7, 2022

Scenes from the October jobs report: deceleration and deterioration, but no downturn signaled


 - by New Deal democrat

No economic news of note today or tomorrow, except the (very late) Q3 Senior Loan Officers Report this afternoon, which will tell us about the state of credit, but is anticipated in much more timely - i.e., weekly - fashion by the Chicago Fed’s Financial Conditions Index.


So let’s take a look at some noteworthy items from last Friday’s jobs report.

As I headlined my blurb on Friday, this report continued the process of deceleration. In fact, we had the lowest amount of jobs growth since the pandemic lockdowns with the exception of December 2020:


And, to reiterate for the umpteenth time, consumption leads jobs. One good point I’ve seen others make, and is well taken, is that this year consumption has switched over from goods (Amazon et al delivering to your door) to services. Here’s a look at both, normed to 100 just before the pandemic hit:


You can see that retail spending boomed, especially after the 2021 stimulus, and has since declined somewhat, while the broader measure of consumer spending has continued to increase, at a slower pace.

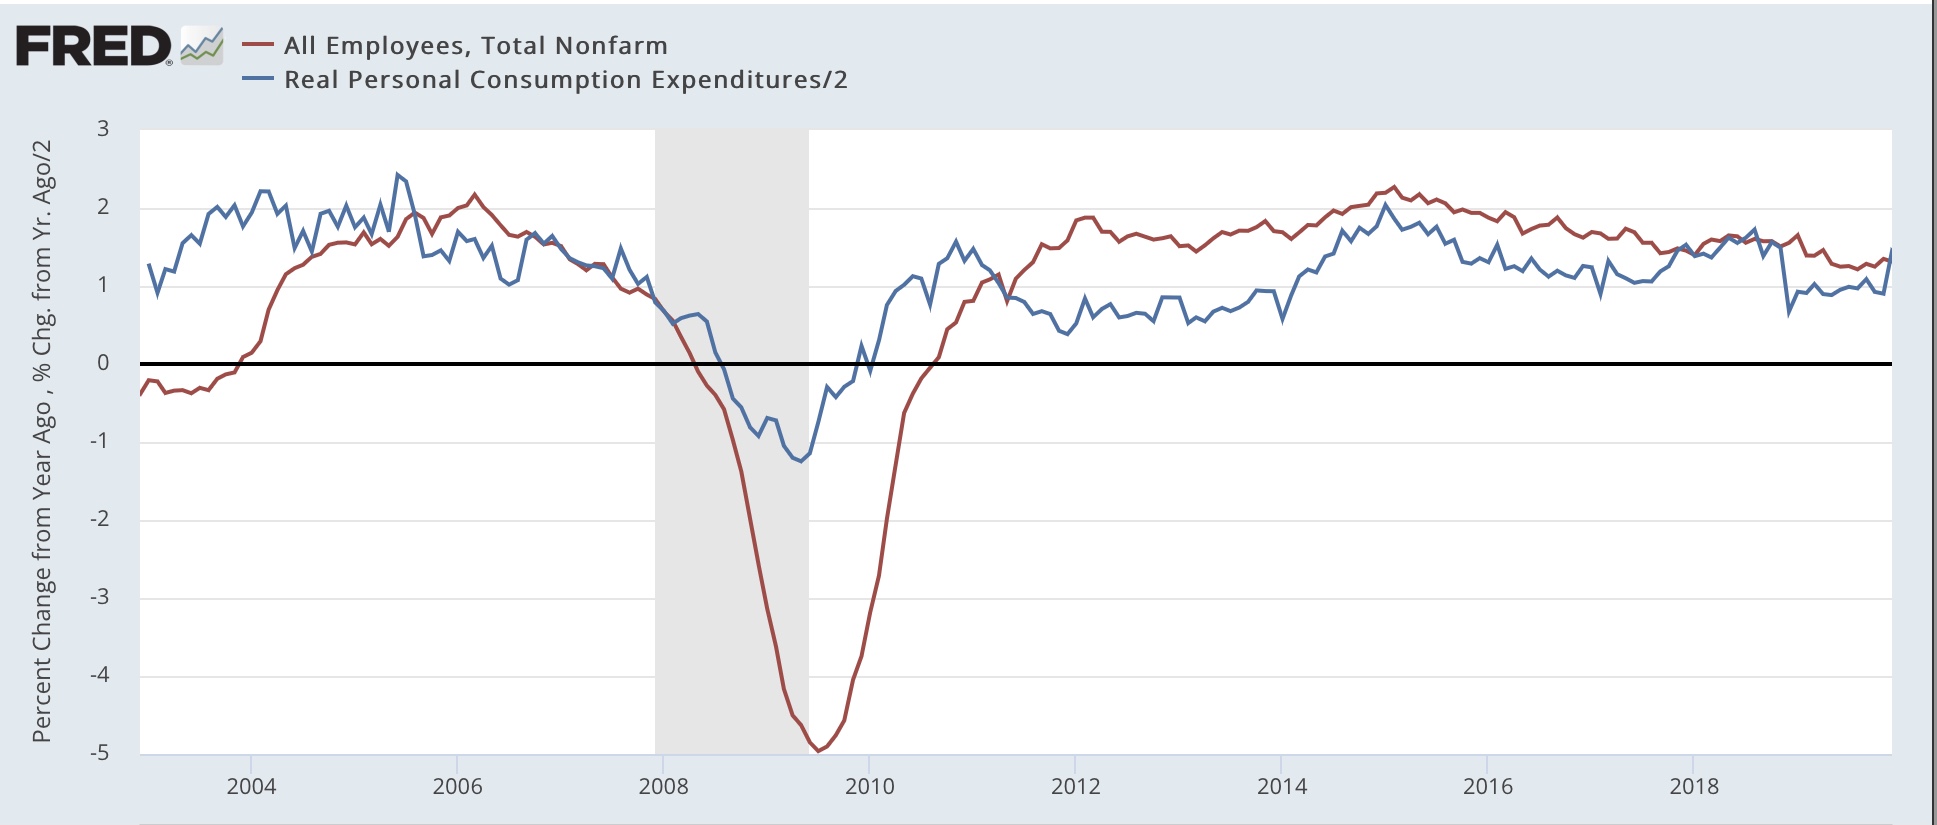
Since real personal consumption expenditures is the flip side of the coin of real retail sales, but more broadly includes services spending, here’s a historical look of the YoY% change in that (/2 for scale) vs. payrolls:


Just like real retail sales, it has done a good job anticipating the near term changes in job growth.

Now here is the same metric for real retail sales (blue), real personal consumption expenditures (gold), and jobs (red) since just before the pandemic:


As noted in the first graph above, job growth has been slowing down, but not yet to the level of either of the measures of consumption. But it’s slowly getting there.

Another point I made last week several times is that jobless claims lead the unemployment rate. Here’s the updated graph of that relationship with Friday’s increase in unemployment added:


We’re probably now at the unemployment rate most consistent with the recent small rise in jobless claims.

There are several other leading indicators in the jobs report. One is temporary hiring:


In the past, a downturn has started a number of months before any recession. That isn’t at all the case here.

Another leading indicator is the number of hours in the average manufacturing work week. Manufacturing tends to turn down before services, and typically hours get cut before layoffs occur. In the past the recession threshold has been a decline of -0.6 hours YoY:


At present, there has been a decline of as much as -0.4 hours, and presently -0.2 hours, so not yet quite at the level indicating an oncoming recession:


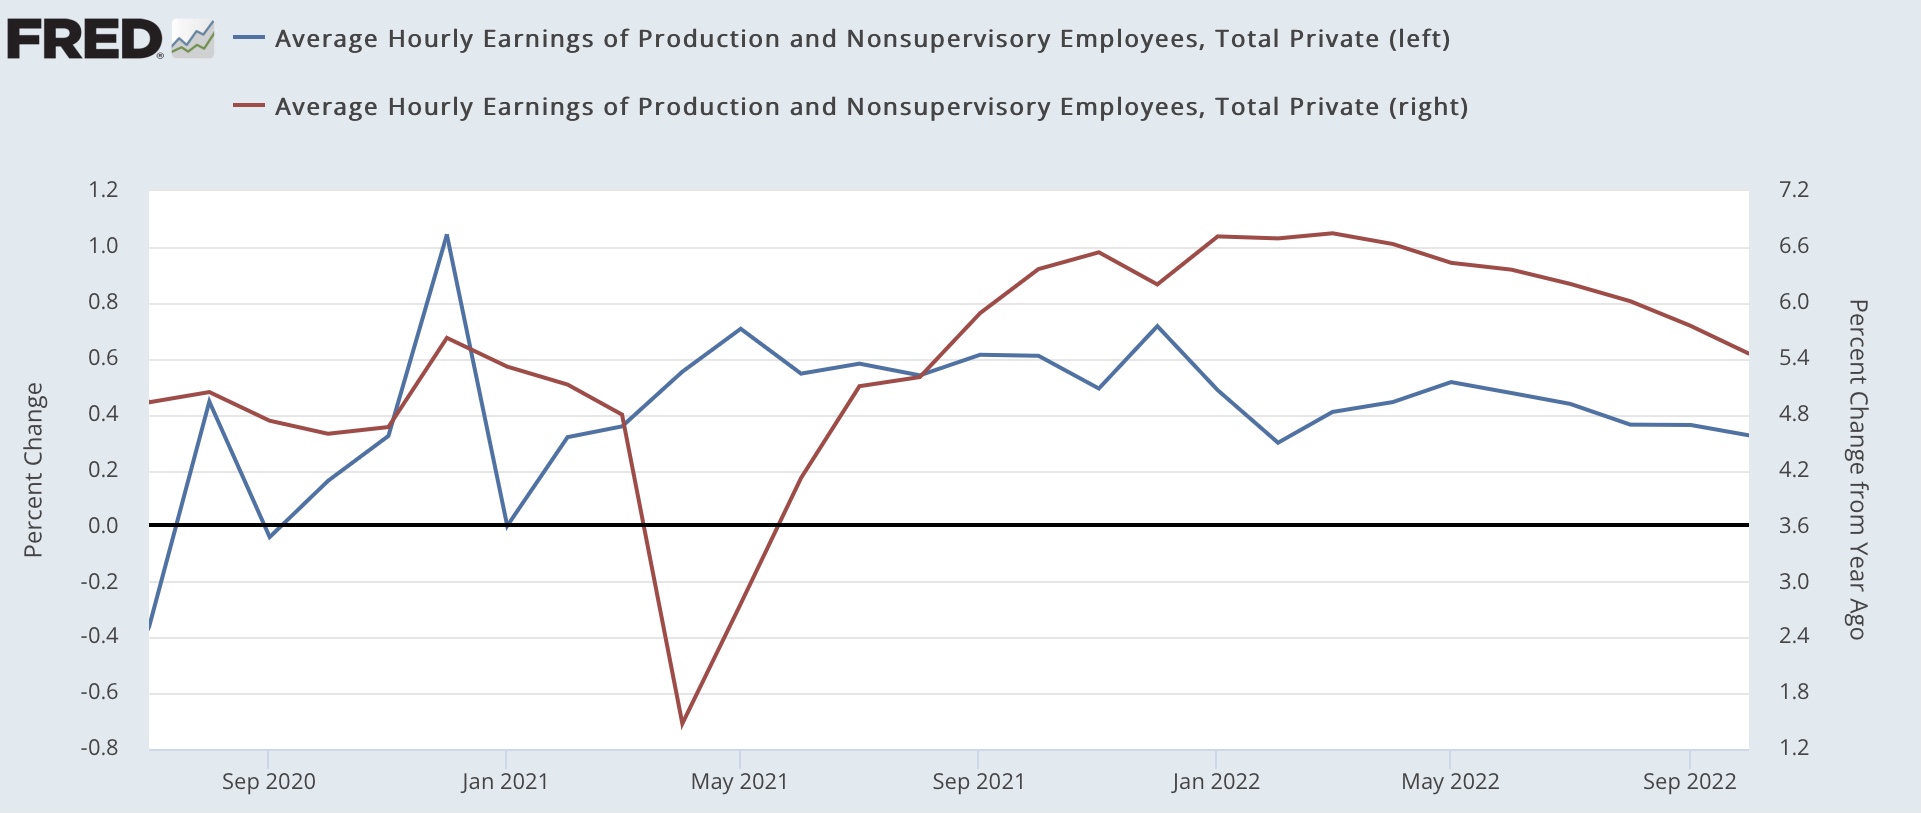
Turning from leading indicators to inflation concerns, i.e., wage growth, this has also decelerated. Below I show the monthly % change in wages (blue) vs. the YoY% change (red) for non-supervisory workers:


Wage growth has continued, but at a steadily decelerating rate for nearly a year. By way of comparison, in 2018 and 2019 wage growth averaged 3.3% annually, vs. 5.5% for the past 12 months vs. a peak of 6.7% past May.

Finally, real aggregate payrolls for non-supervisory workers (essentially, total real compensation for the working and middle classes) is an excellent coincident marker for the onset of recessions. Here’s the historical record for the past nearly 60 years:


This is an almost perfect indicator. There are no false positives, except possibly the 2002-03 near double-dip. And there are no false negatives either. In other words, if the rate of YoY inflation starts to exceed the rate YoY aggregate payroll growth, you are within a month or two before or after the onset of a recession, period.

As of September, payroll growth exceeded inflation by 1.1%. We know that payrolls growth slowed in October. We’ll find out about inflation later this week.

To sum up: on Friday I wrote that the jobs report showed deceleration and deterioration, which it certainly did. On the other hand, deceleration and deterioration don’t mean an actual downturn - and we’re not there at this point. But the long leading indicators, as well as consumption, have been screaming for months to expect more deterioration, and we should.


Saturday, November 5, 2022

Weekly Indicators for October 31 - November 4 at Seeking Alpha


 - by New Deal democrat

My Weekly Indicators post is up at Seeking Alpha.

Data doesn’t move relentlessly in one direction, and this week there was some improvement in some of the indicators I follow.

As usual, clicking over and reading will bring you up to the virtual economic moment, and reward me a little bit for my efforts.